


fig5
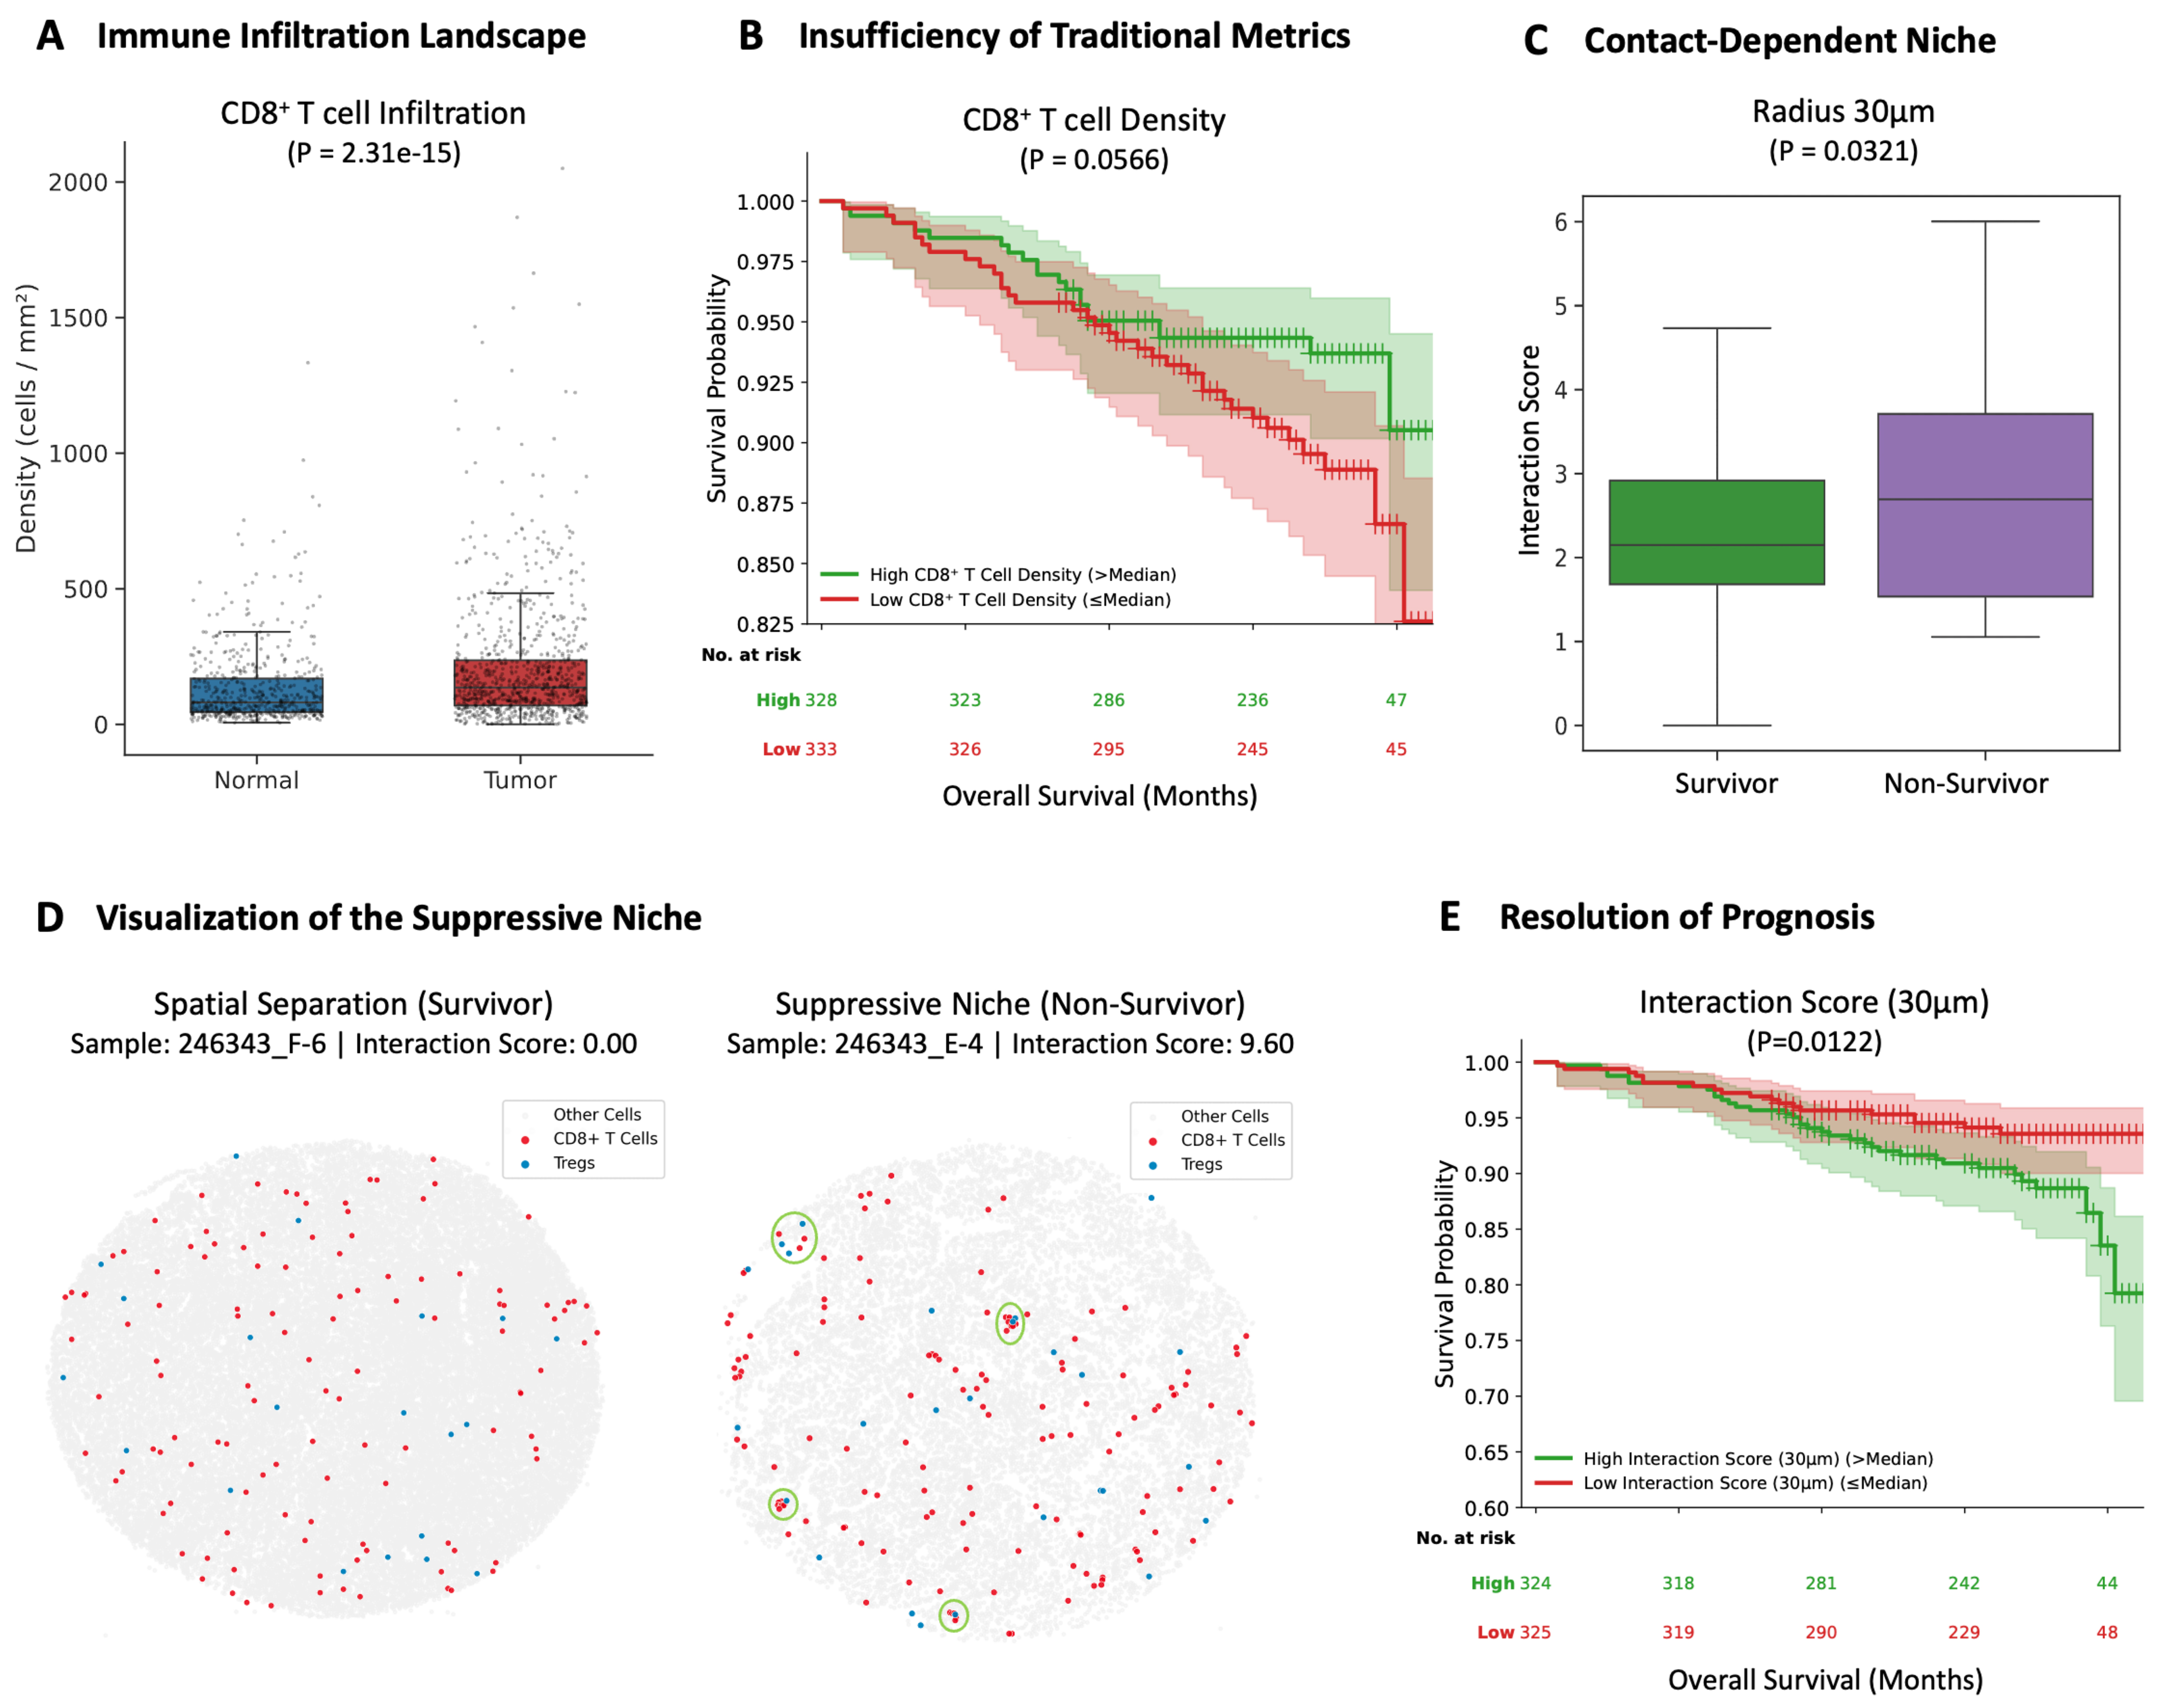
Figure 5. PhenoSSP reveals a proximity-dependent immunosuppressive niche that resolves the CD8+ T cell paradox in RCC. (A) Immune Infiltration Landscape. Quantitative analysis of cell density confirms that Tumor tissues exhibit a highly immunogenic phenotype with significantly higher CD8+ T cell infiltration compared to Normal tissues (P < 0.001); (B) Insufficiency of Traditional Metrics. Kaplan-Meier survival analysis reveals that CD8+ T cell density alone is insufficient to predict patient survival (P = 0.057). Although a marginal trend towards favorable prognosis was observed for high infiltration, it failed to reach statistical significance, highlighting the prognostic limitation of simple cell quantification in RCC; (C) Proximity-Dependent Niche. To investigate the mechanism of this failure, we calculated the Interaction Score (density-normalized enrichment within 30 μm). Results show that non-survivors exhibit a specific enrichment of Tregs in the immediate vicinity of CD8+ T cells compared to survivors (P = 0.032), suggesting active proximity-dependent suppression; (D) Visualization of the Suppressive Niche. Representative spatial maps of CD8+ T cells (red) and Tregs (blue). Left (Survivor, Sample 246343_F-6): Displays a “cold” interaction phenotype (Score = 0.00), characterized by the distinct spatial separation of effector and suppressor cells. Right (Non-Survivor, Sample 246343_E-4): Exhibits a dense “suppressive niche” (Score = 9.60). Green circles highlight areas where CD8+ T cells are physically surrounded by Tregs, indicating an active proximity-dependent suppression mechanism; (E) Resolution of Prognosis. Incorporating the spatial dimension resolves the paradox. Patients with a high Interaction Score exhibit significantly shorter OS (P = 0.012), demonstrating that the spatial positioning of immune cells, rather than their absolute abundance, dictates clinical outcome. Statistical comparisons in (A) and (C) were performed using the Wilcoxon rank-sum test. Survival analyses in (B) and (E) were conducted using Kaplan-Meier estimation with the log-rank test. Patients were stratified into high and low groups using the median value as the cutoff. RCC: Renal cell carcinoma; Tregs: regulatory T cells; OS: overall survival.


