


fig4
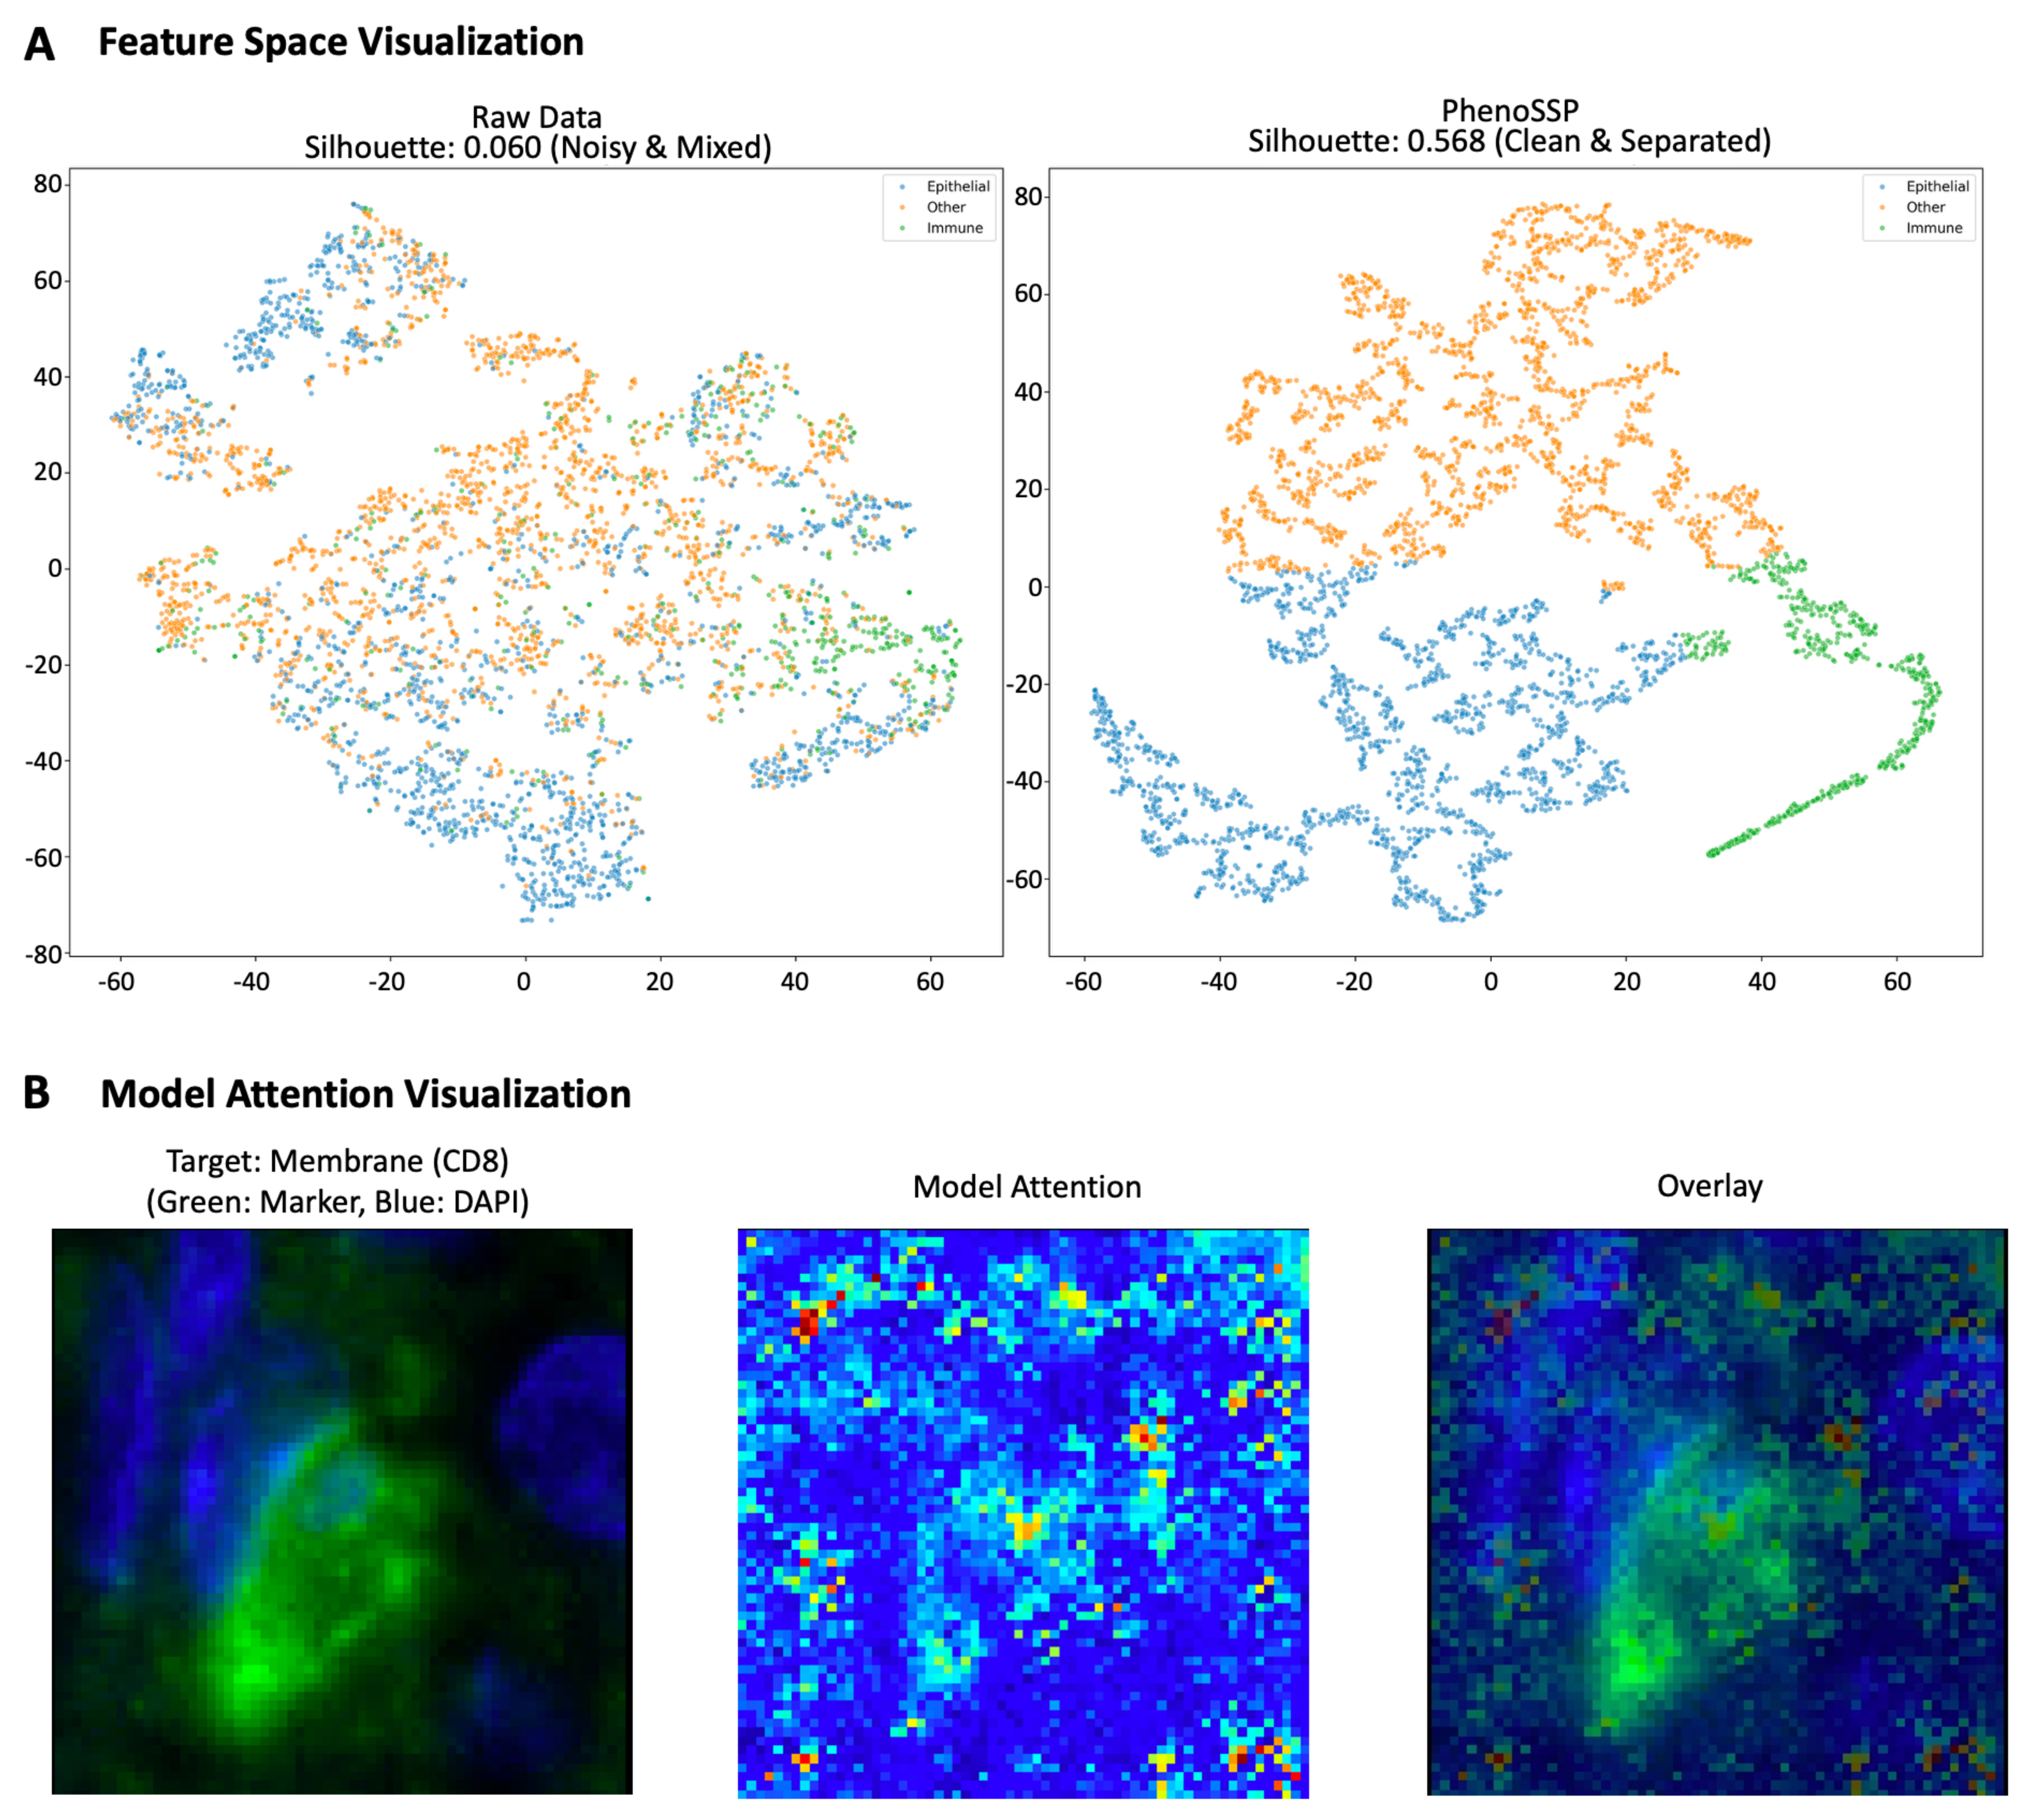
Figure 4. Interpretability of deep spatial features. (A) Feature space visualization (t-SNE) and clustering metrics. Left: Raw intensity features show significant overlap between Epithelial (blue), Immune (green), and Other (orange) cells with a low Silhouette score (0.060), highlighting the challenge of noise in the raw domain. Right: PhenoSSP-extracted features reveal a highly structured latent space with a significantly improved Silhouette score (0.568). The model successfully projects semantically distinct cell types into well-separated clusters, demonstrating strong discriminative power; (B) Saliency map visualization of subcellular localization. The heatmap displays pixel-wise importance derived from input gradients. For the representative CD8+ T cell shown, the model’s attention (red/yellow) forms a ring structure that precisely aligns with the cell membrane (green marker) and surrounds the nucleus (blue), demonstrating that the model correctly leverages membrane-bound protein signals for classification. t-SNE: t-distributed stochastic neighbor embedding; DAPI: 4′,6-diamidino-2-phenylindole.


