


fig2
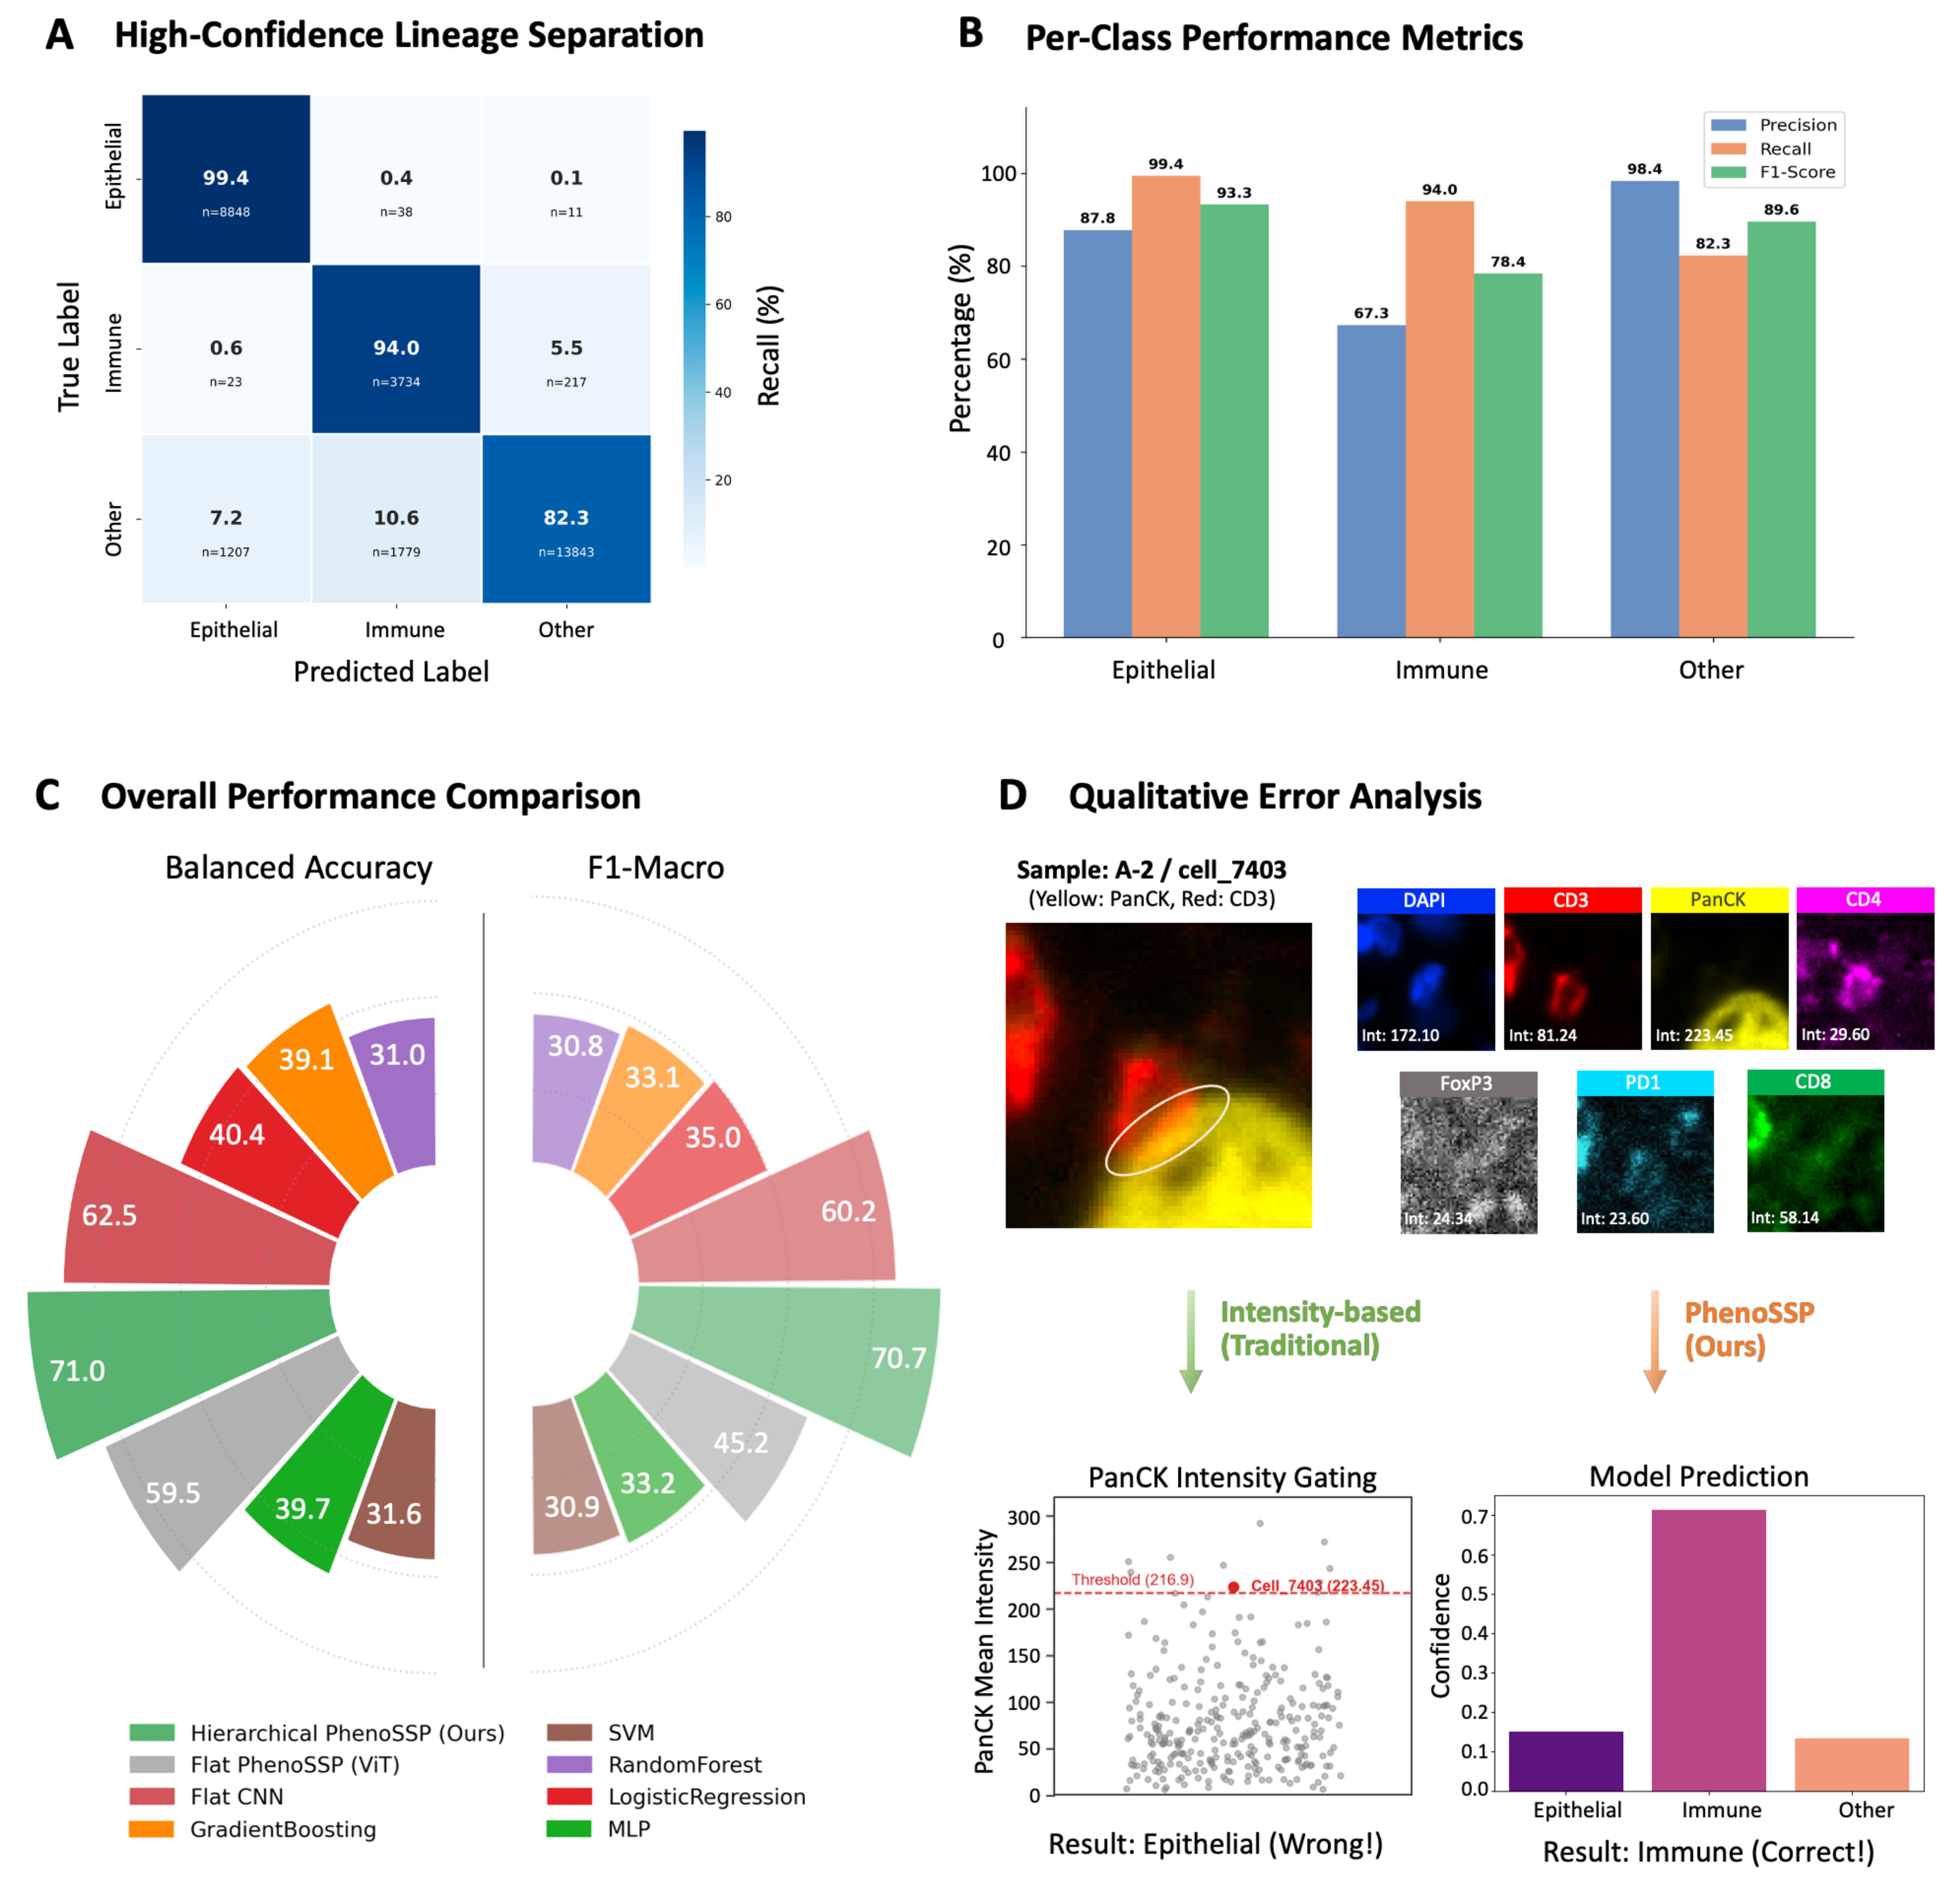
Figure 2. PhenoSSP demonstrates superior performance in immune phenotyping. (A) Lineage Separation Matrix. Confusion matrix of the Coarse Classifier, demonstrating near-perfect separation of Epithelial (99.4% recall) and Immune lineages (94.0% recall); (B) Per-Class Performance Metrics. Bar chart showing Precision, Recall, and F1-scores for the three coarse lineages. The model achieves a robust F1-score of 78.4% for the aggregated Immune class, laying a solid foundation for the subsequent fine-grained classification stage; (C) Overall Performance Benchmark. Circular bar plot comparing Balanced Accuracy and F1-Macro scores across different models. PhenoSSP (green) significantly outperforms Flat CNN (red) and Flat ViT (grey) architectures, while traditional machine learning methods (orange/brown) show limited capability in this complex task; (D) Qualitative Error Analysis on a “Hard Example” (Sample A-2/cell_7403). Top: Single-channel visualizations reveal an “Intensity Trap” scenario where the cell exhibits misleadingly high intensity in the PanCK channel (223.45), a marker typically exclusive to tumor cells. Bottom: Prediction confidence analysis. Despite the confounding PanCK signal, PhenoSSP correctly classifies the cell as “Immune” with high confidence (> 0.7), proving its ability to prioritize robust deep spatial features over noisy intensity values. CNN: Convolutional neural network; ViT: Vision Transformer; SVM: support vector machine; MLP: multi-layer perceptron; DAPI: 4′,6-diamidino-2-phenylindole.


