


fig2
From: Unveiling the role of UGT enzymes in chemoresistance: a path to enhanced cancer pharmacotherapy
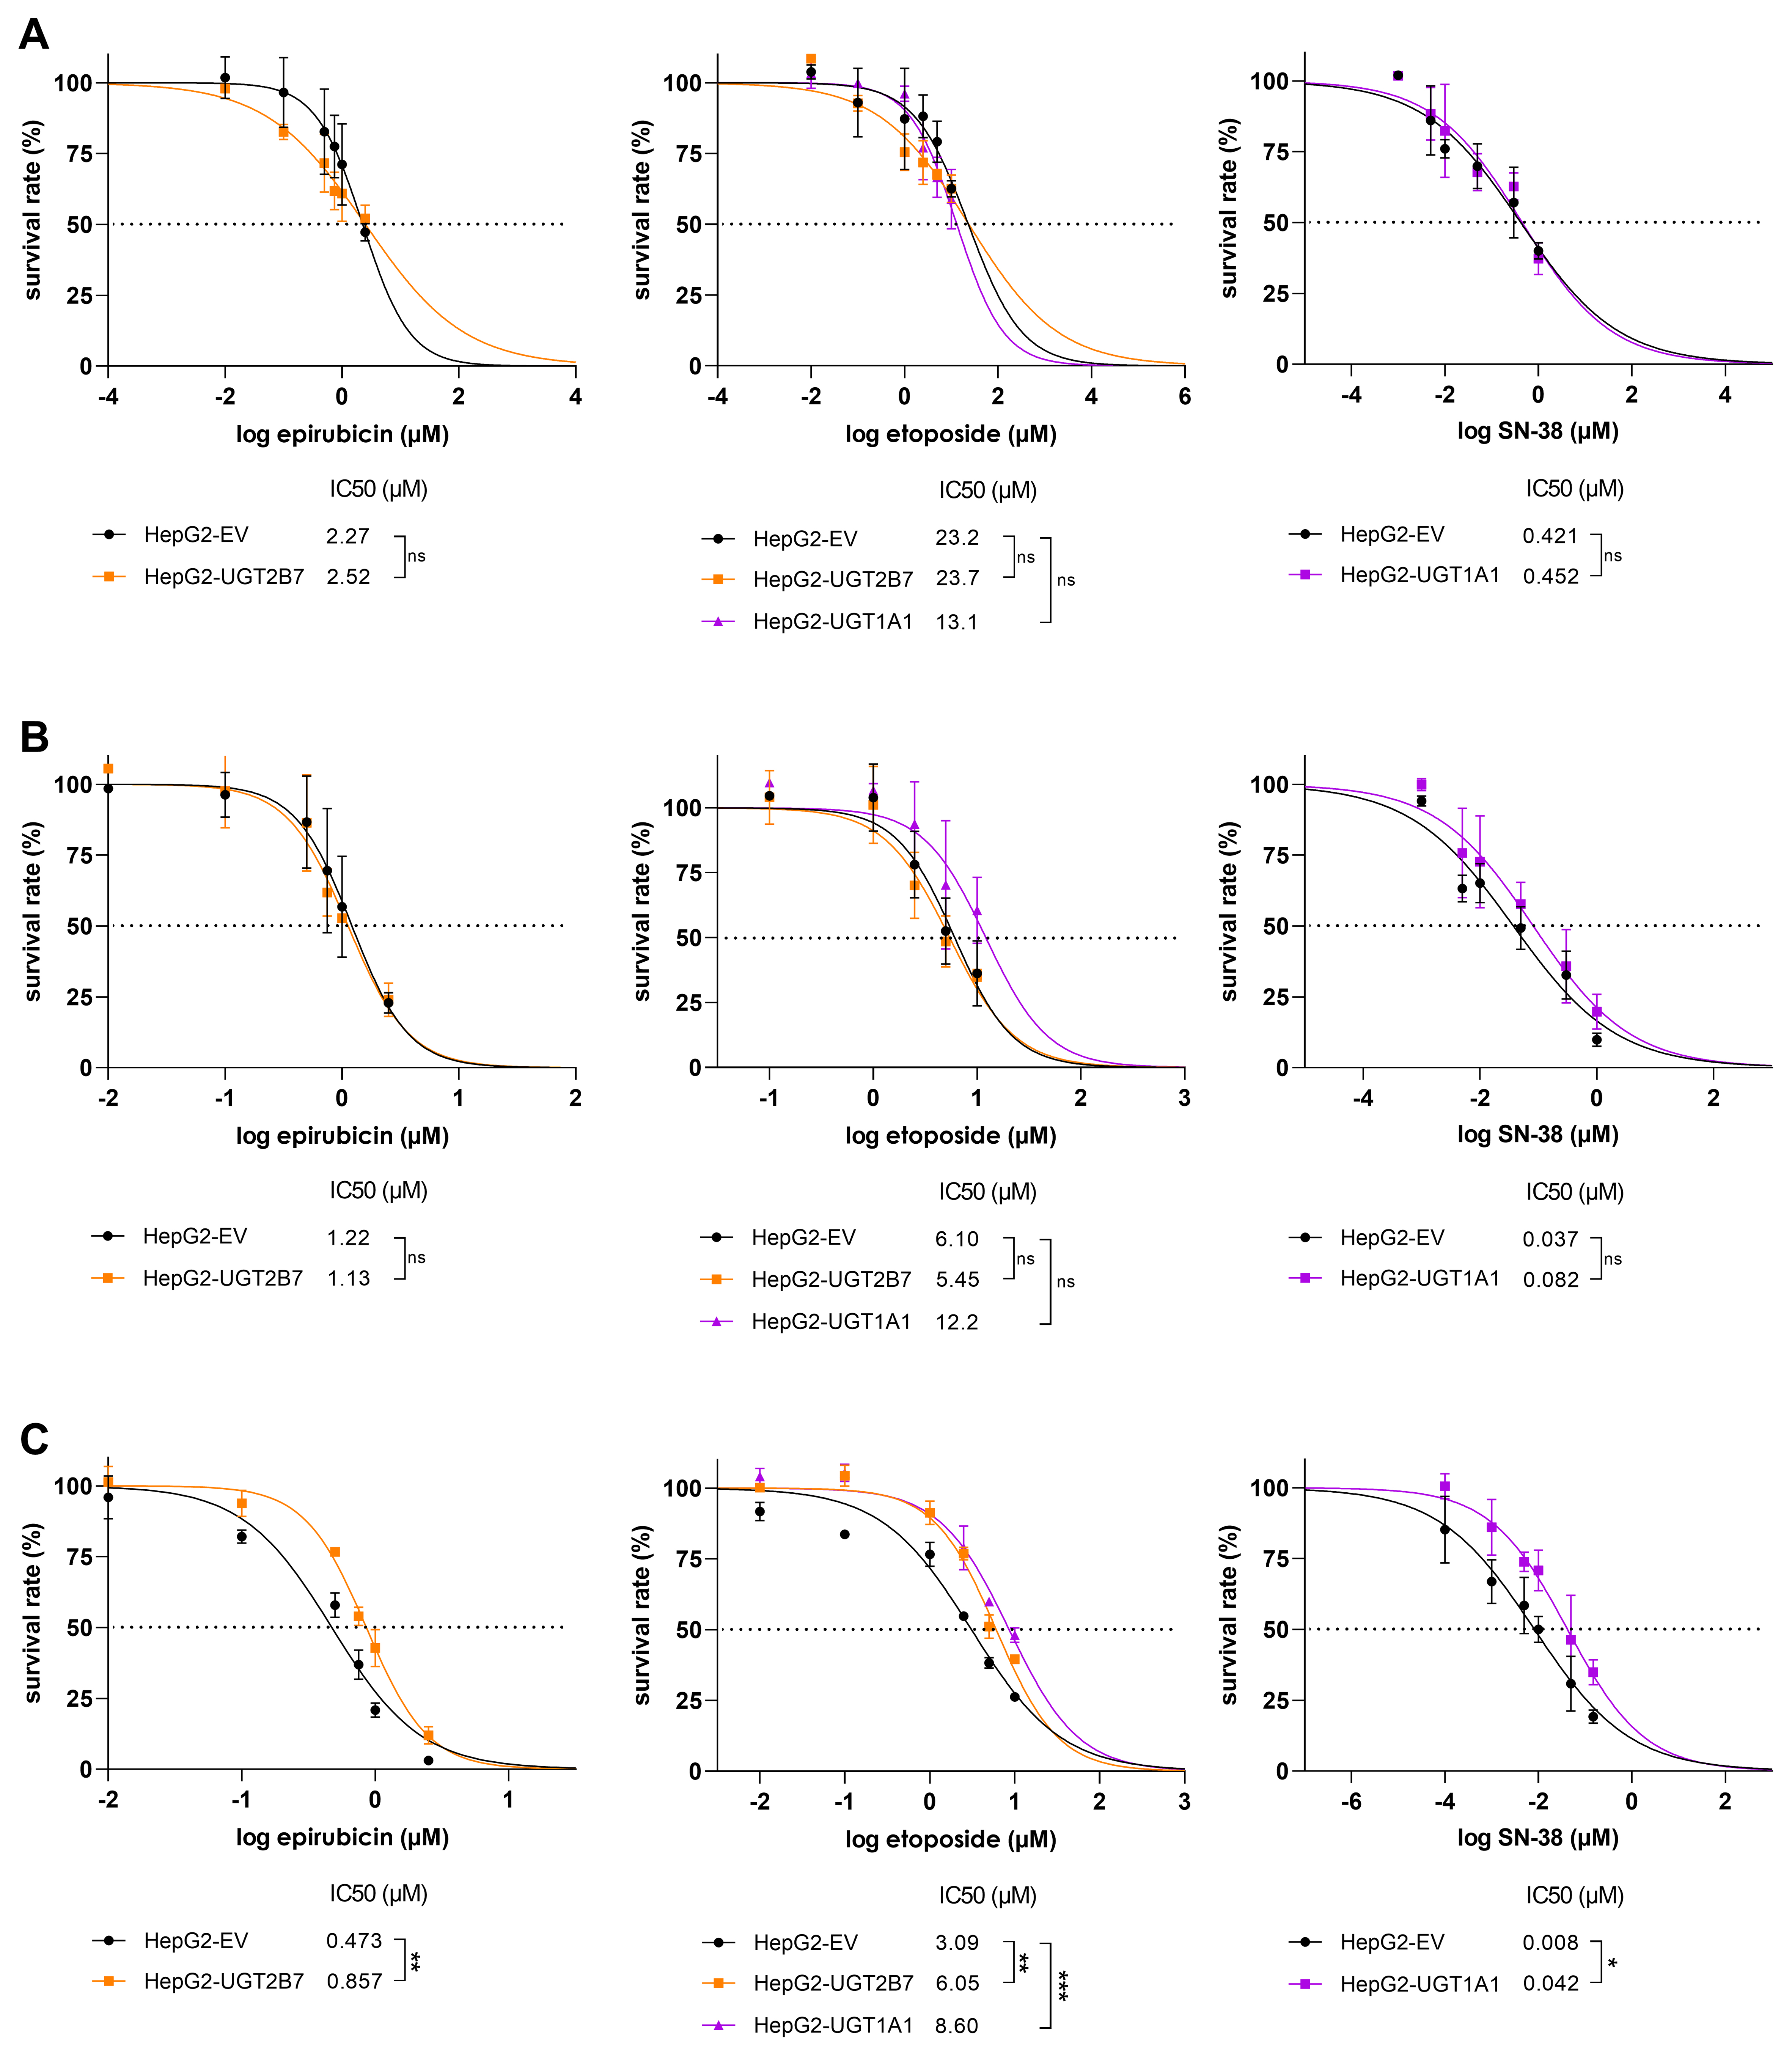
Figure 2. Survival rates of HepG2-EV, HepG2-UGT2B7, and HepG2-UGT1A1 cells after treatment with epirubicin, etoposide, or SN-38. Cells were treated for (A) 24 h, (B) 48 h, or (C) 72 h. Cell viability was assessed using the CellTiter-Glo® 2.0 Cell Viability Assay. IC50 values were calculated and then statistically compared using a two-tailed unpaired t-test or one-way ANOVA followed by Tukey’s test for multiple comparisons with three biological replicates. Significance levels are denoted as follows: ns = not significant (P > 0.05), *P < 0.05, **P < 0.01, and ***P < 0.001. ANOVA: analysis of variance.


