


fig3
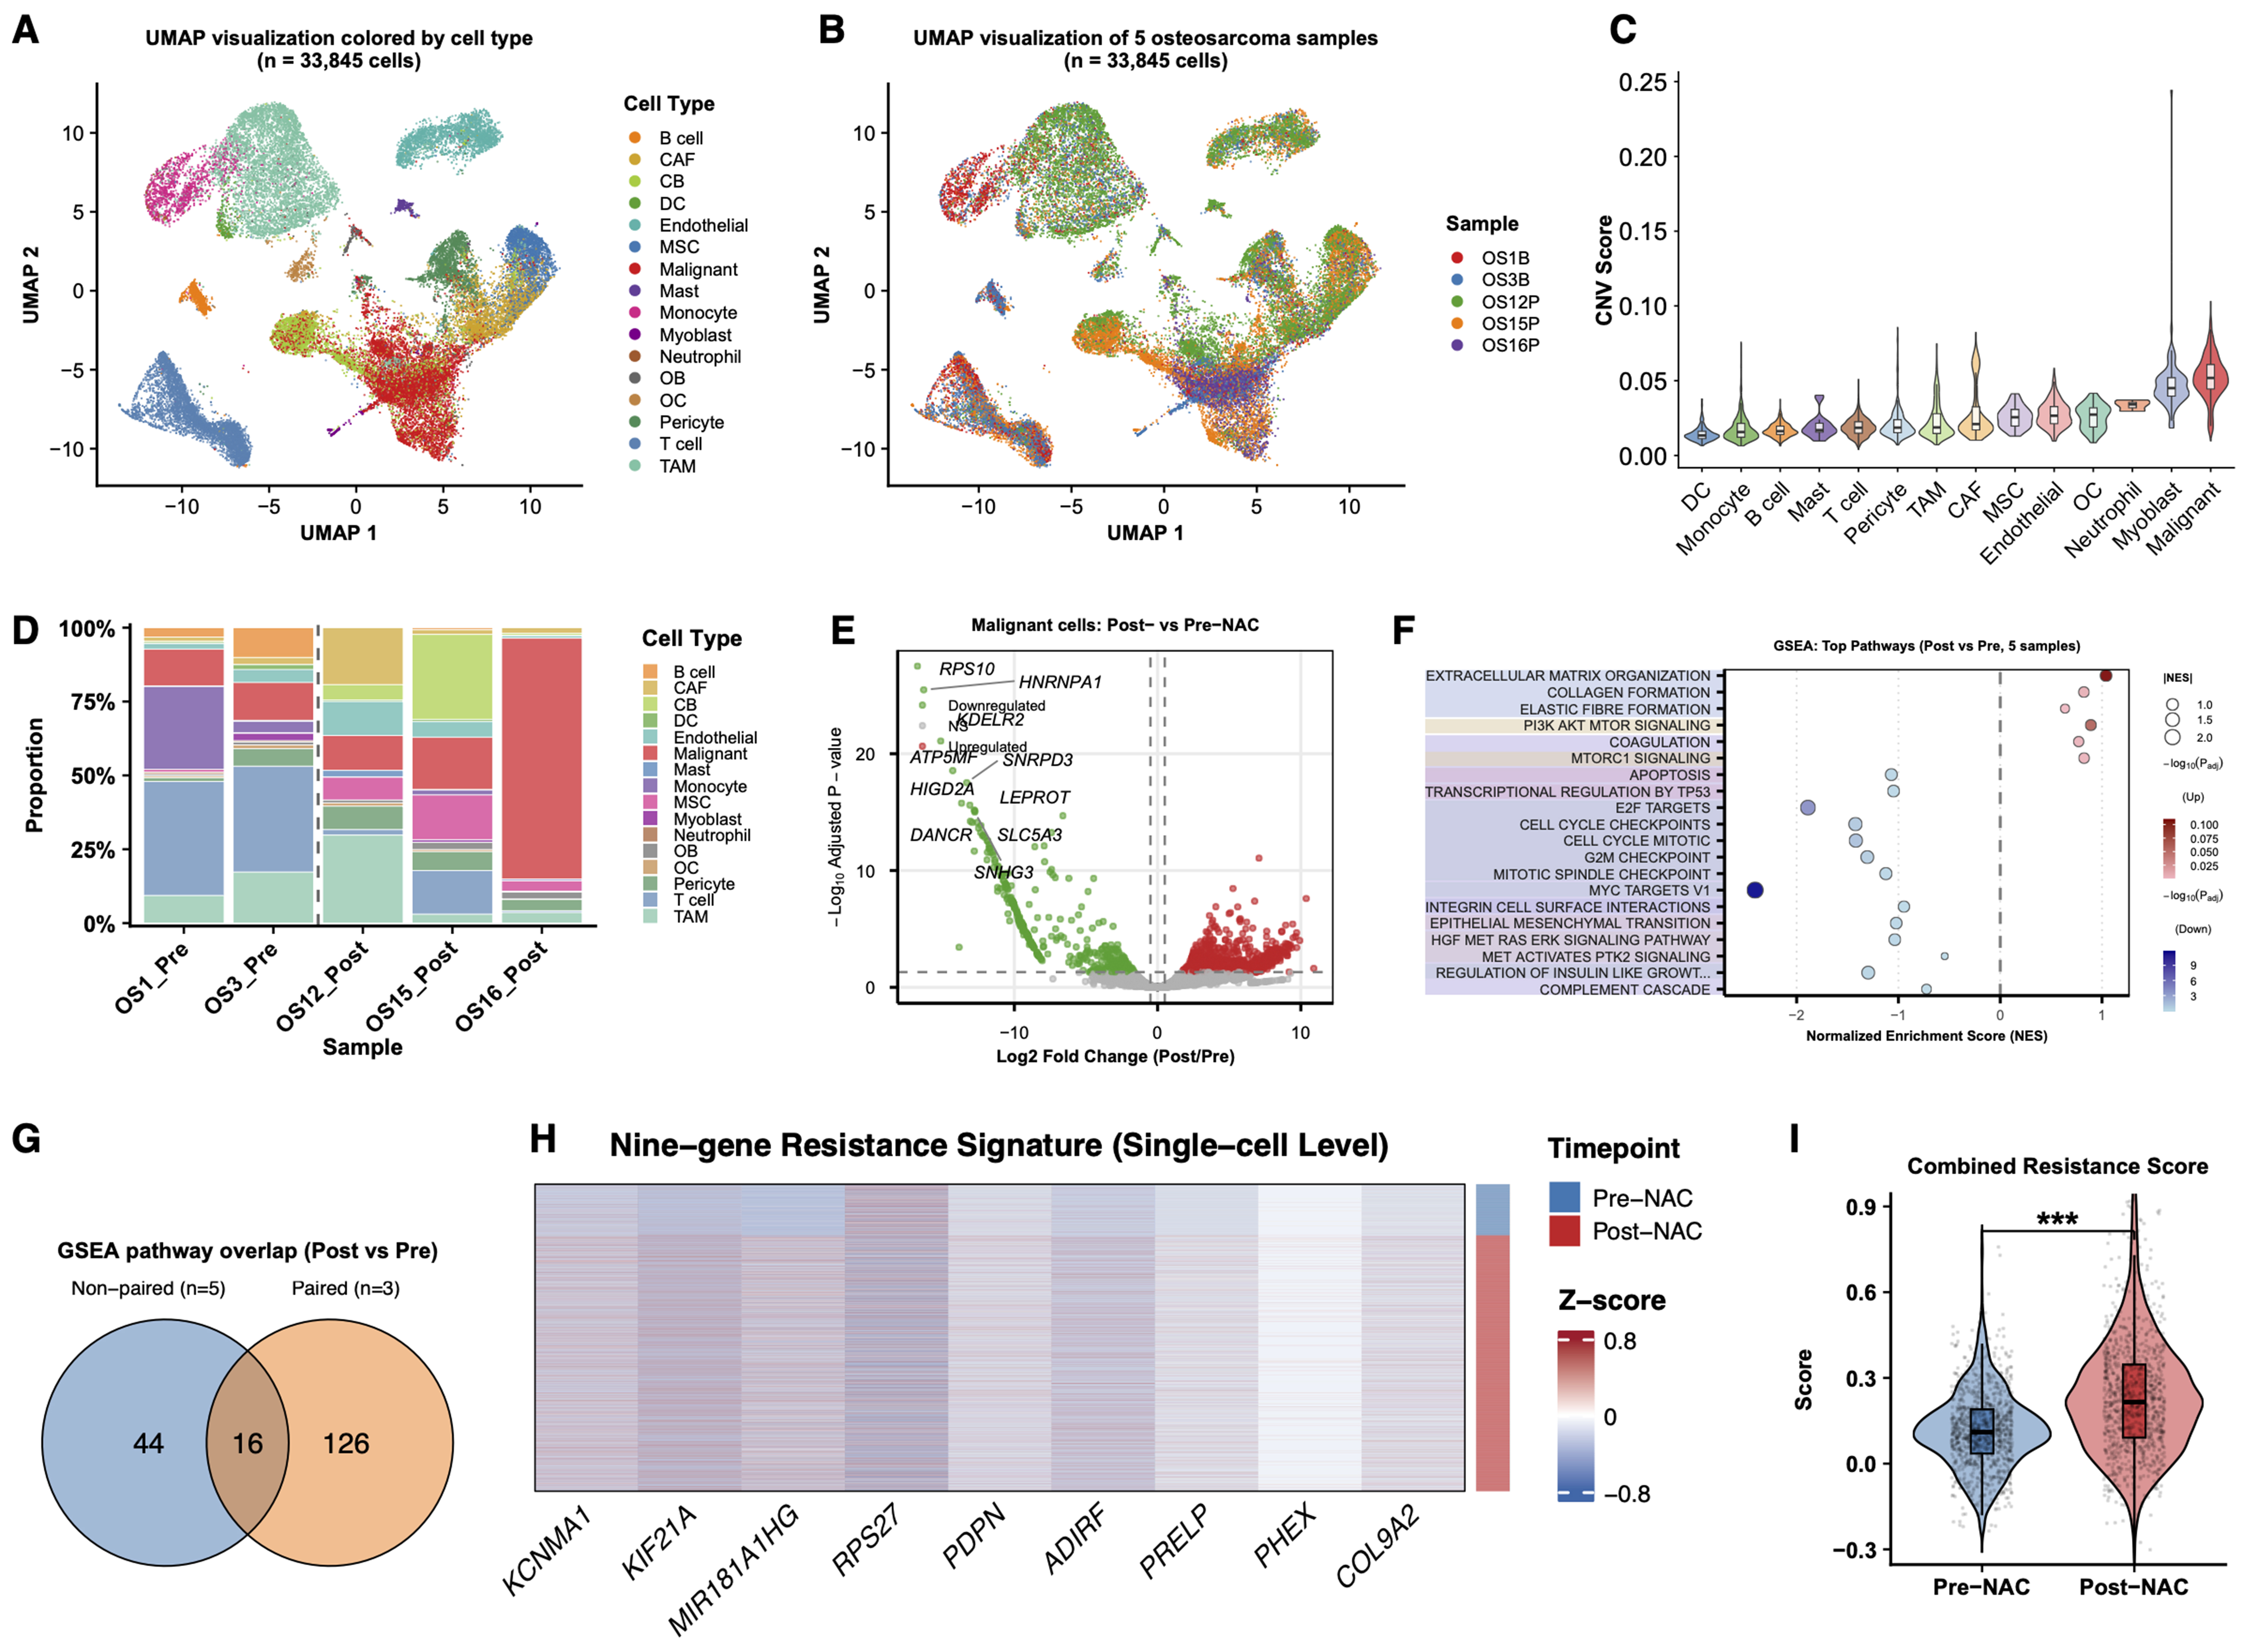
Figure 3. Independent unpaired scRNA-seq cohort supports the reproducibility of the resistance-associated malignant-cell program. (A) UMAP visualization of 33,845 single cells from five osteosarcoma samples, colored by annotated cell type; (B) UMAP visualization of the same cells colored by sample origin, including two pre-NAC samples (OS1B and OS3B) and three post-NAC samples (OS12P, OS15P, and OS16P); (C) Comparison of inferCNV scores across annotated cell populations, showing higher inferCNV signals in osteoblast-like malignant cells than in non-malignant microenvironmental cells; (D) Stacked bar plot showing the relative proportions of major cell populations across individual samples; (E) Exploratory differential expression analysis of malignant cells comparing post-NAC vs. pre-NAC samples; (F) Dot plot showing the top enriched pathways identified by GSEA in malignant cells from post-NAC vs. pre-NAC samples. Dot size indicates significance, and color indicates normalized enrichment score direction; (G) Overlap of significantly enriched pathways between the independent five-sample validation cohort and the paired discovery cohort; (H) Heatmap showing the expression of the nine resistance-associated genes in malignant cells, grouped by treatment status and sample origin; (I) Violin plot showing the combined resistance score calculated from the nine-gene signature in malignant cells from the pre-NAC and post-NAC groups. For (E), differential expression was assessed using a two-sided Wilcoxon rank-sum test. For (I), P values were calculated using a two-sided Wilcoxon rank-sum test; ***P < 0.001. scRNA-seq: Single-cell RNA sequencing; UMAP: uniform manifold approximation and projection; NAC: neoadjuvant chemotherapy; CNV: copy number variation; GSEA: Gene Set Enrichment Analysis; CAF: cancer-associated fibroblast; CB: chondroblast; DC: dendritic cell; MSC: mesenchymal stem cells; OB: osteoblast; OC: osteoclast; TAM: tumor-associated macrophage.


