


fig2
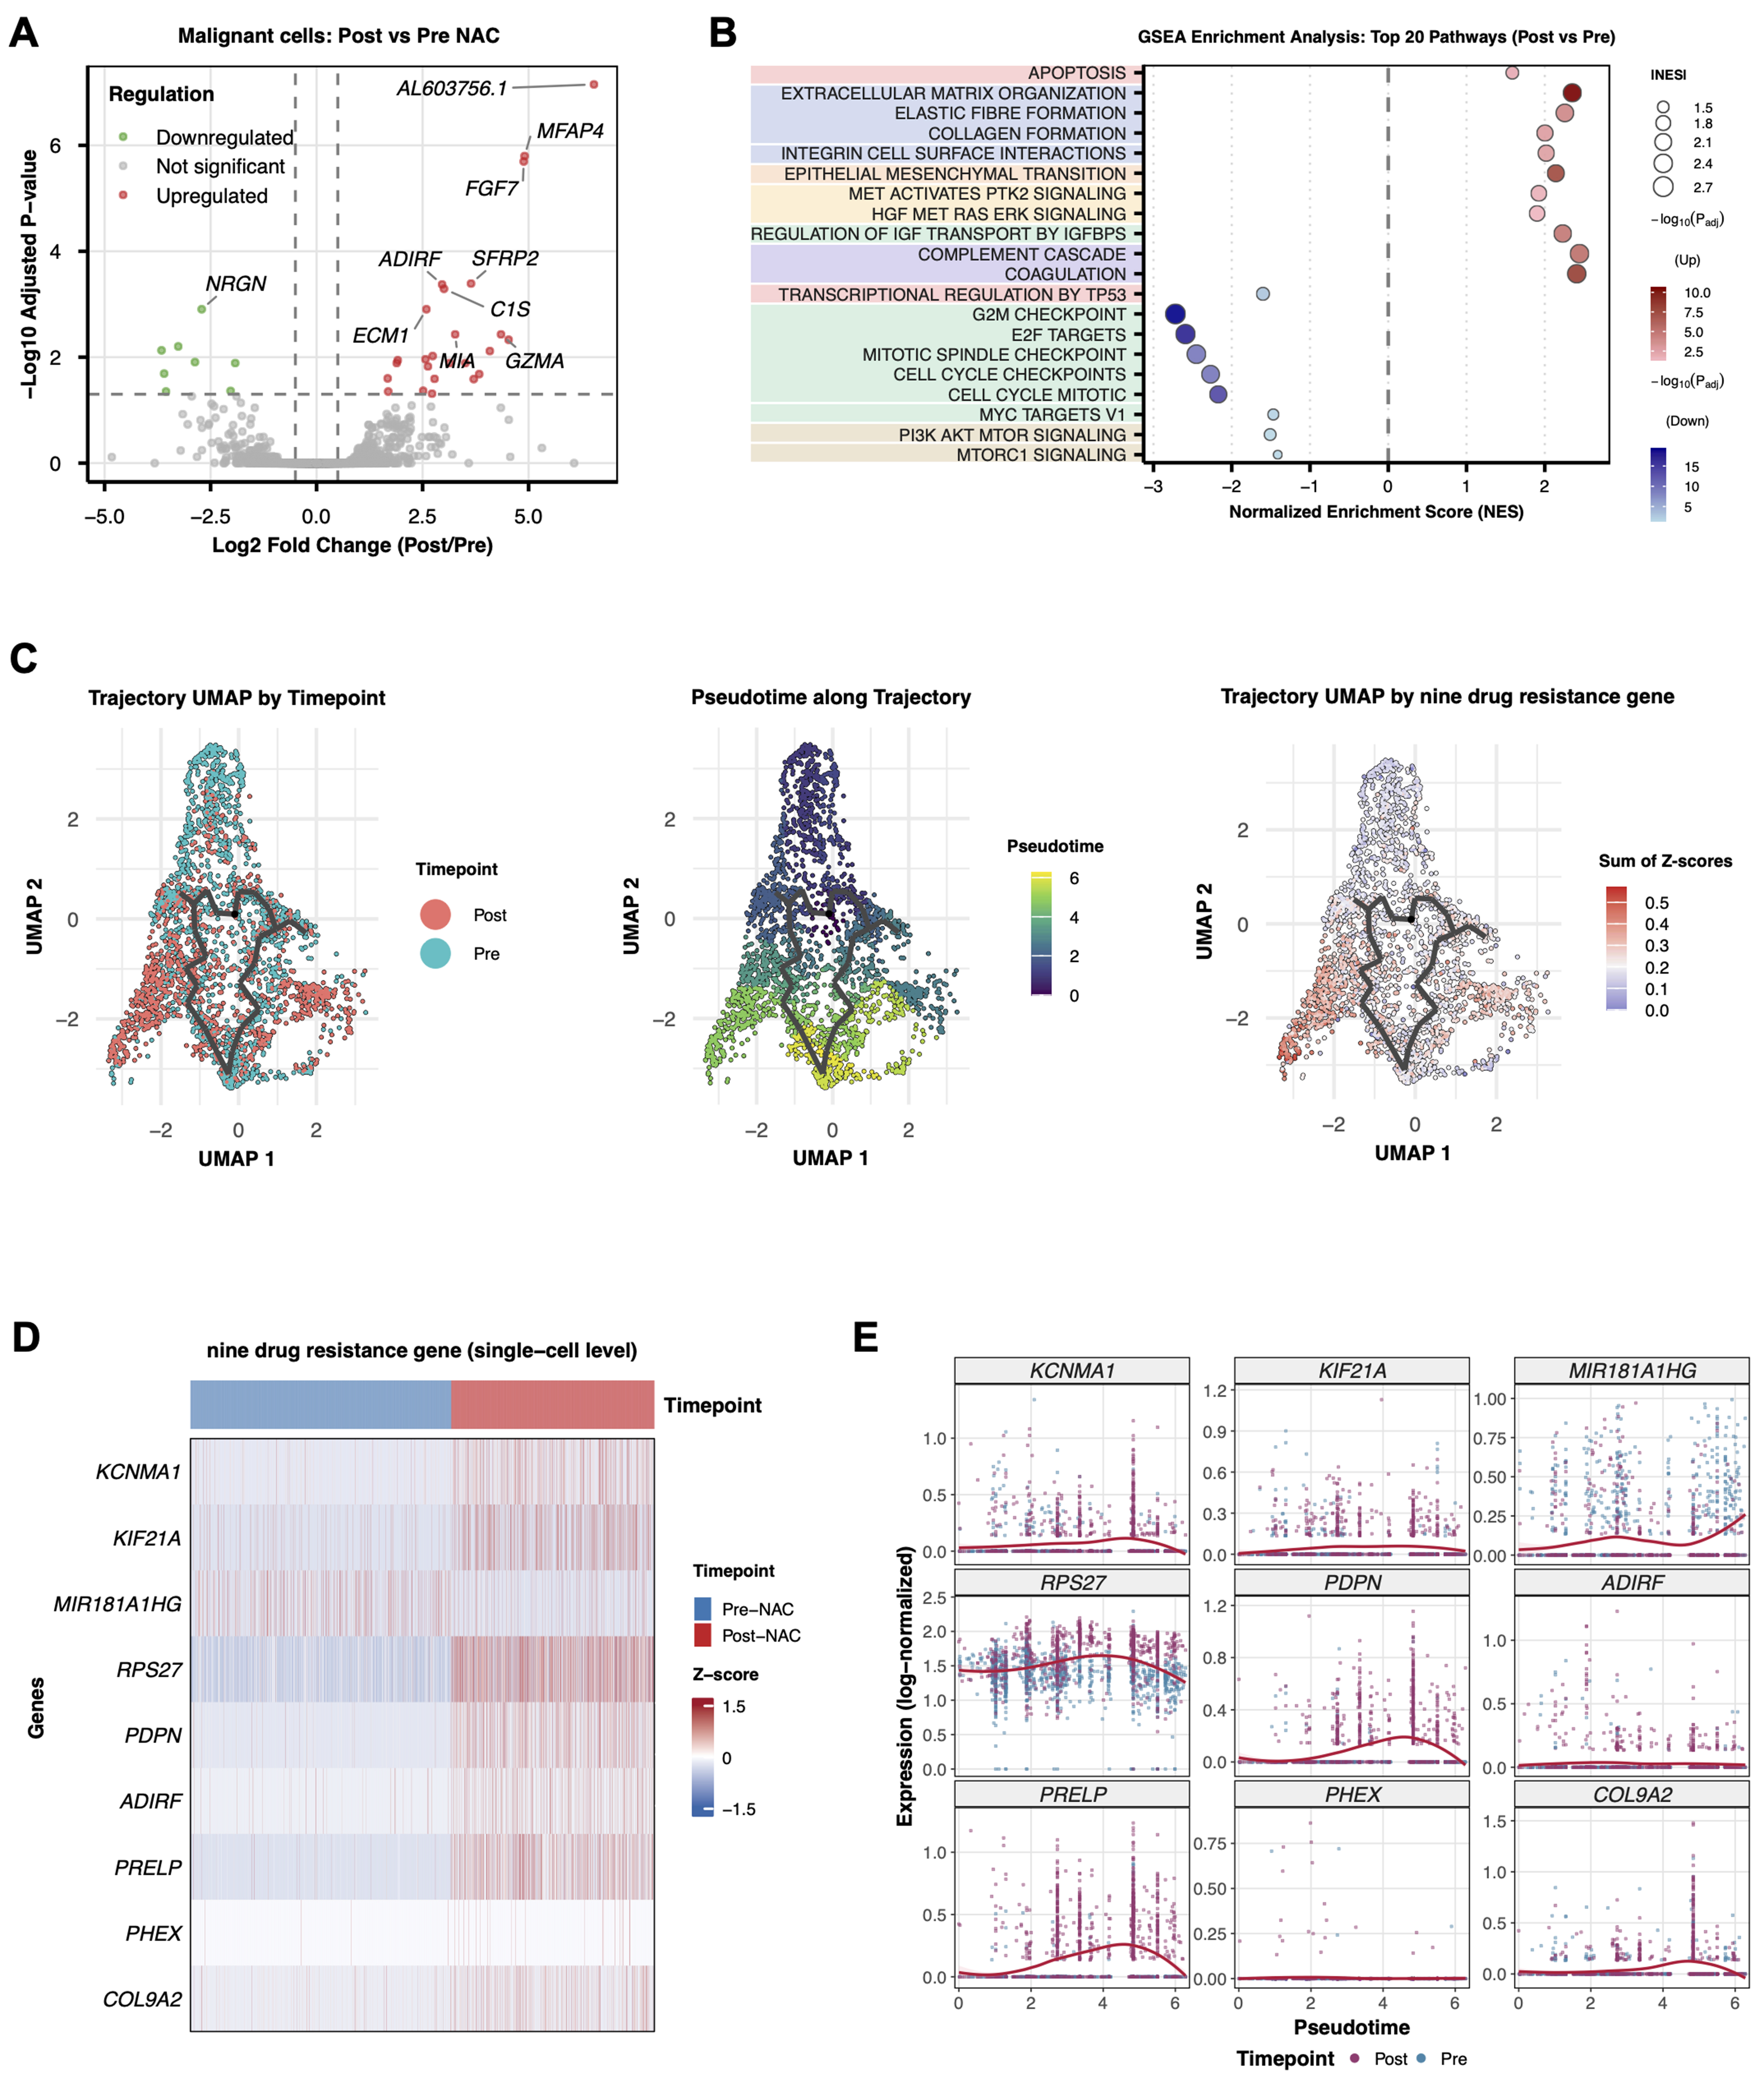
Figure 2. Chemotherapy-induced gene expression programs in tumor cells. (A) Volcano plot showing DEGs between pre-NAC and post-NAC tumor cells (n = 2,942 malignant cells total). Differential expression was assessed using a two-sided Wilcoxon rank-sum test with Bonferroni correction. Red dots indicate significantly upregulated genes; blue dots indicate significantly downregulated genes (adjusted P < 0.05, |log2FC| > 1); (B) GSEA showing differential pathway enrichment between post-NAC and pre-NAC tumor cells. Normalized enrichment scores and FDR q-values are indicated; (C) Pseudotime trajectory analysis of tumor cells using Monocle 3, reconstructing the developmental progression from pre-NAC (root state) to post-NAC resistant states. Cells are colored by timepoint (left), pseudotime value (middle), and the summed Z-score of the nine-gene resistance signature (right); (D) Heatmap displaying Z-score normalized expression levels of the nine resistance signature genes in pre-NAC (n = 1,847 cells) vs. post-NAC (n = 1,095 cells) tumor cells across all three patients; (E) Expression dynamics of the nine signature genes along the pseudotime trajectory, showing progressive upregulation toward resistant states. DEGs: Differentially expressed genes; NAC: neoadjuvant chemotherapy; GSEA: Gene Set Enrichment Analysis; FDR: false discovery rate.


