


fig1
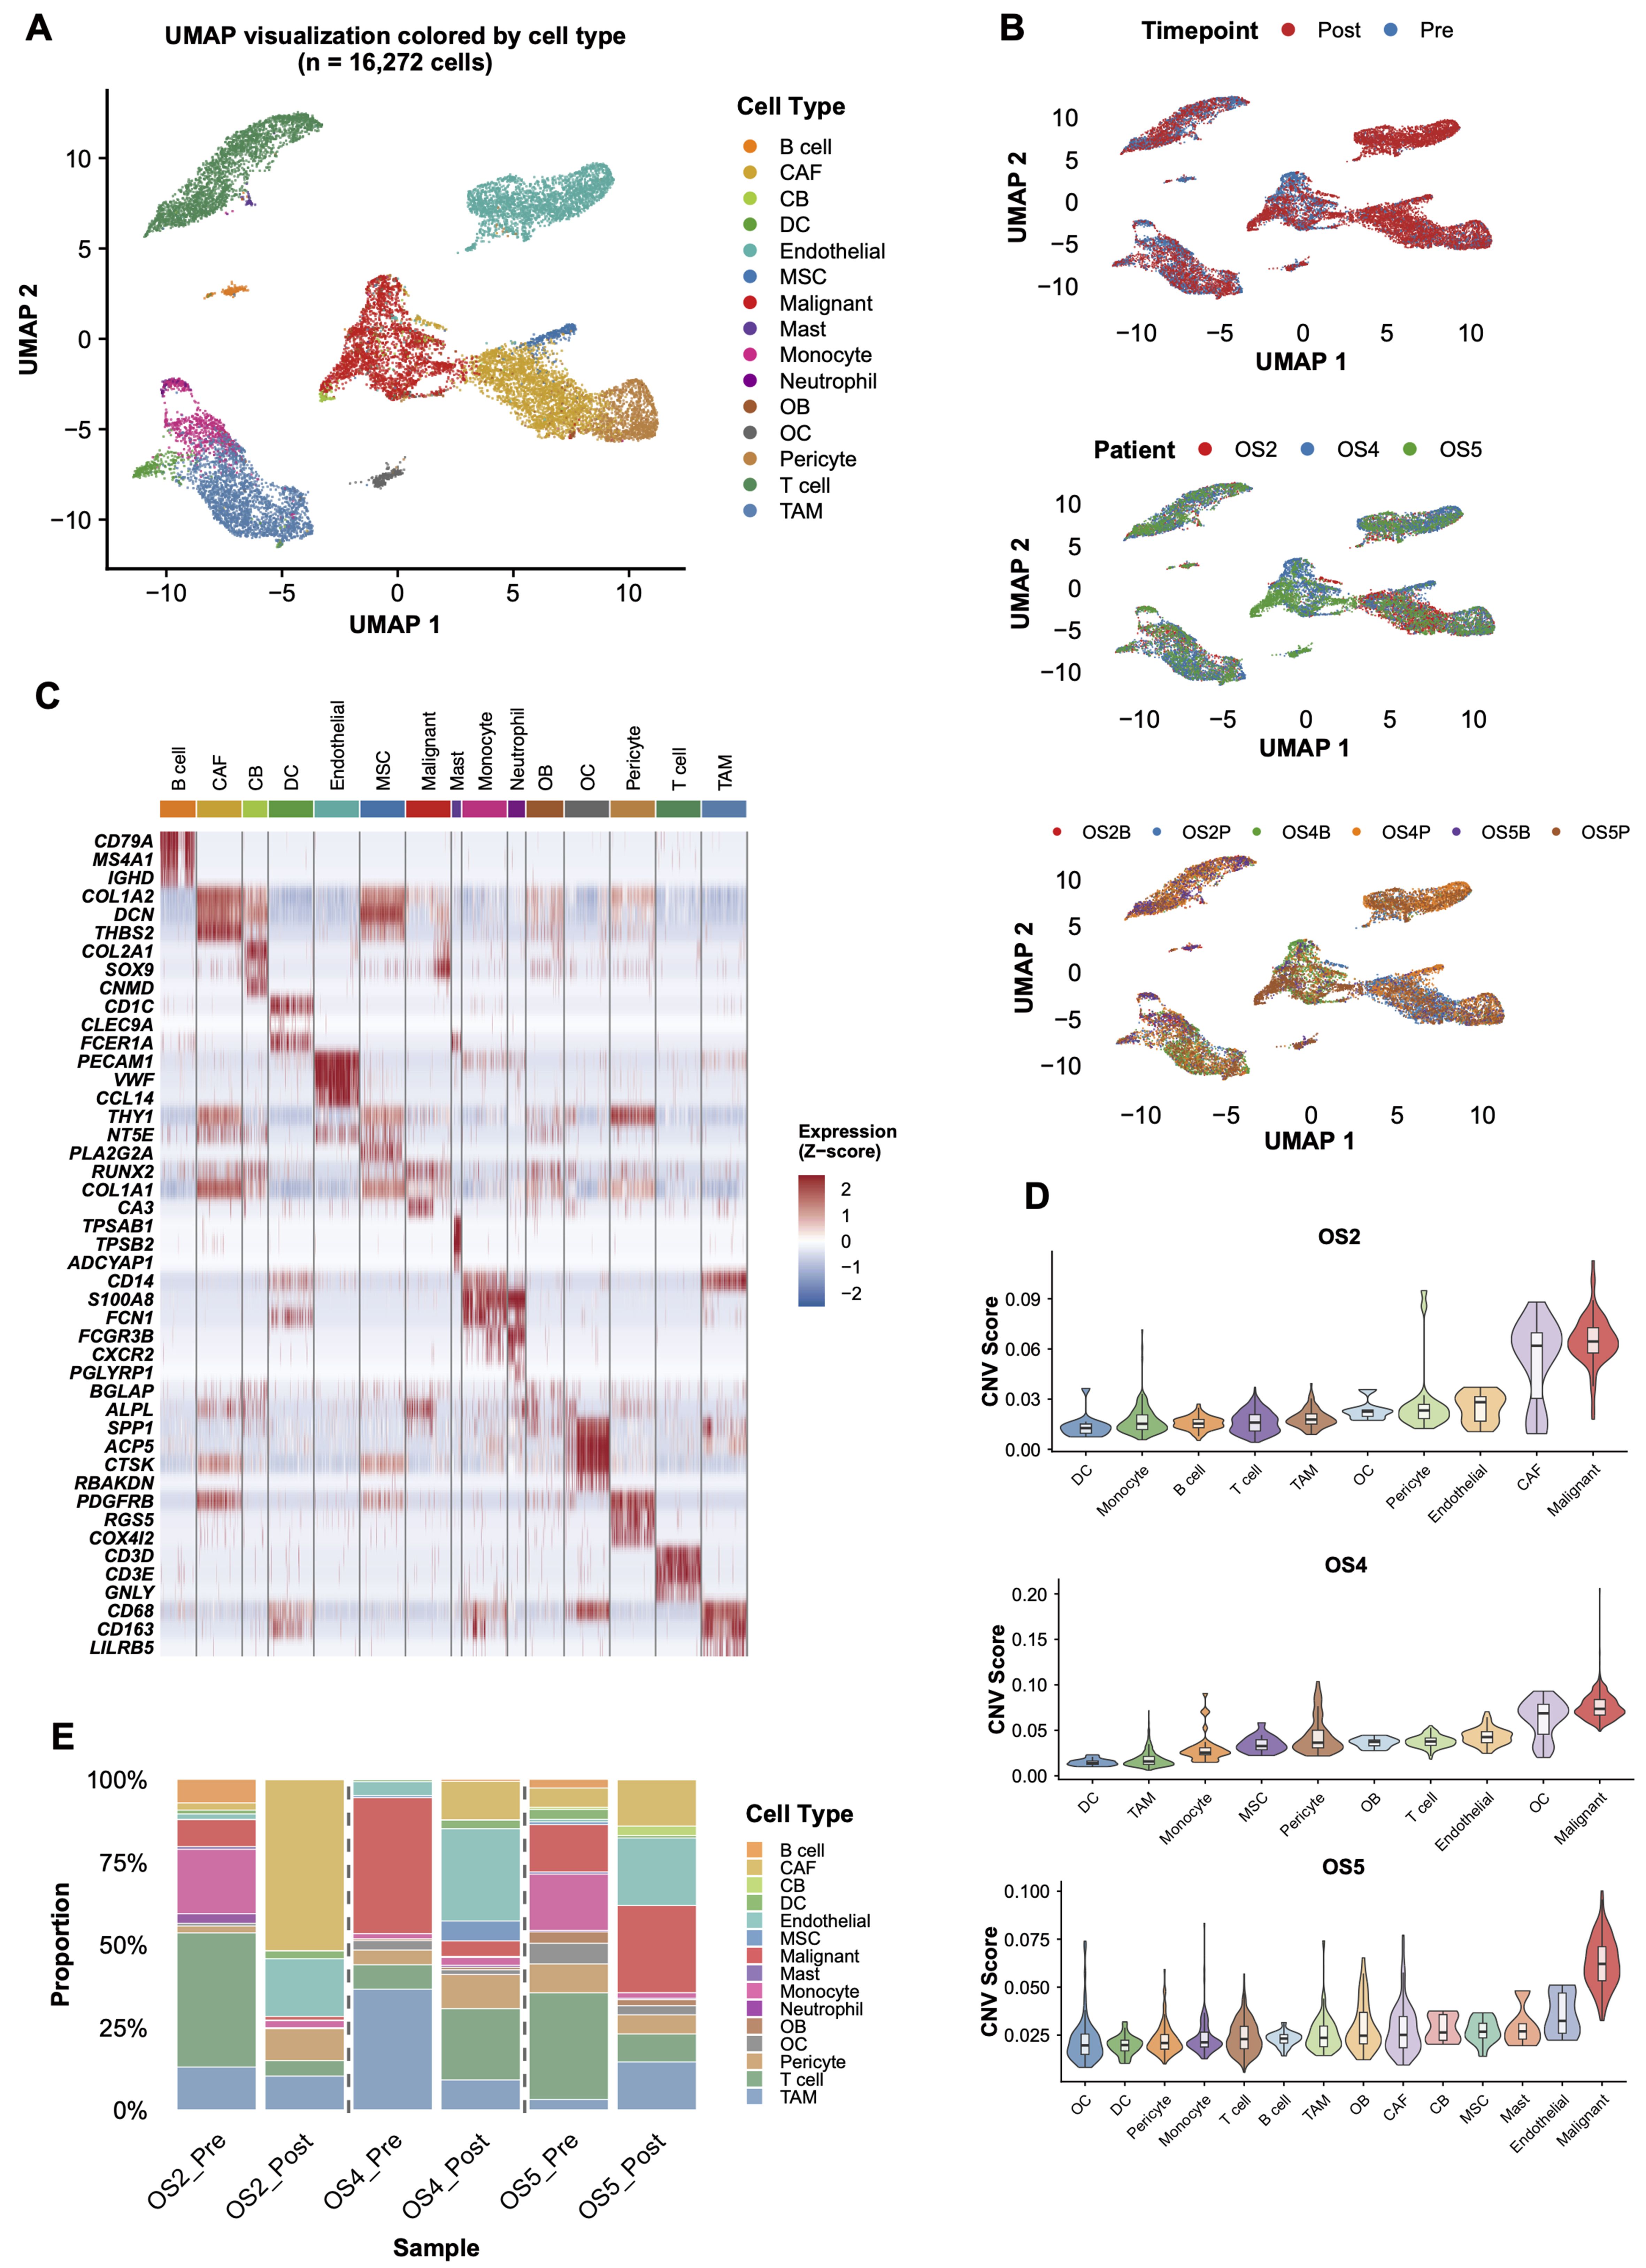
Figure 1. Single-cell transcriptomic atlas of osteosarcoma before and after NAC. (A) UMAP visualization of 16,272 cells from six samples (3 pre-NAC and 3 post-NAC) across three patients, colored by cell type. Fifteen distinct cell populations were identified through unsupervised clustering; (B) UMAP visualization colored by time point (pre-NAC, n = 3 samples; post-NAC, n = 3 samples), patient identity (OS2, OS4, OS5), and sample origin; (C) Heatmap showing the expression of canonical marker genes across the identified cell types; (D) InferCNV analysis distinguishing malignant cells (n = 2,942) from non-malignant populations based on inferred CNVs, using immune cells as diploid reference; (E) Stacked bar plot showing the proportions of each identified cell population in the six individual samples. NAC: Neoadjuvant chemotherapy; UMAP: uniform manifold approximation and projection; CNVs: copy number variations; CAF: cancer-associated fibroblast; CB: chondroblast; DC: dendritic cell; MSC: mesenchymal stem cells; OB: osteoblast; OC: osteoclast; TAM: tumor-associated macrophage.


