


fig5
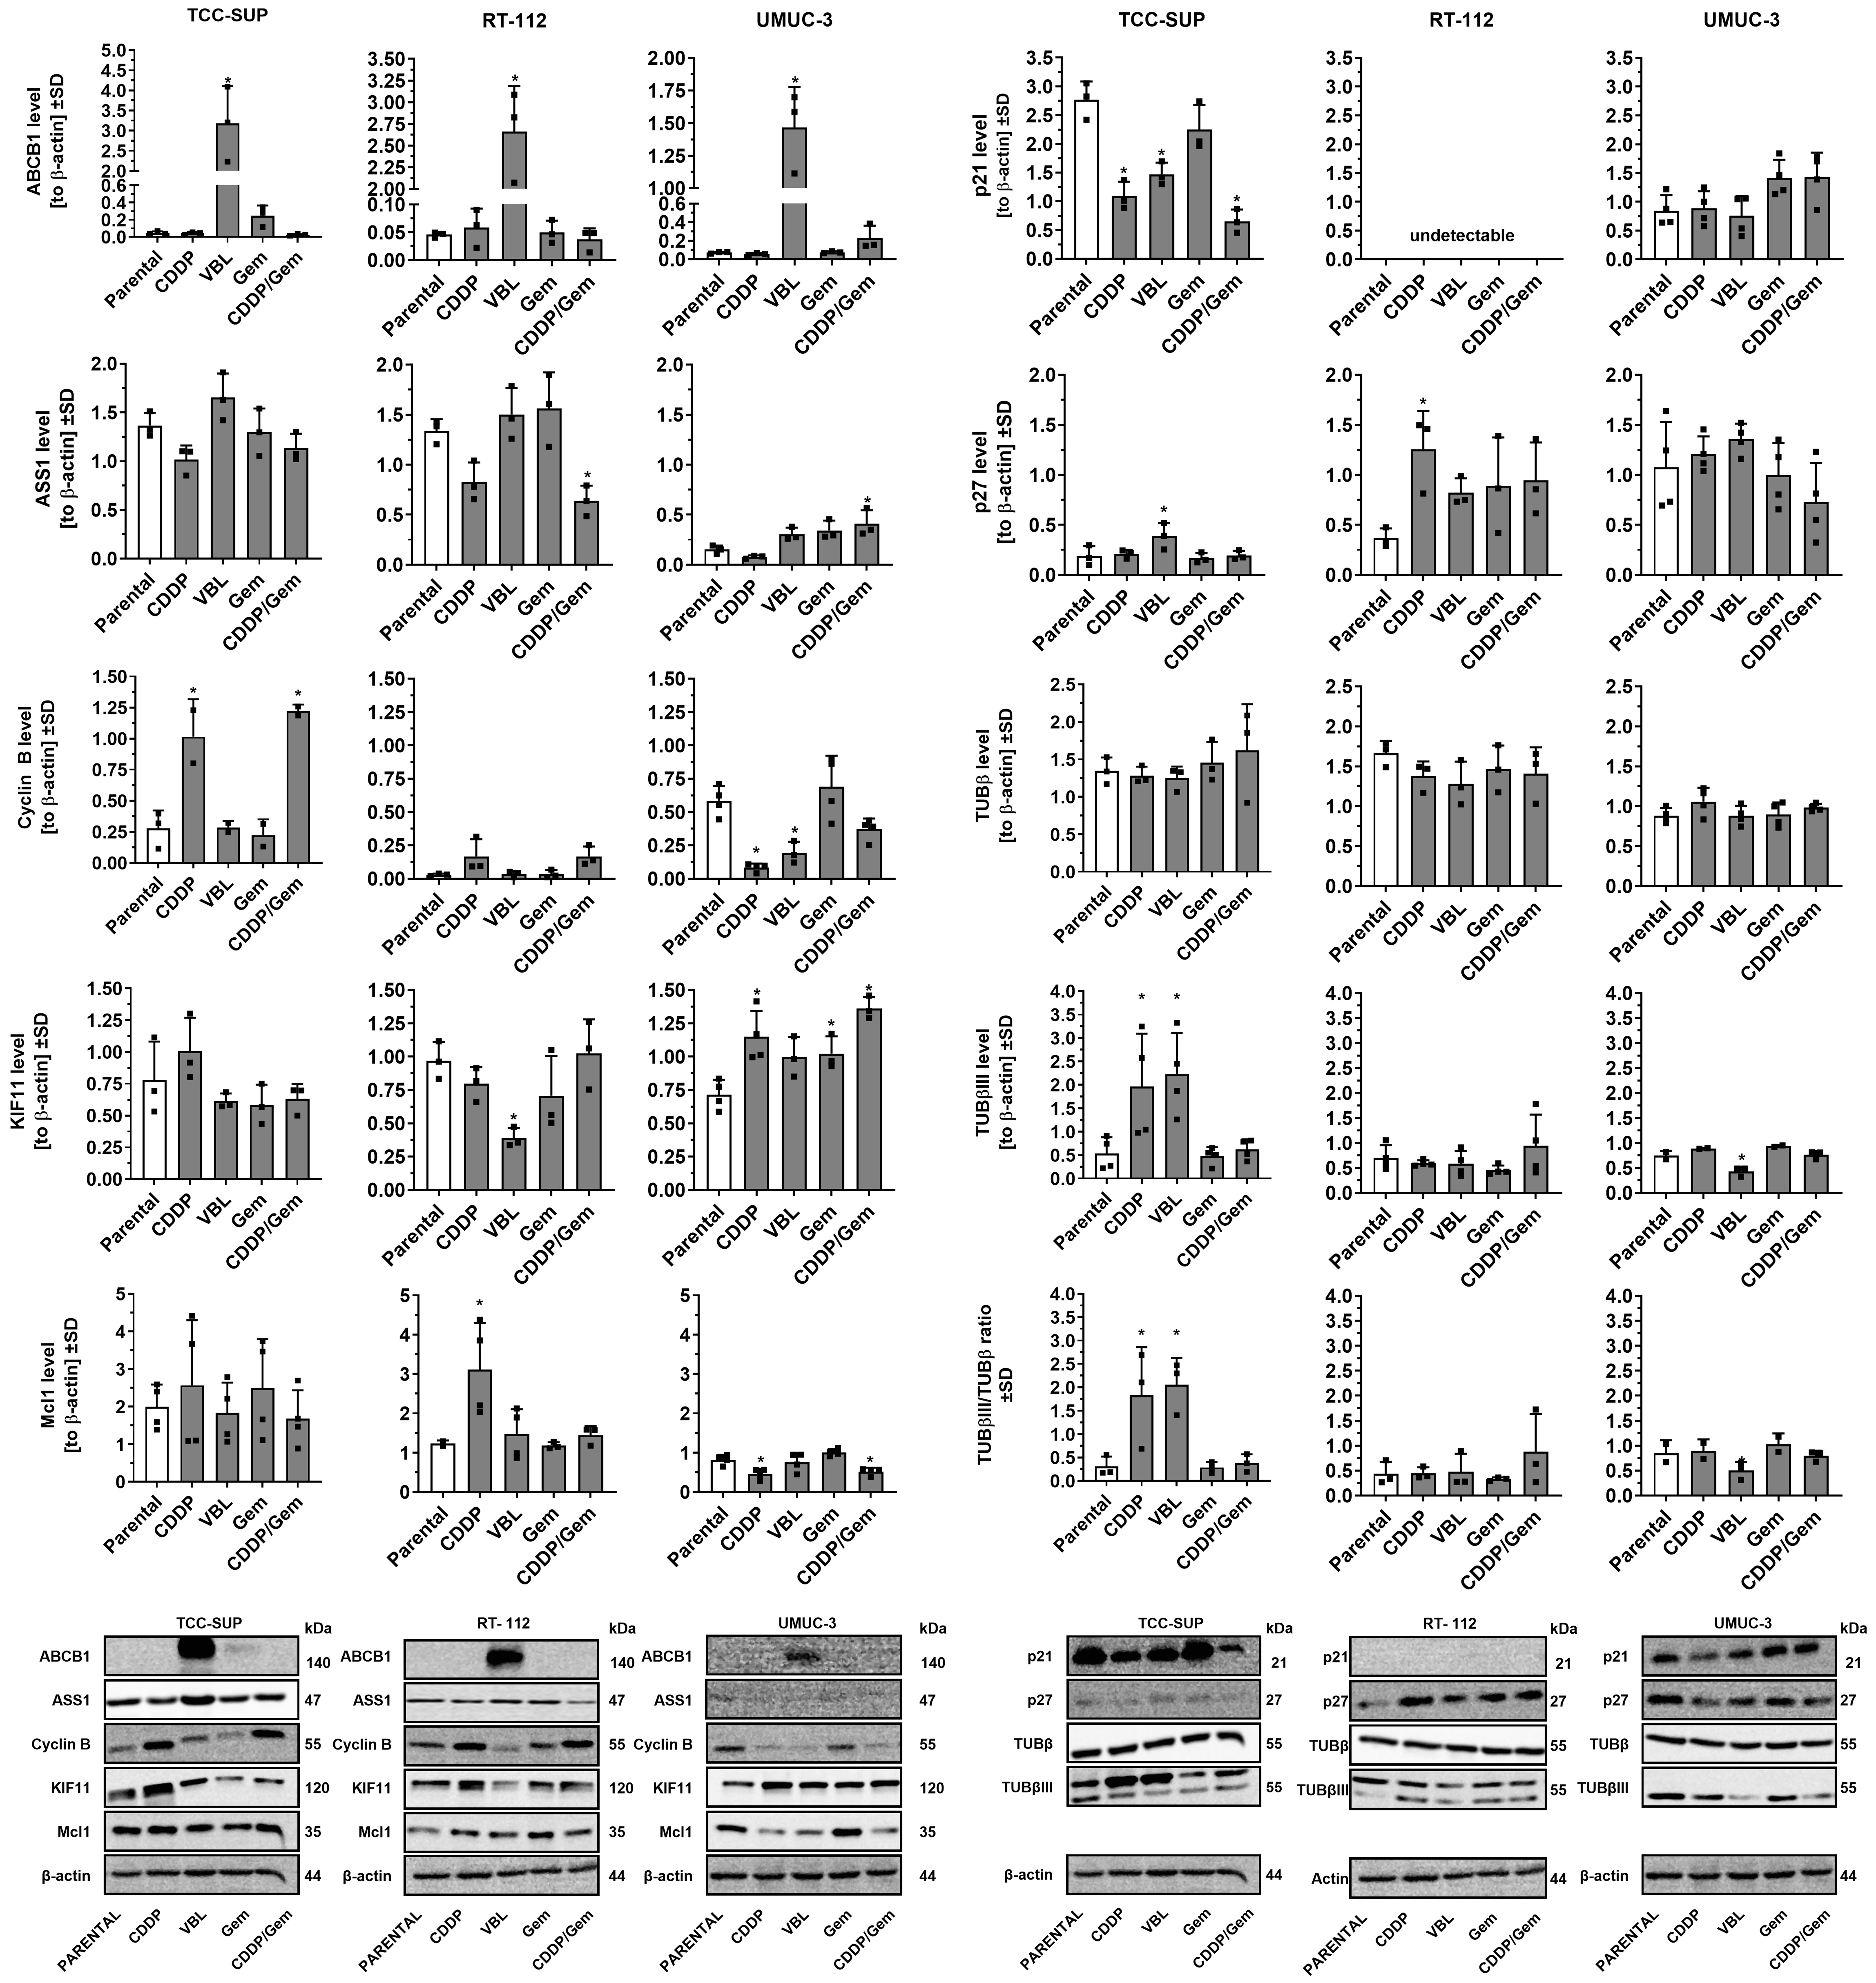
Figure 5. Comparison of selected protein levels in drug-resistant sublines versus parental cell lines. Densitometric values (n = 3-4) were normalized to β-actin and presented as mean ± SD, with ▪ symbols indicating raw values. *P < 0.05, one-way ANOVA with Dunnett’s post-hoc test compared to the corresponding parental cell line; und: undetectable. SD: Standard deviation; ANOVA: analysis of variance.


