


fig2
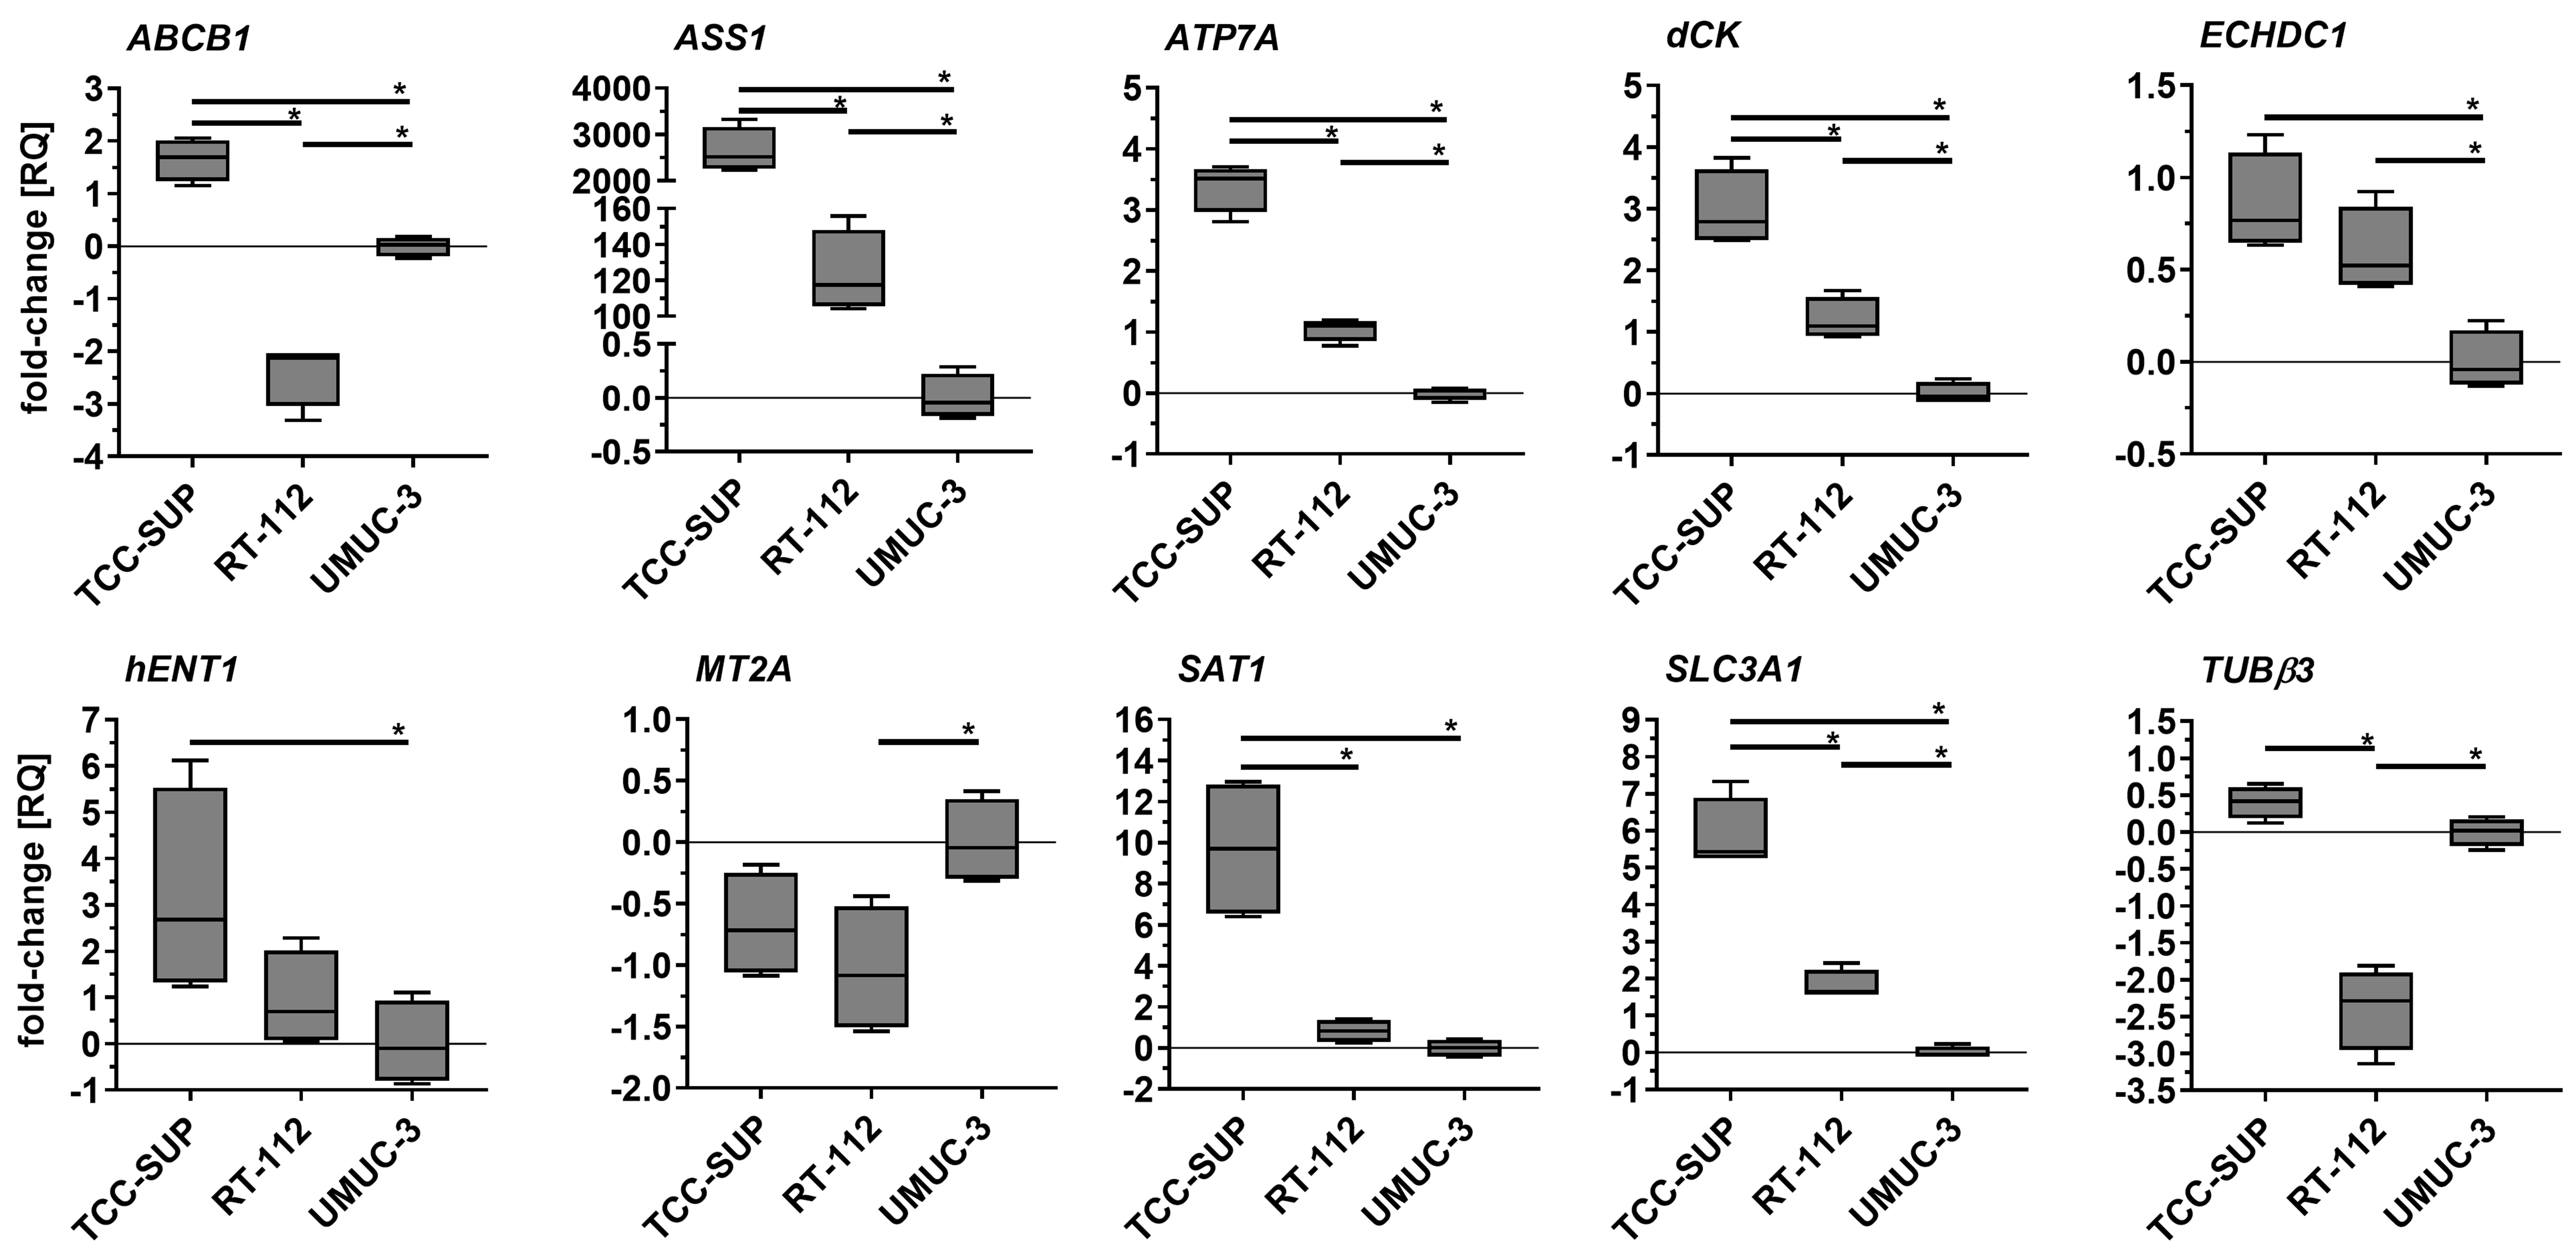
Figure 2. Comparison of selected gene expression in parental cell lines. Quantitative PCR results were normalized to GAPDH and expressed relative to the mean mRNA level of each gene in UMUC-3. Results (n = 4) are shown as box-and-whisker plots, with whiskers indicating minimum and maximum values. *P < 0.05, one-way ANOVA with Tukey’s post-hoc test. PCR: Polymerase chain reaction; ANOVA: analysis of variance.


