


fig5
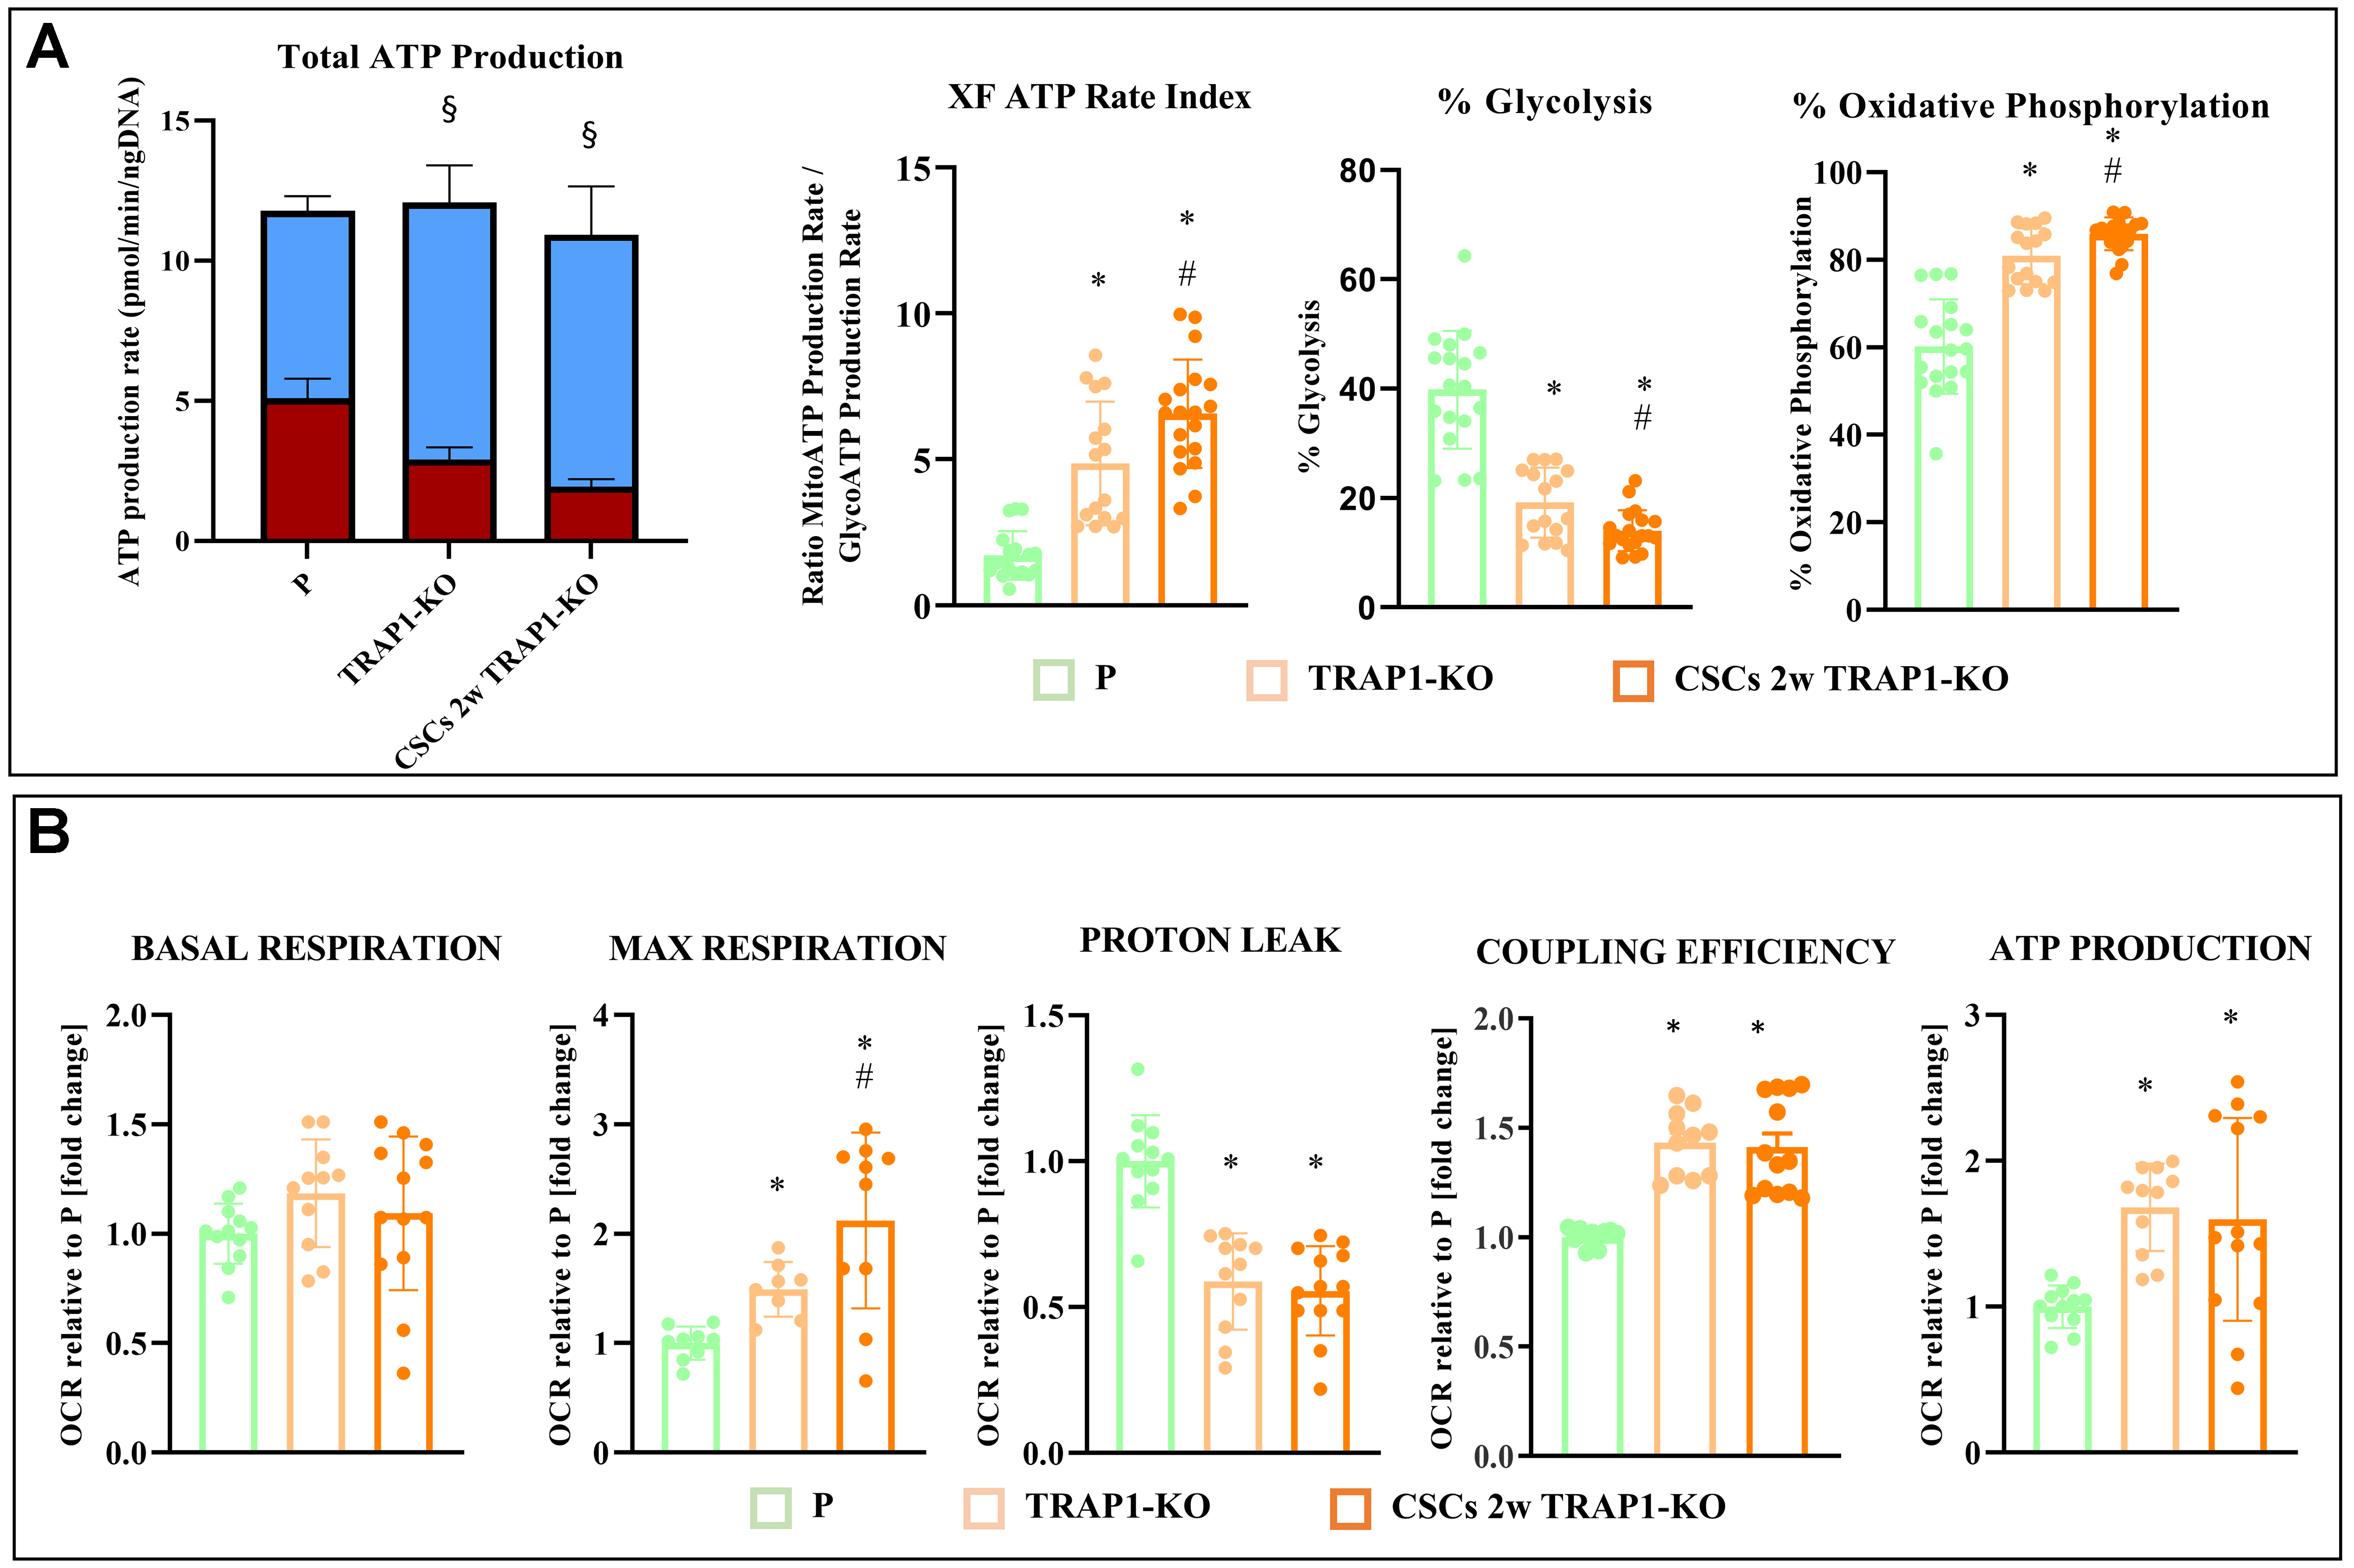
Figure 5. TRAP1 regulates metabolic pathway in Panc1 cells and derived CSCs. (A) Real-time ATP rate assay with Seahorse technology in P cells, CSCs 2w, TRAP1-KO cells, and CSCs 2w TRAP1-KO. ATP produced by glycolysis (GlycoATP) is shown in red, whereas ATP produced by OXPHOS (MitoATP) is in blue; (B) OCR with Seahorse technology in P cells, CSCs 2w, TRAP1-KO cells, and CSCs 2w TRAP1-KO. All values are reported as fold change relative to P cells and are the means (± SE) of at least three independent biological replicates. Statistical legend: *P < 0.05 indicated condition vs. P cells, #condition vs. TRAP1-KO, §GlycoATP vs. MitoATP in the same cellular condition. Statistical methods: one-way ANOVA. CSCs: Cancer stem cells; ATP: adenosine triphosphate; OXPHOS: oxidative phosphorylation; OCR: oxygen consumption rate; SE: standard error.


