


fig4
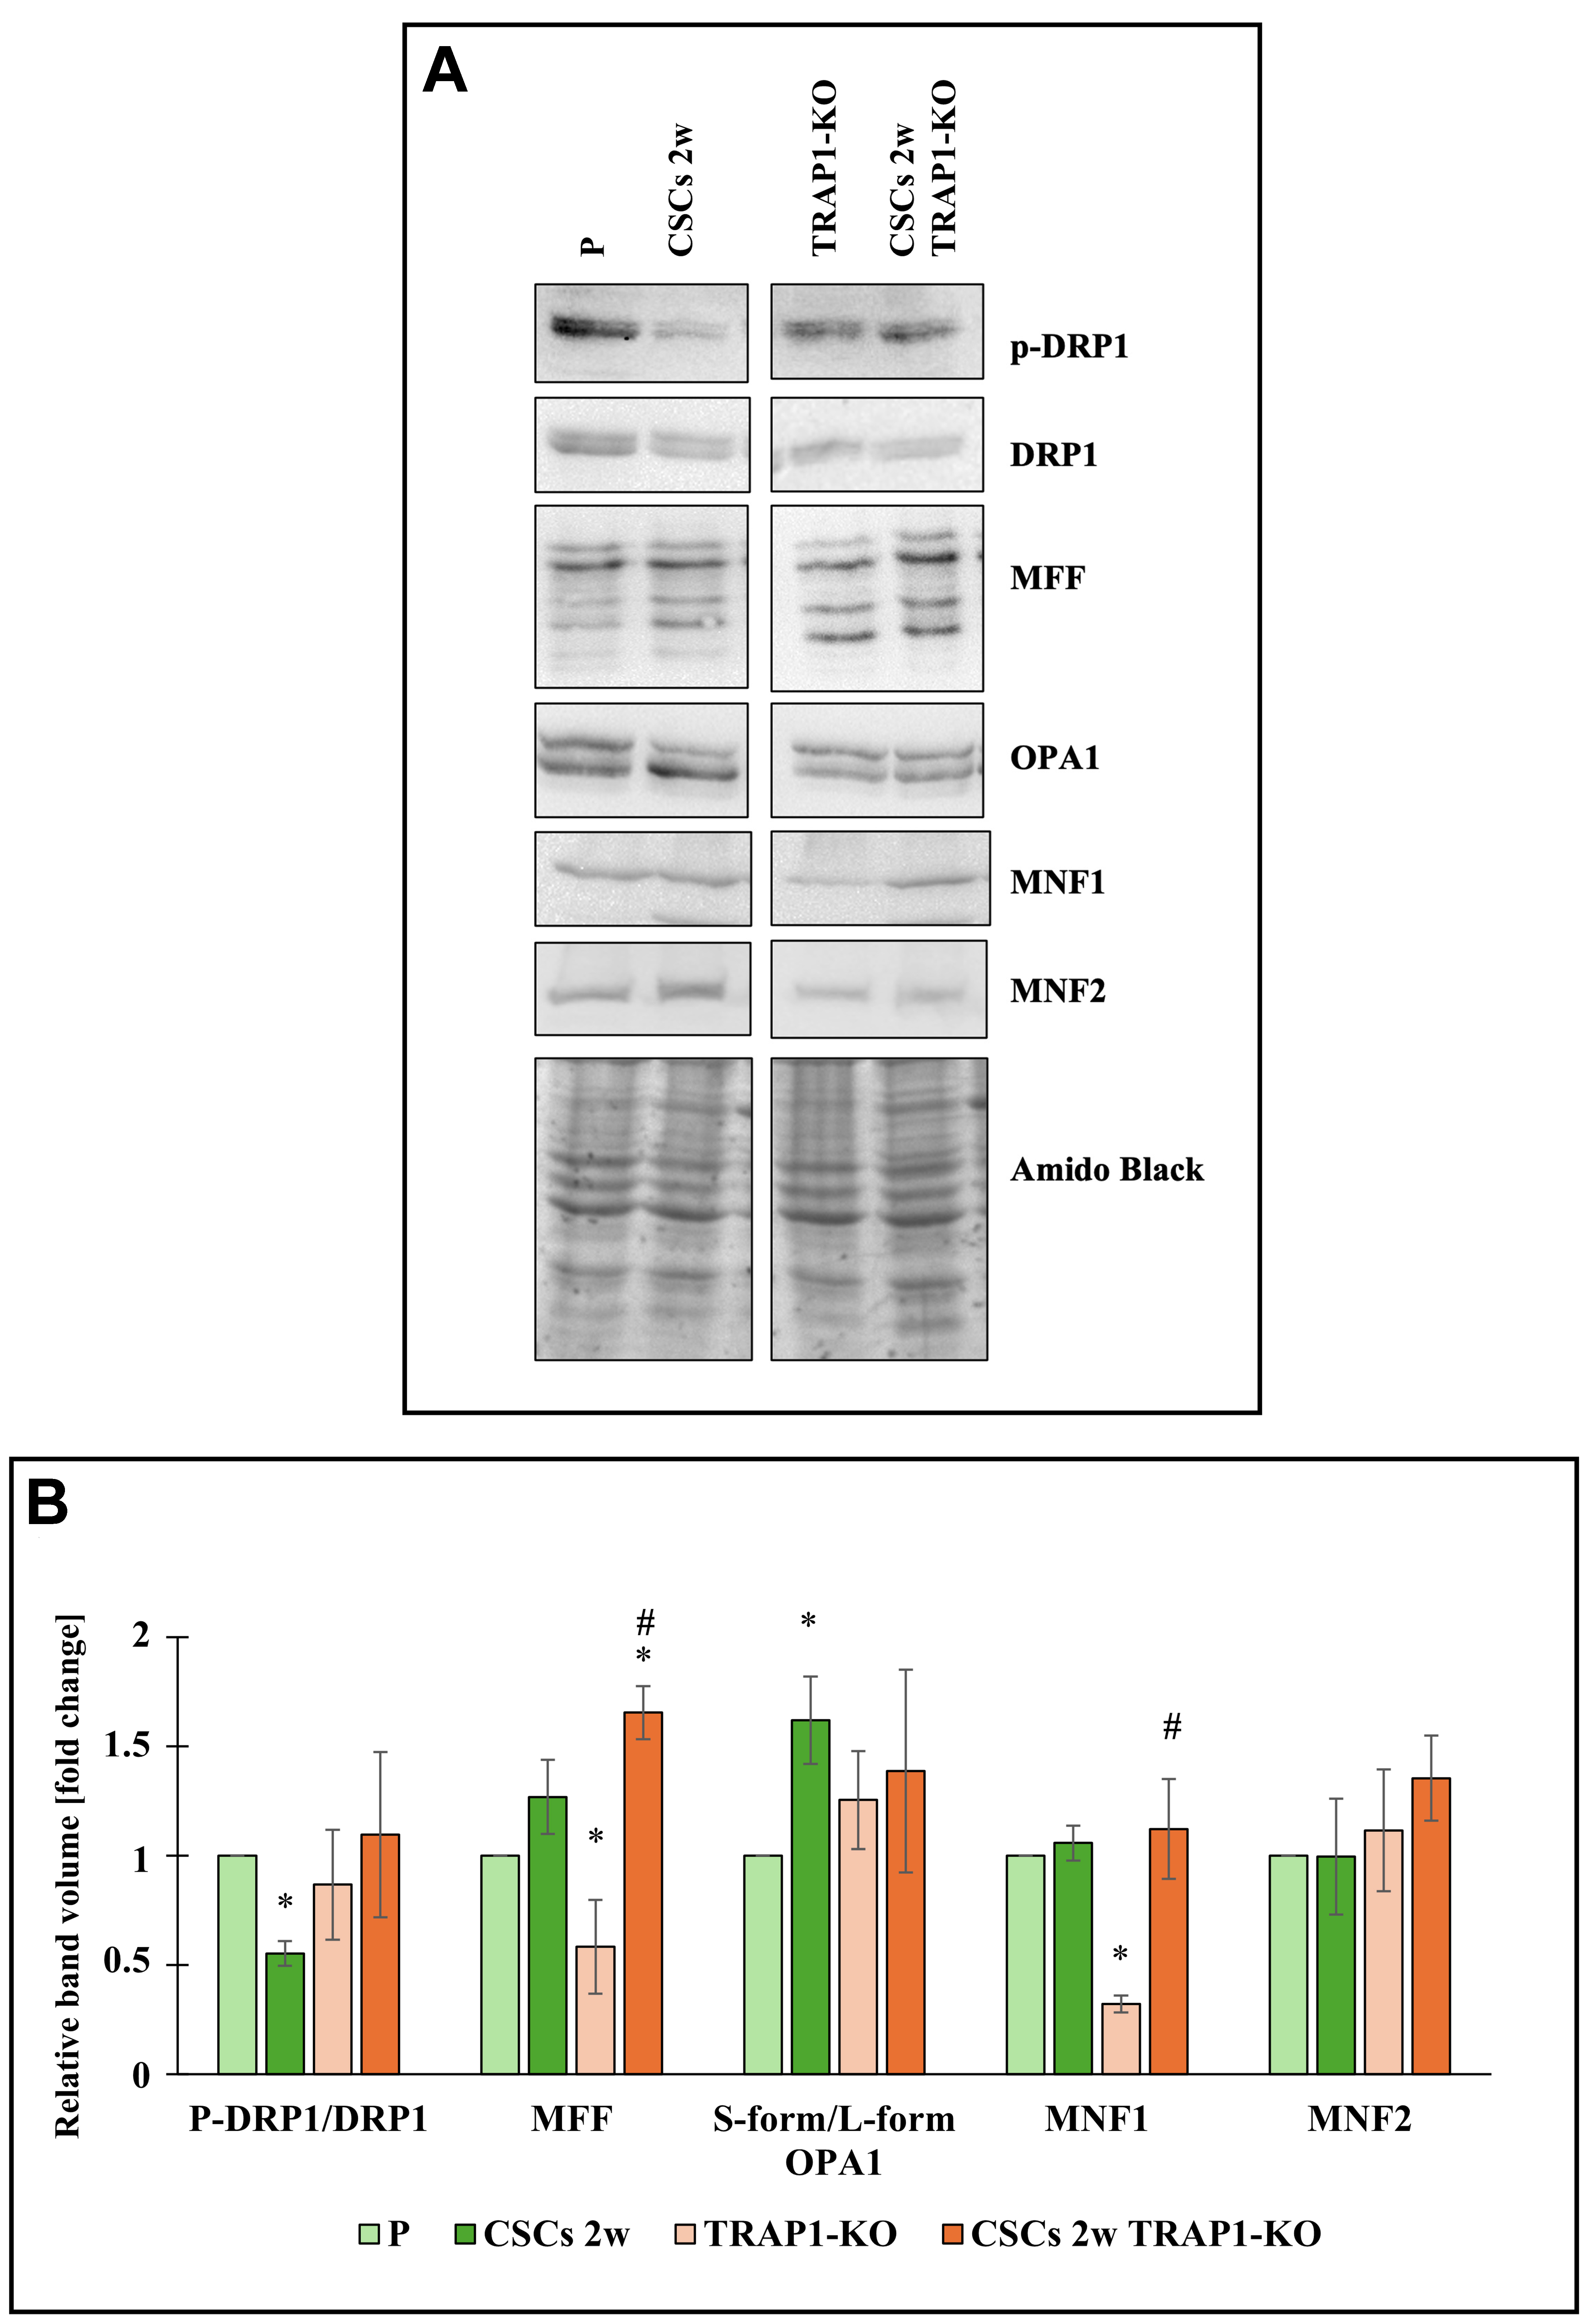
Figure 4. TRAP1 regulates mitochondrial dynamics proteins in Panc1 cells and derived CSCs. (A) Representative Western blot of expression of mitochondrial dynamics proteins (pDRP1, DRP1, MFF, OPA-1, MFN1, and MFN2) in P cells, CSCs 2w, TRAP1-KO cells, and CSCs 2w TRAP1-KO. Amido black is shown as the loading control; (B) The histogram represents the quantification of band volume reported as fold change relative to P cells. All values are reported as fold change relative to P cells and are the means (± SE) of at least three independent biological replicates. Statistical legend: *P < 0.05 indicated condition vs. P cells, #condition vs. TRAP1-KO. Statistical methods: two-tailed Student’s t-test. CSCs: Cancer stem cells; p-DRP1: phospho-dynamin-related protein 1; MFF: mitochondrial fission factor; OPA-1: optic atrophy 1; MFN1: mitofusin 1; MFN2: mitofusin 2; SE: standard error.


