


fig2
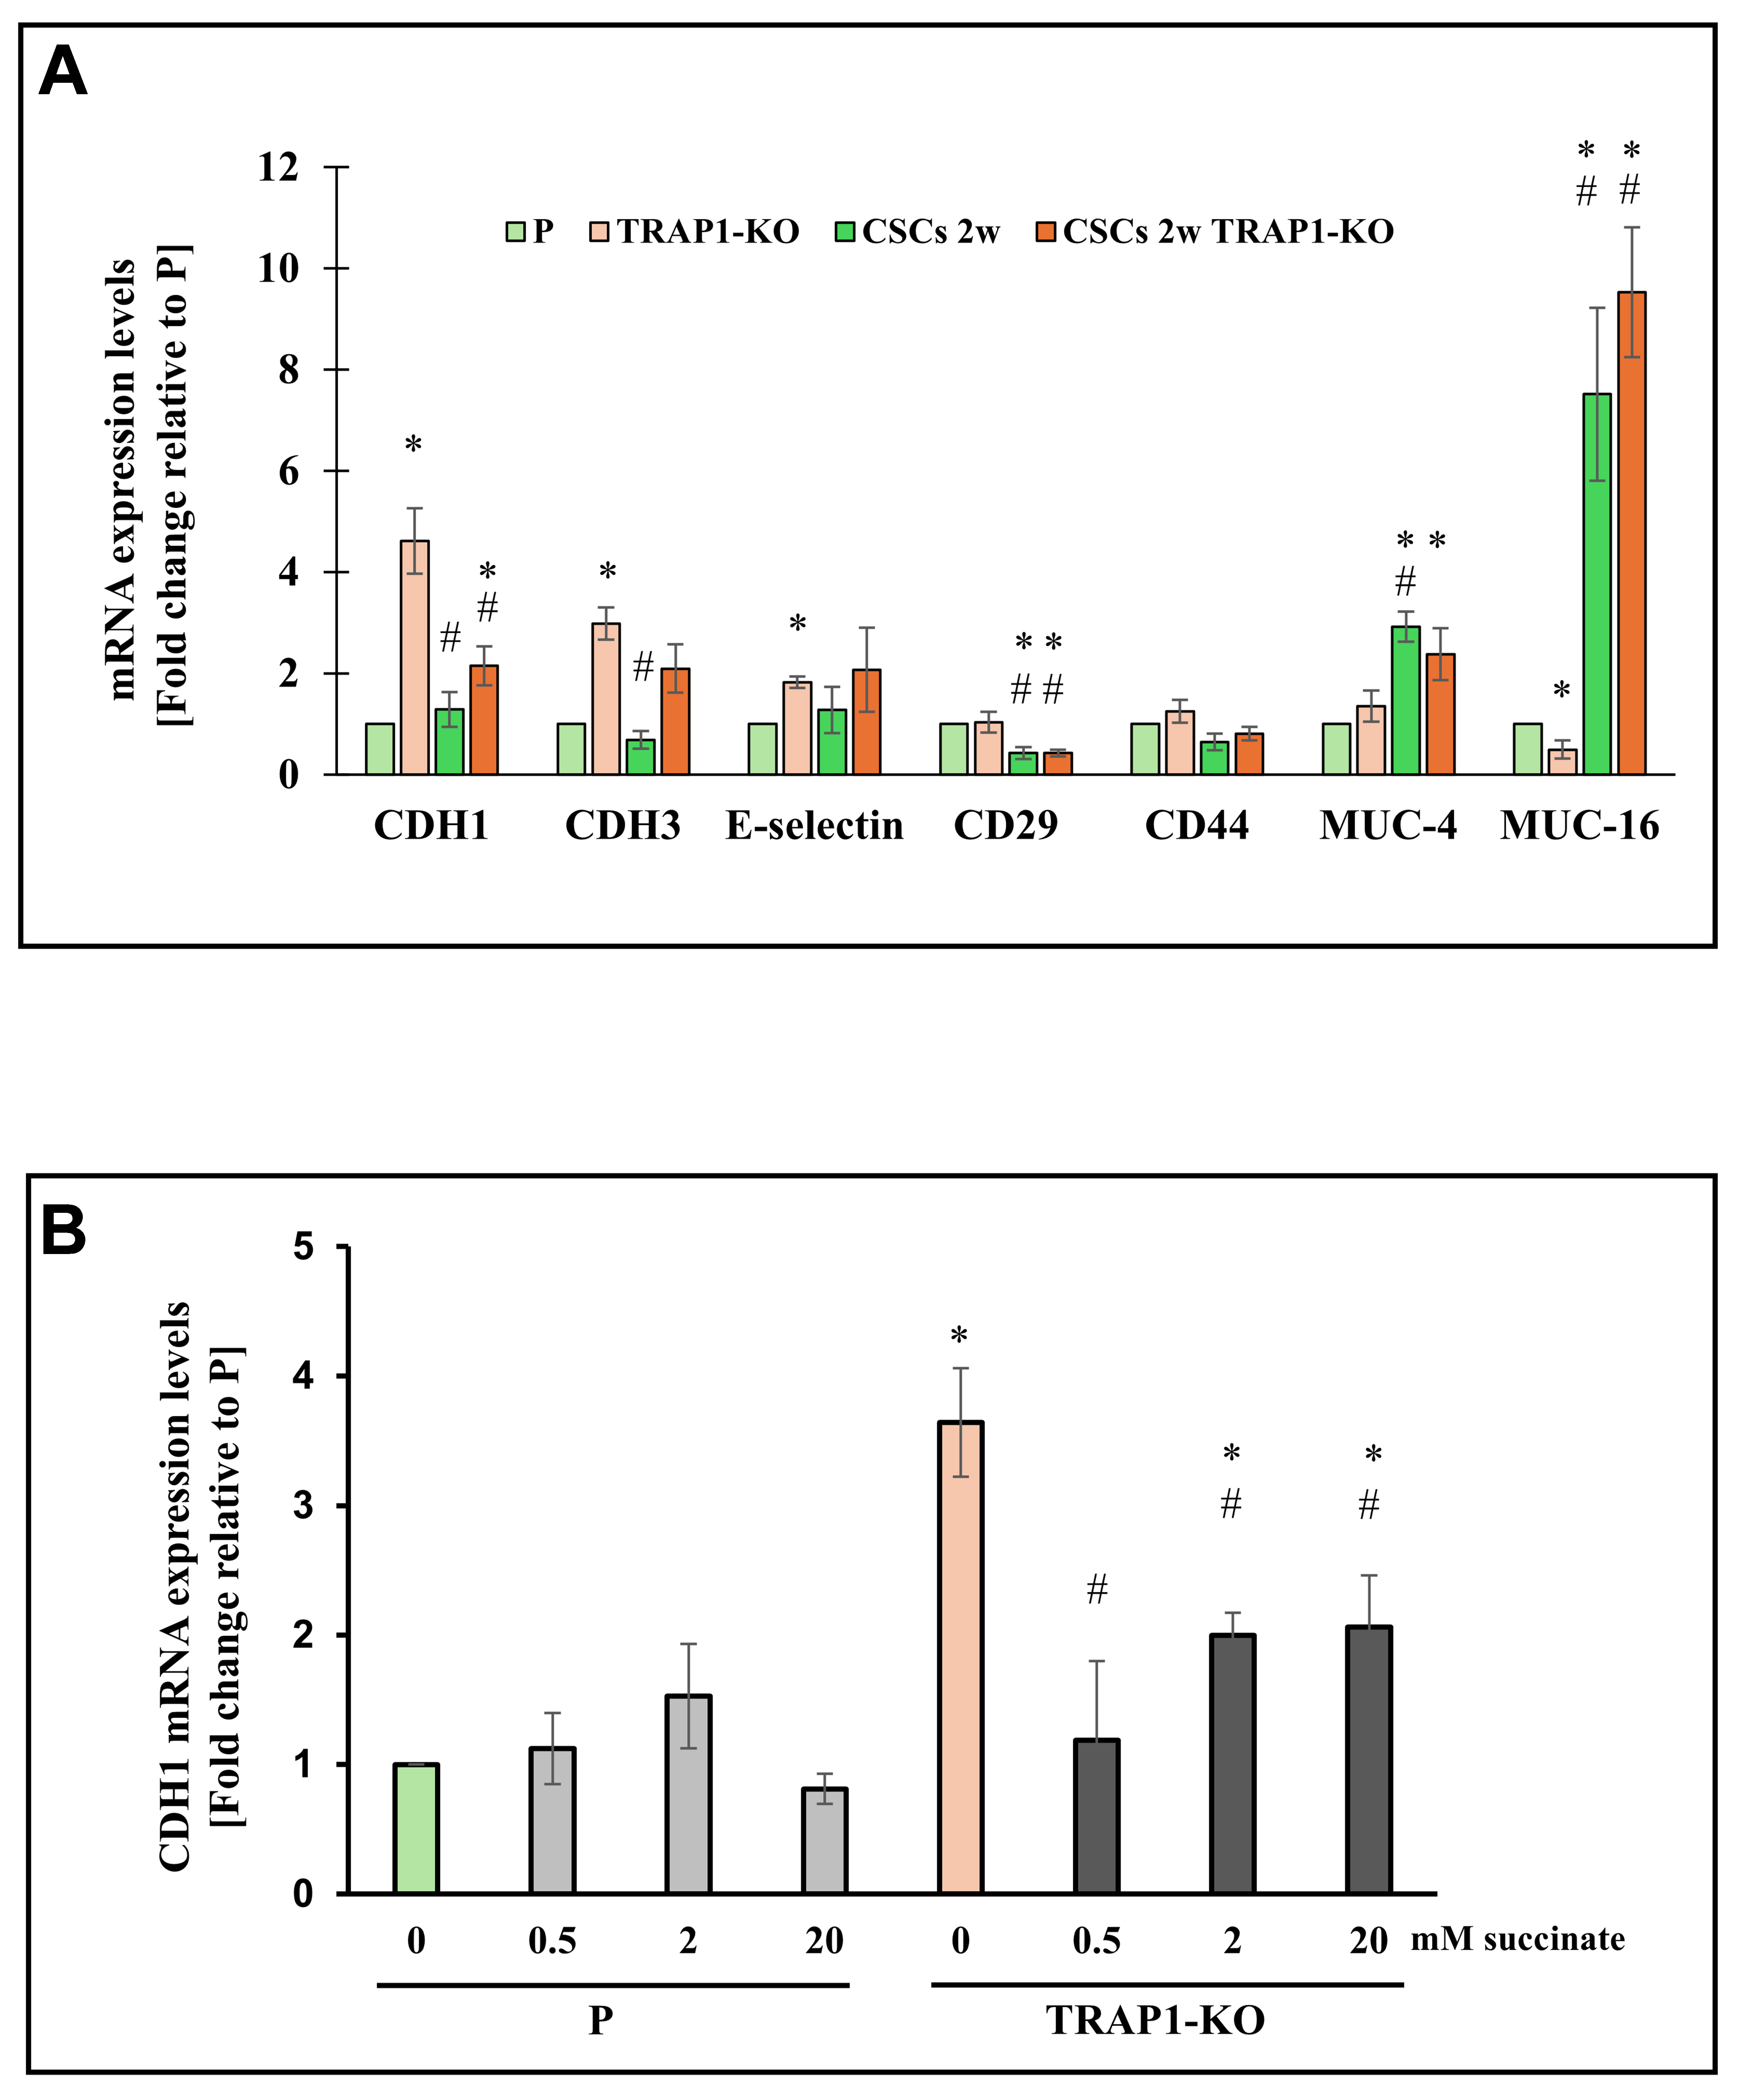
Figure 2. TRAP1 affects adhesion molecule expression in Panc1 cells and derived CSCs. (A) qPCR analysis of adhesion molecules (CDH1, CDH3, E-selectin, CD29, CD44, MUC-4 and MUC-16) in P cells, CSCs 2w, TRAP1-KO cells, and CSCs 2w TRAP1-KO; (B) qPCR analysis of CDH1 expression in P or TRAP1-KO cells treated with different doses of succinate for 48 h. All values are reported as fold change relative to P cells and are the means (± SE) of at least three independent biological replicates. Statistical legend: *P < 0.05 indicated condition vs. P cells, #condition vs. TRAP1-KO. Statistical methods: two-tailed Student’s t-test. CSCs: Cancer stem cells; qPCR: quantitative polymerase chain reaction; SE: standard error; mRNA: messenger RNA.


