


fig1
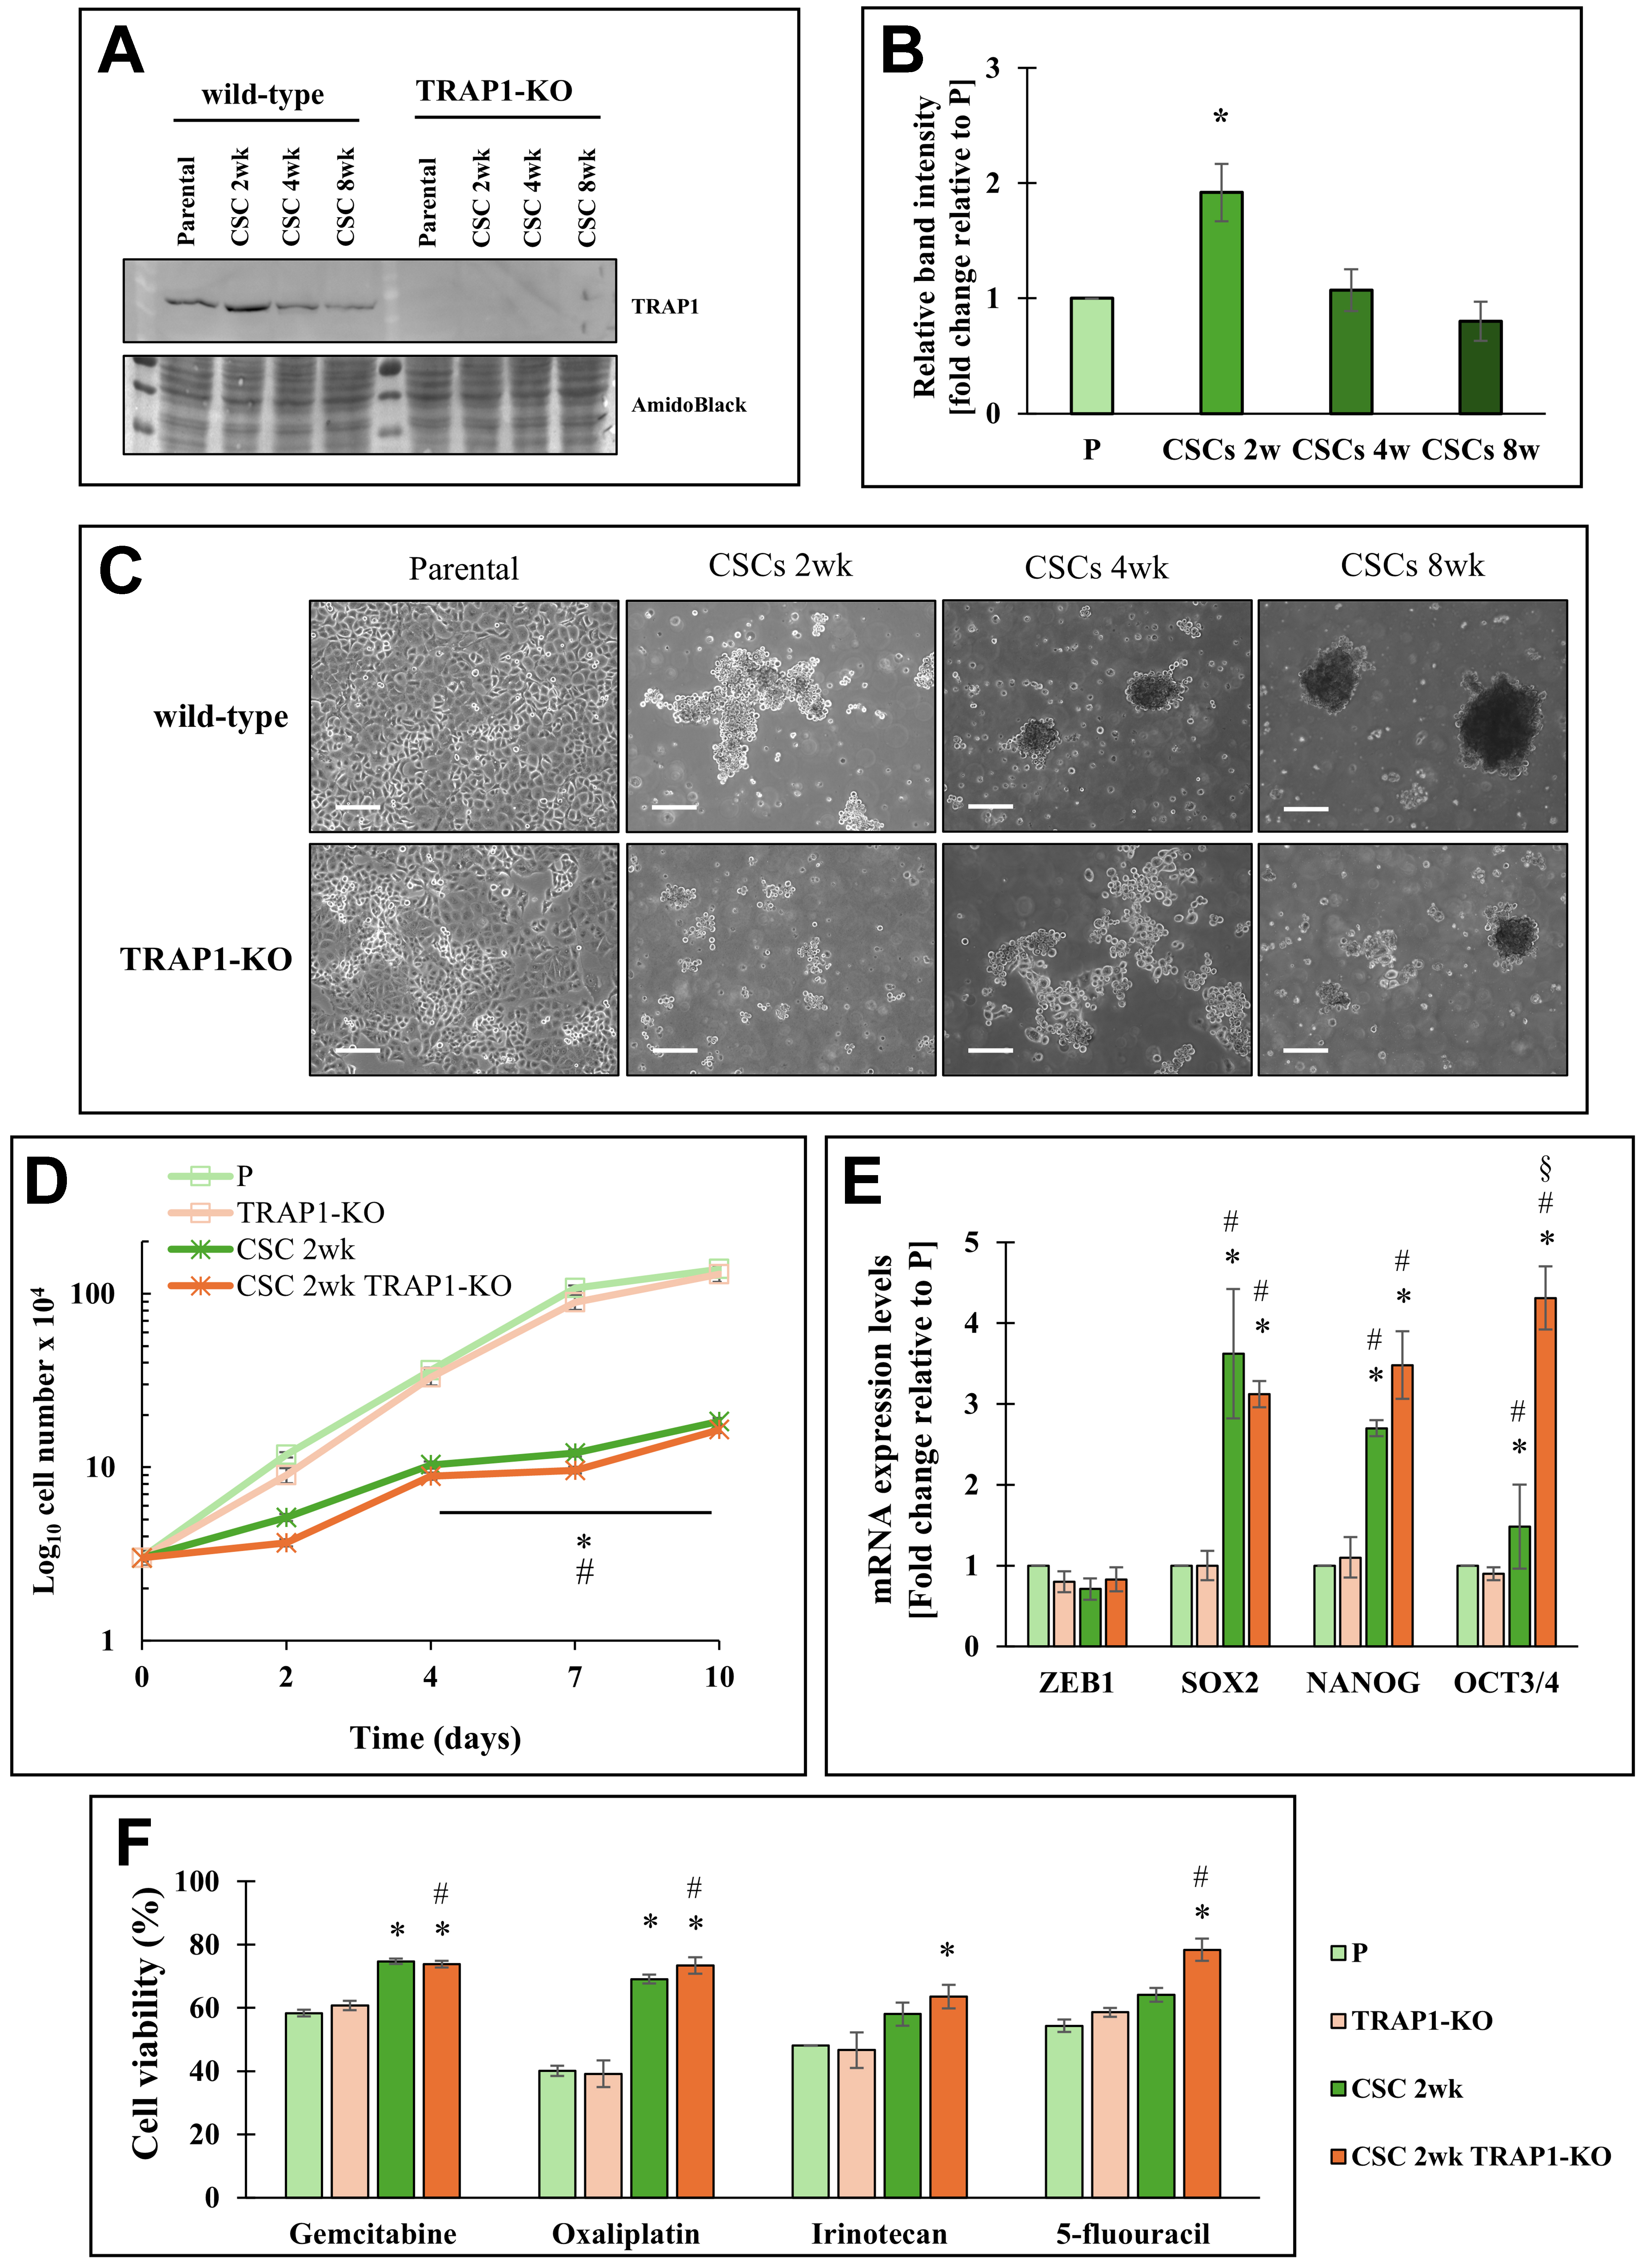
Figure 1. Effects of TRAP1 in Panc1 cells and derived CSCs. (A) Representative Western blot of TRAP1 expression in Panc1 parental cells (P), CSCs at different cell culture times (2, 4, 8 weeks) and TRAP1-Knock out (TRAP1-KO) cells and the derived CSCs. Amido black is shown as the loading control; (B) The histogram represents the average of band intensity quantification of three independent biological replicates and is reported as fold change relative to P cells; (C) Bright field representative images of Panc1 parental cells, CSCs at different cell culture times (2, 4, 8 weeks) and TRAP1-KO cells and the derived CSCs. All the pictures were taken with 5× magnification. Scale bar: 50 μm; (D) Proliferation rate of P cells, CSCs 2w, TRAP1-KO cells, and CSCs 2w TRAP1-KO, in which 3 × 10⁴ cells/well were plated for each condition at time 0 and counted after the indicated days; (E) qPCR analysis of stemness genes (ZEB1, SOX2, NANOG, OCT3/4) in P cells, CSCs 2w, TRAP1-KO cells, and CSCs 2w TRAP1-KO; (F) Cell viability analysis of P cells, CSCs 2w, TRAP1-KO cells, and CSCs 2w TRAP1-KO treated with 50 μM gemcitabine or 100 μM Oxaliplatin or 200 μM Irinotecan or 1 mM 5-fluorouracil for 48 h. The values are reported as fold change relative to P cells. All values are the means (± SE) of at least three independent biological replicates. Statistical legend: *P < 0.05 indicated condition vs. P cells, #condition vs. TRAP1-KO, §condition vs. CSCs 2w. Statistical methods: two-tailed Student’s t test. CSCs: Cancer stem cells; qPCR: quantitative polymerase chain reaction; SE: standard error.


