


fig5
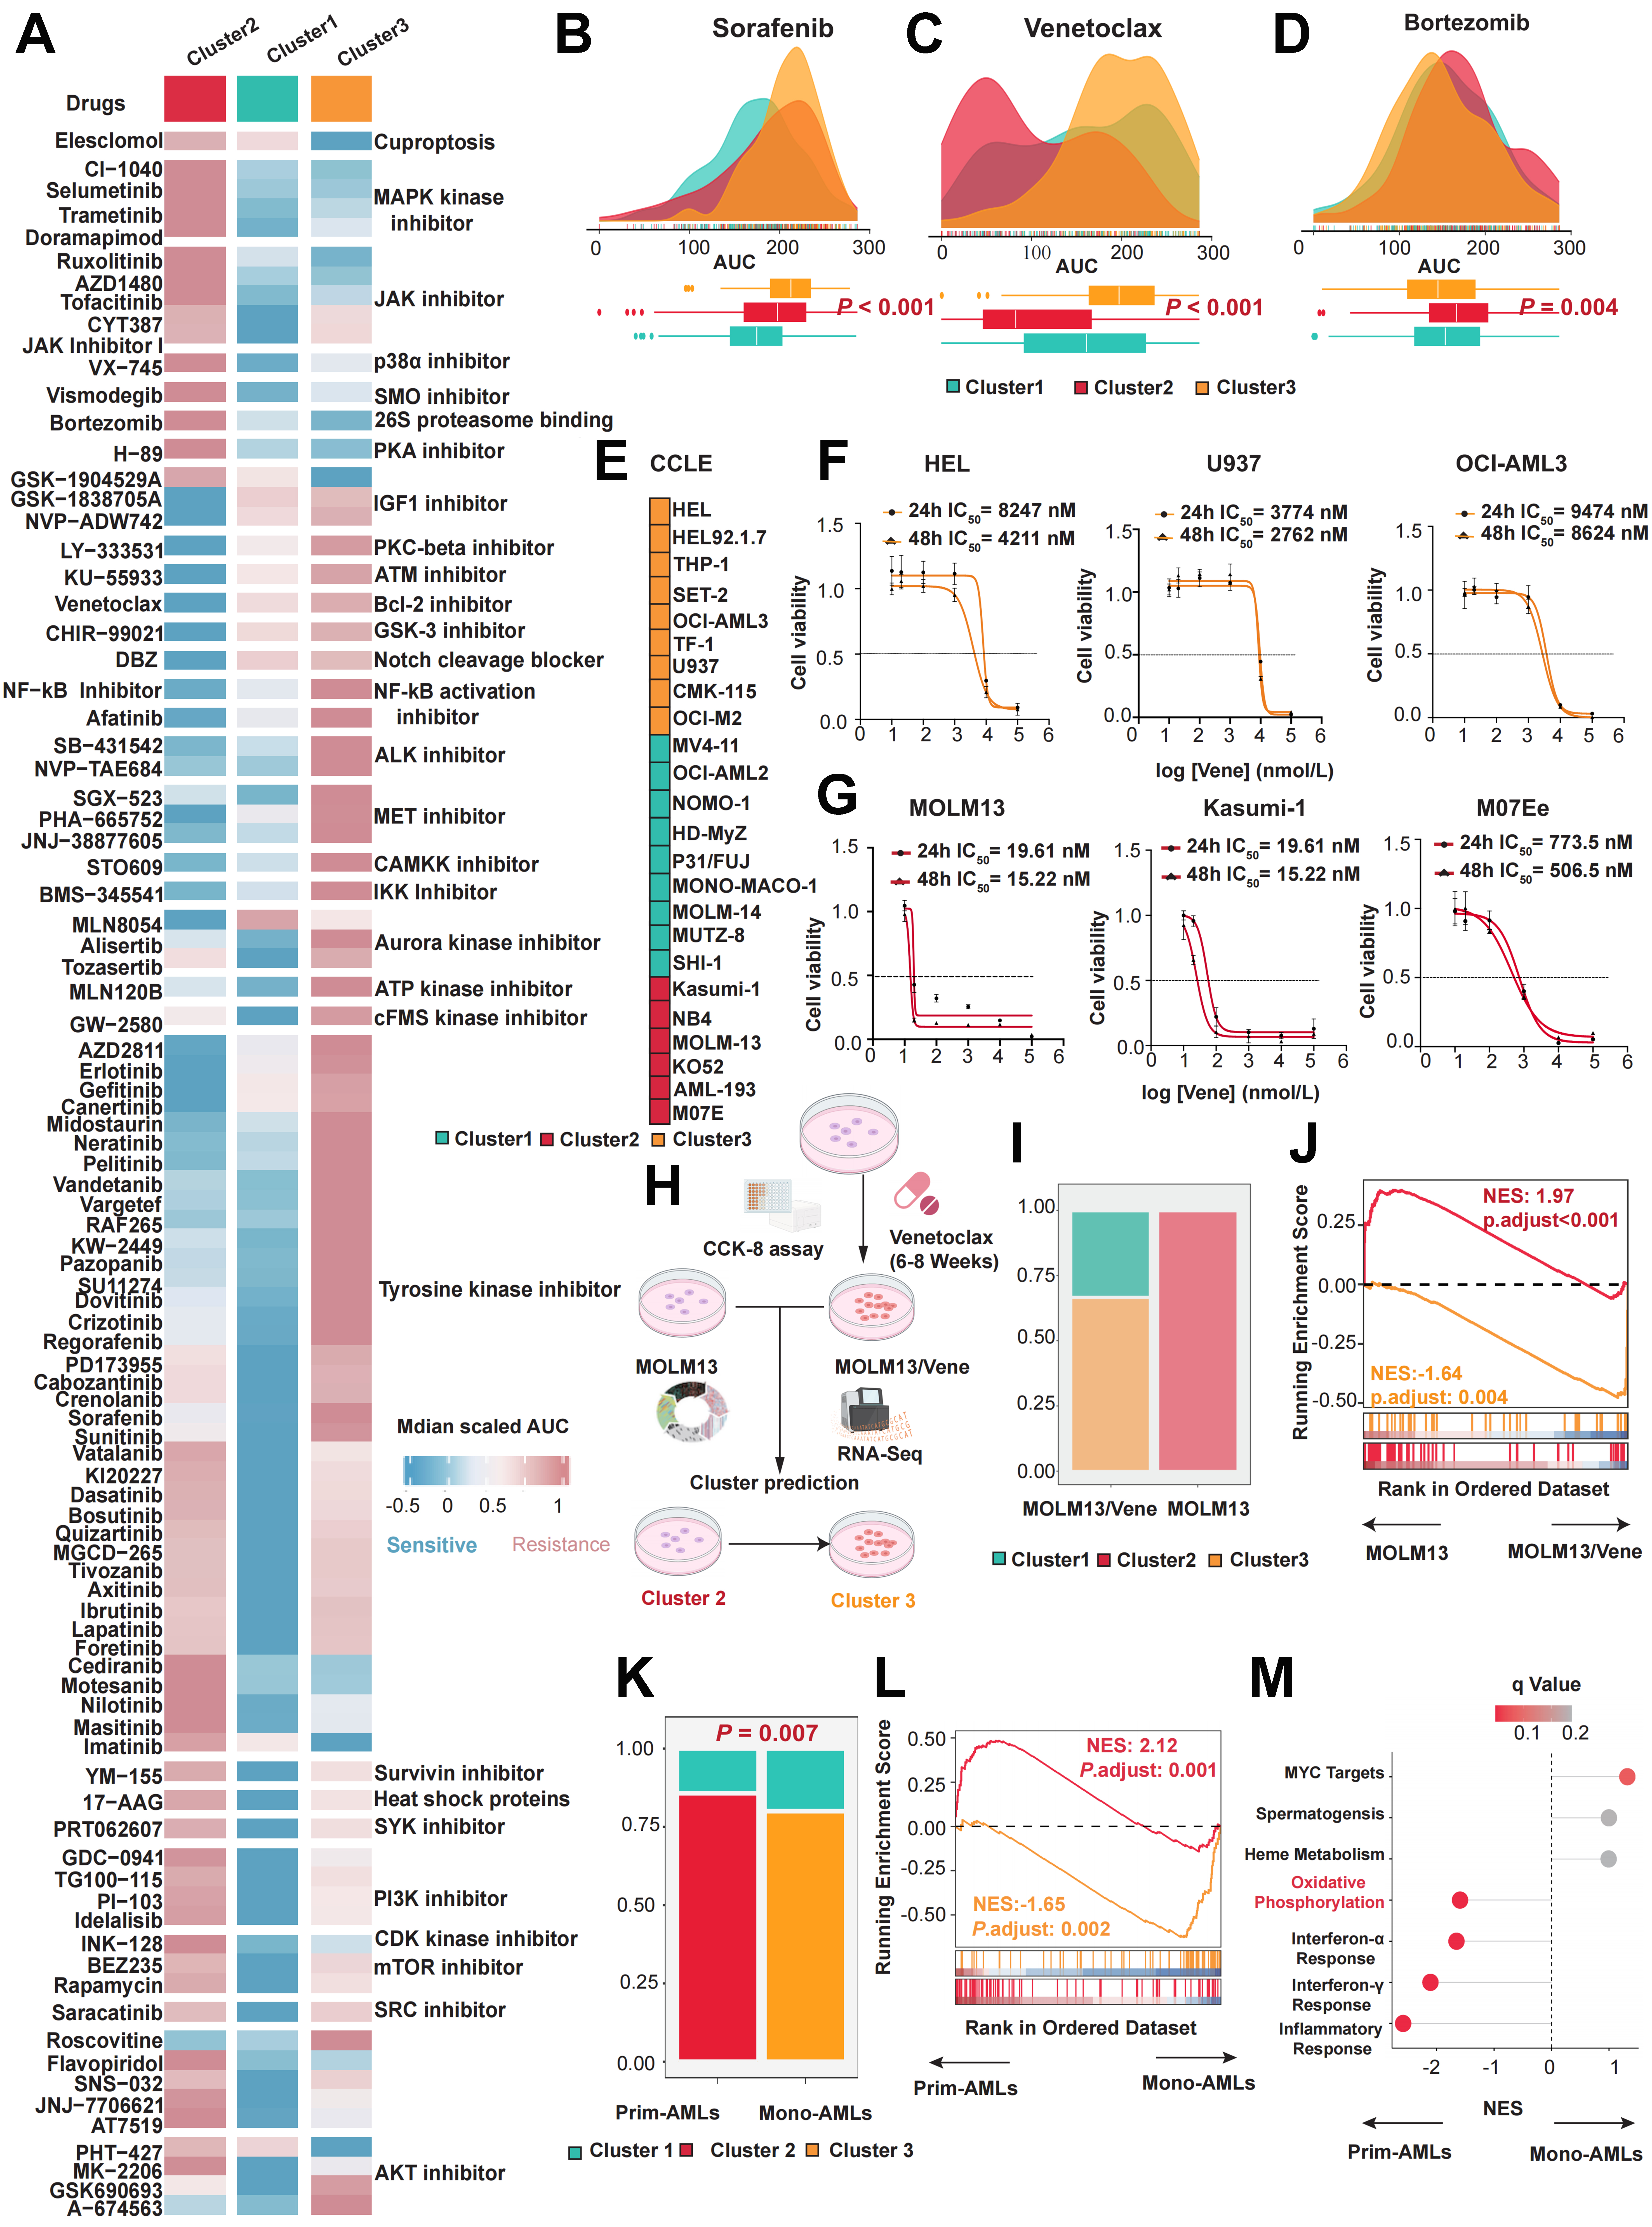
Figure 5. Identification of suitable small molecule treatments for the three clusters. (A) Heatmap showing the median AUC values of drug responses in the three subtypes within the BEAT AML cohort; (B-D) Mountain plots illustrating AUC values for Sorafenib (P < 0.001), Venetoclax (P < 0.001), and Bortezomib (P = 0.004) in the three clusters; (E) Heatmap displaying the distribution of different AML cell lines in the three clusters from the CCLE database; (F) IC50 curves of Venetoclax in Cluster 3 AML cell lines (HEL, U937, OCI-AML3) after 24/48 h of treatment; (G) IC50 curves of Venetoclax in Cluster 2 AML cell lines (MOLM13, Kasumi-1, M07e) after 24/48 h of treatment; (H) Flowchart for construction and classification prediction of Venetoclax-resistant AML cell lines; (I) Bar chart describing the proportion of clusters in the MOLM13 or MOLM13/Vene; (J) GSEA of DEGs between MOLM13 and MOLM13/Vene in the gene signatures from upregulated genes of Cluster 2 and Cluster 3; (K) The bar chart describes the proportion of clusters in the primary AML cells in the GSE132511 cohort; (L) GSEA of DEGs between mono-AML and prim-AML in the gene signatures from upregulated genes of Cluster 2 and Cluster 3; (M) GSEA of DEGs between mono-AML and prim-AML in the gene signatures from hallmark pathways. Differences among three or more groups were assessed with the Kruskal-Wallis test, categorical variables were analyzed using the chi-square test or Fisher’s exact test. AUC: Area under the curve; AML: acute myeloid leukemia; CCLE: Cancer Cell Line Encyclopedia; IC50: half-maximal inhibitory concentration; GSEA: gene set enrichment analysis; DEGs: differentially expressed genes; CCK-8: Cell Counting Kit-8; RNA-Seq: RNA sequencing; NES: normalized enrichment score; MYC: MYC proto-oncogene.


