


fig1
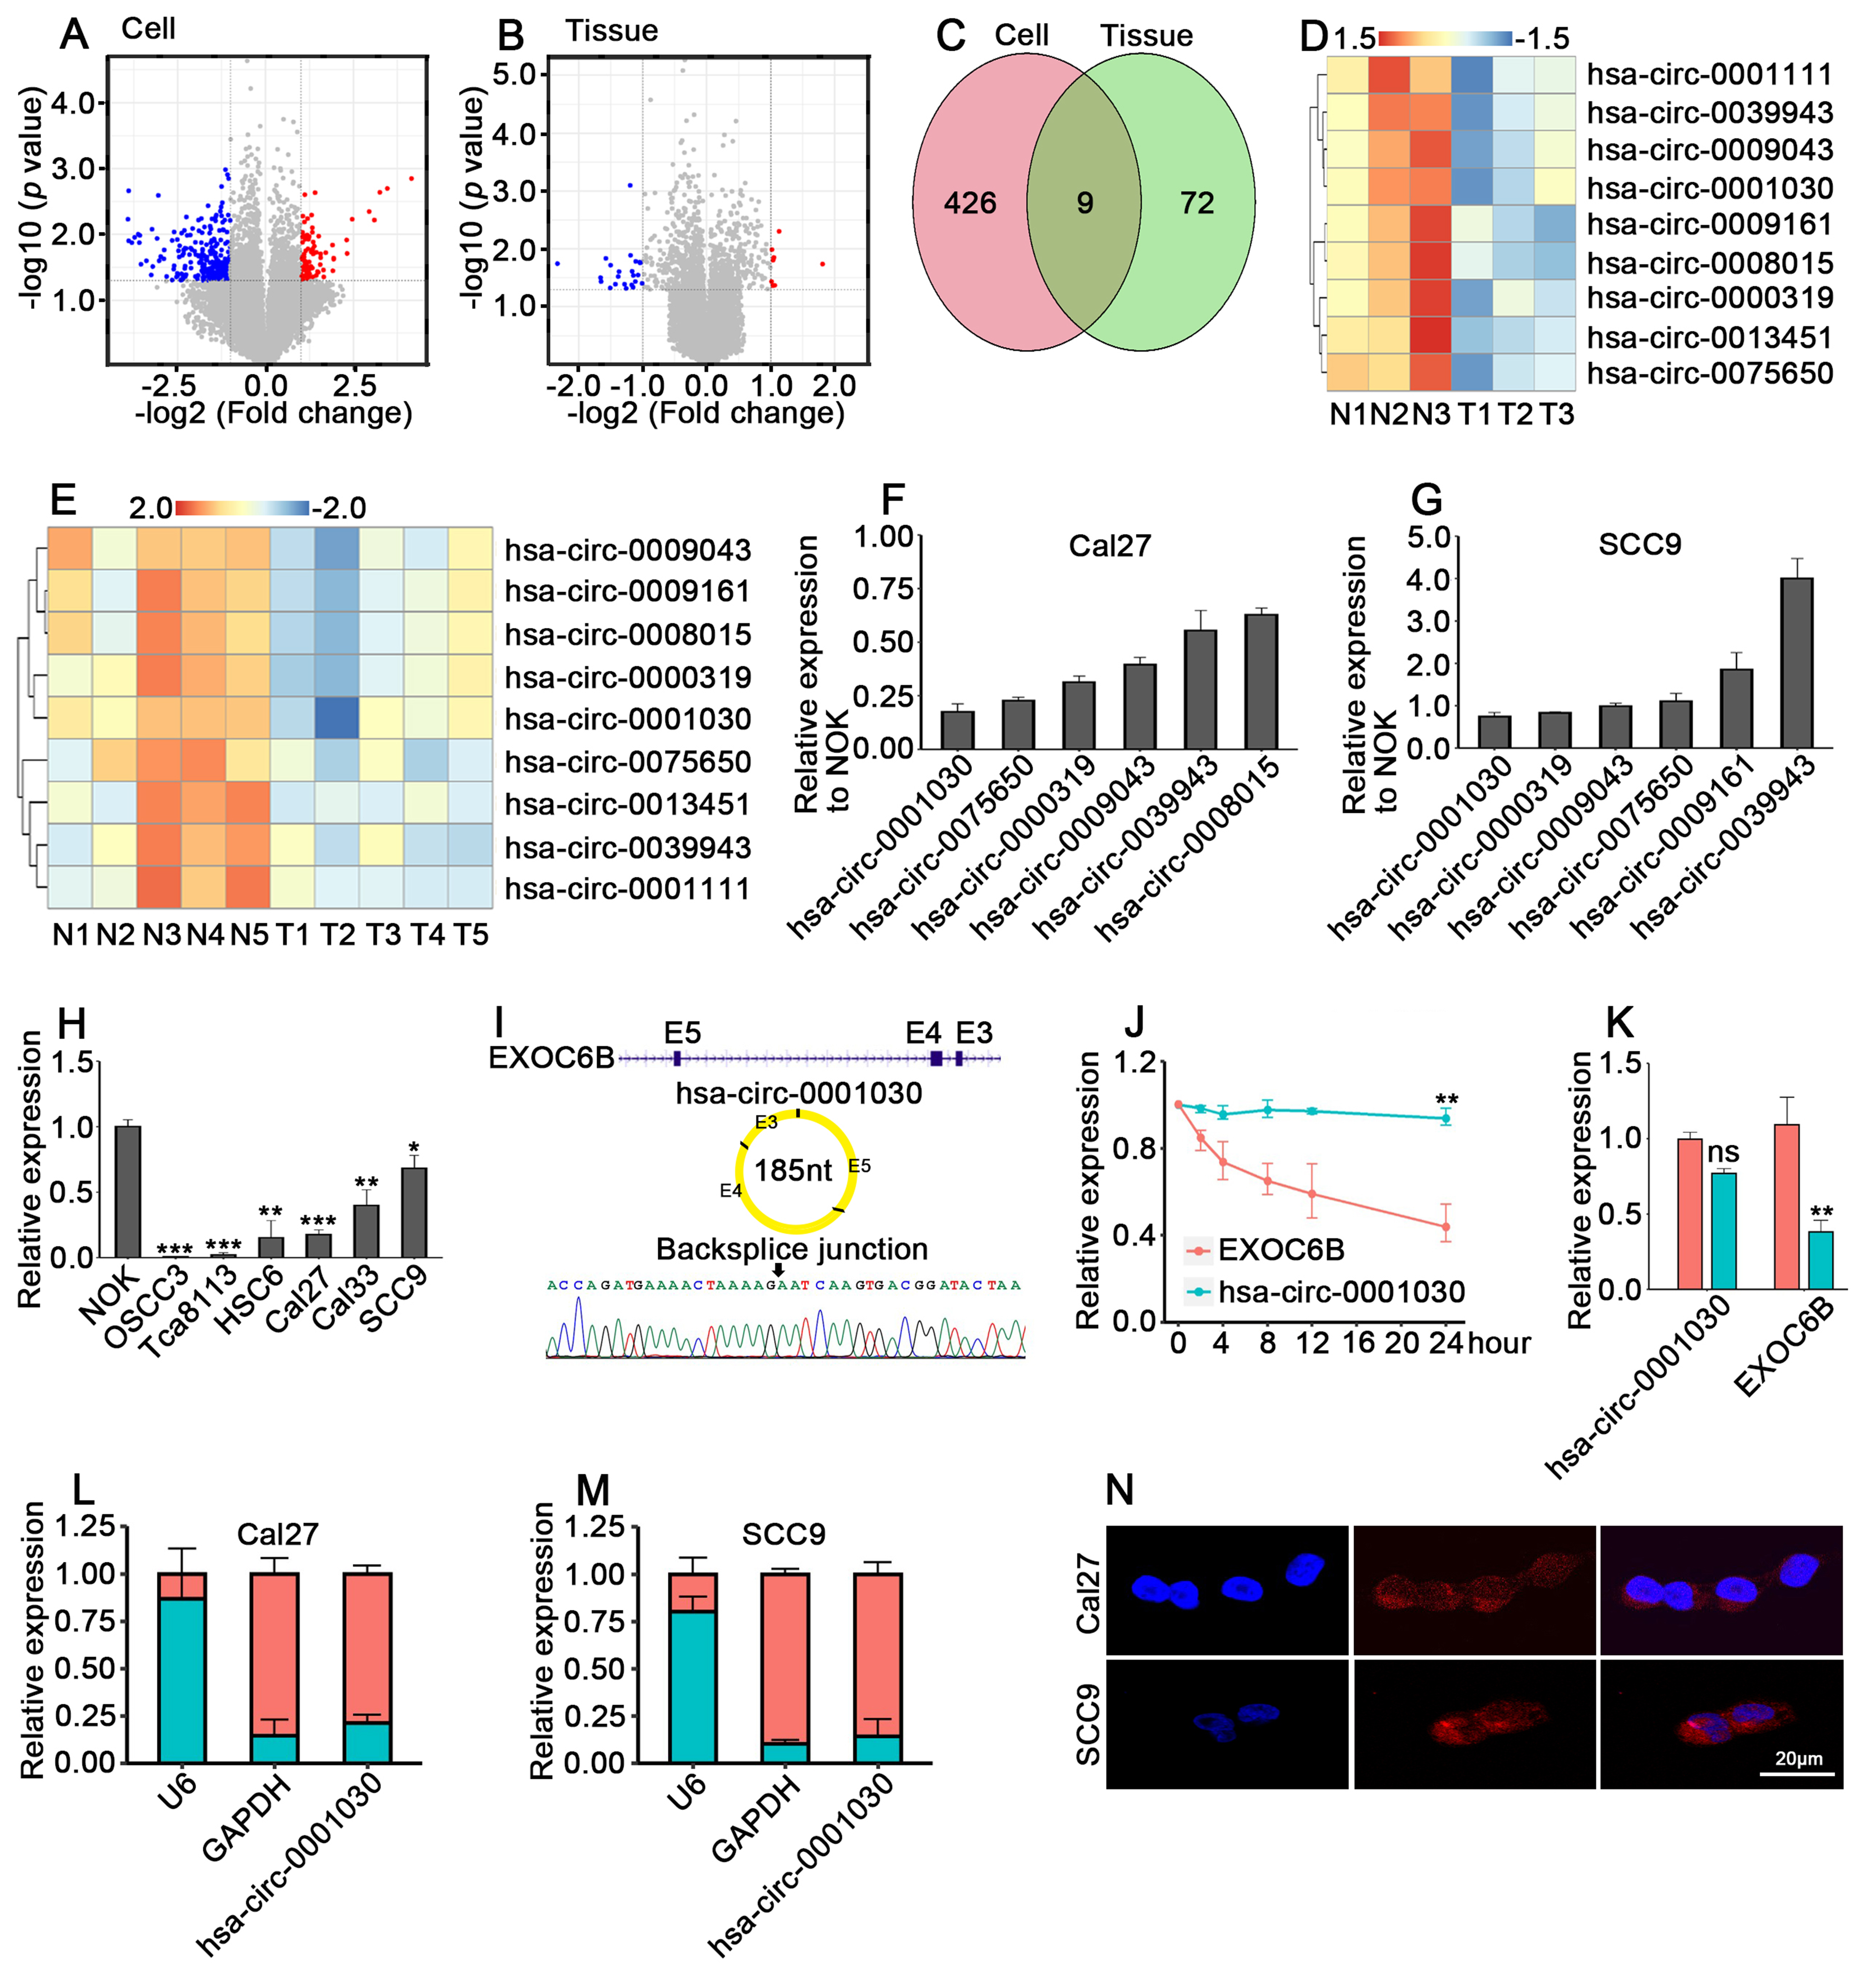
Figure 1. Hsa-circ-0001030 is significantly downregulated and exhibits cytoplasmic localization in TSCC. (A) Volcano plot showing differentially expressed circRNAs between Cal27 and NOK cells; (B) Volcano plot of circRNA expression profiles in five pairs of adjacent normal tissues and TSCC tumor tissues; (C) Venn diagram showing the overlap of downregulated circRNAs identified in cell lines and tissues; (D and E) Top nine downregulated circRNAs in Cal27 vs. NOK cells (D) and in TSCC vs. adjacent tissues (E); (F and G) qRT-PCR validation of six circRNAs consistently downregulated in both TSCC cells (Cal27, F) and SCC9 cells (G); (H) Relative expression of hsa-circ-0001030 in TSCC cell lines detected by qRT-PCR; (I) The circularization of hsa-circ-0001030 generated by back-splicing of exons 3-5 of the EXOC6B gene was illustrated by a schematic diagram; (J) The stability of hsa-circ-0001030 and the parental EXOC6B mRNA was assessed by qRT-PCR following actinomycin D treatment; (K) Quantification of hsa-circ-0001030 and EXOC6B mRNA expression in cells treated with RNase R or mock control by qRT-PCR; (L and M) Subcellular fractionation analysis showing the distribution of hsa-circ-0001030 in the cytoplasmic and nuclear fractions of Cal27 (L) and SCC9 (M) cells; (N) RNA FISH visualization confirming predominant cytoplasmic localization of hsa-circ-0001030 in Cal27 and SCC9 cells. Data are presented as mean ± SD from at least three independent experiments. P < 0.05 was considered statistically significant. *P < 0.05; **P < 0.01; ***P < 0.001; ns: not significant. TSCC: Tongue squamous cell carcinoma; circRNAs: circular RNAs; NOK: normal oral keratinocytes; qRT-PCR: quantitative real-time polymerase chain reaction; mRNA: messenger RNA; FISH: fluorescence in situ hybridization; SD: standard deviation; GAPDH: glyceraldehyde-3-phosphate dehydrogenase.


