


fig4
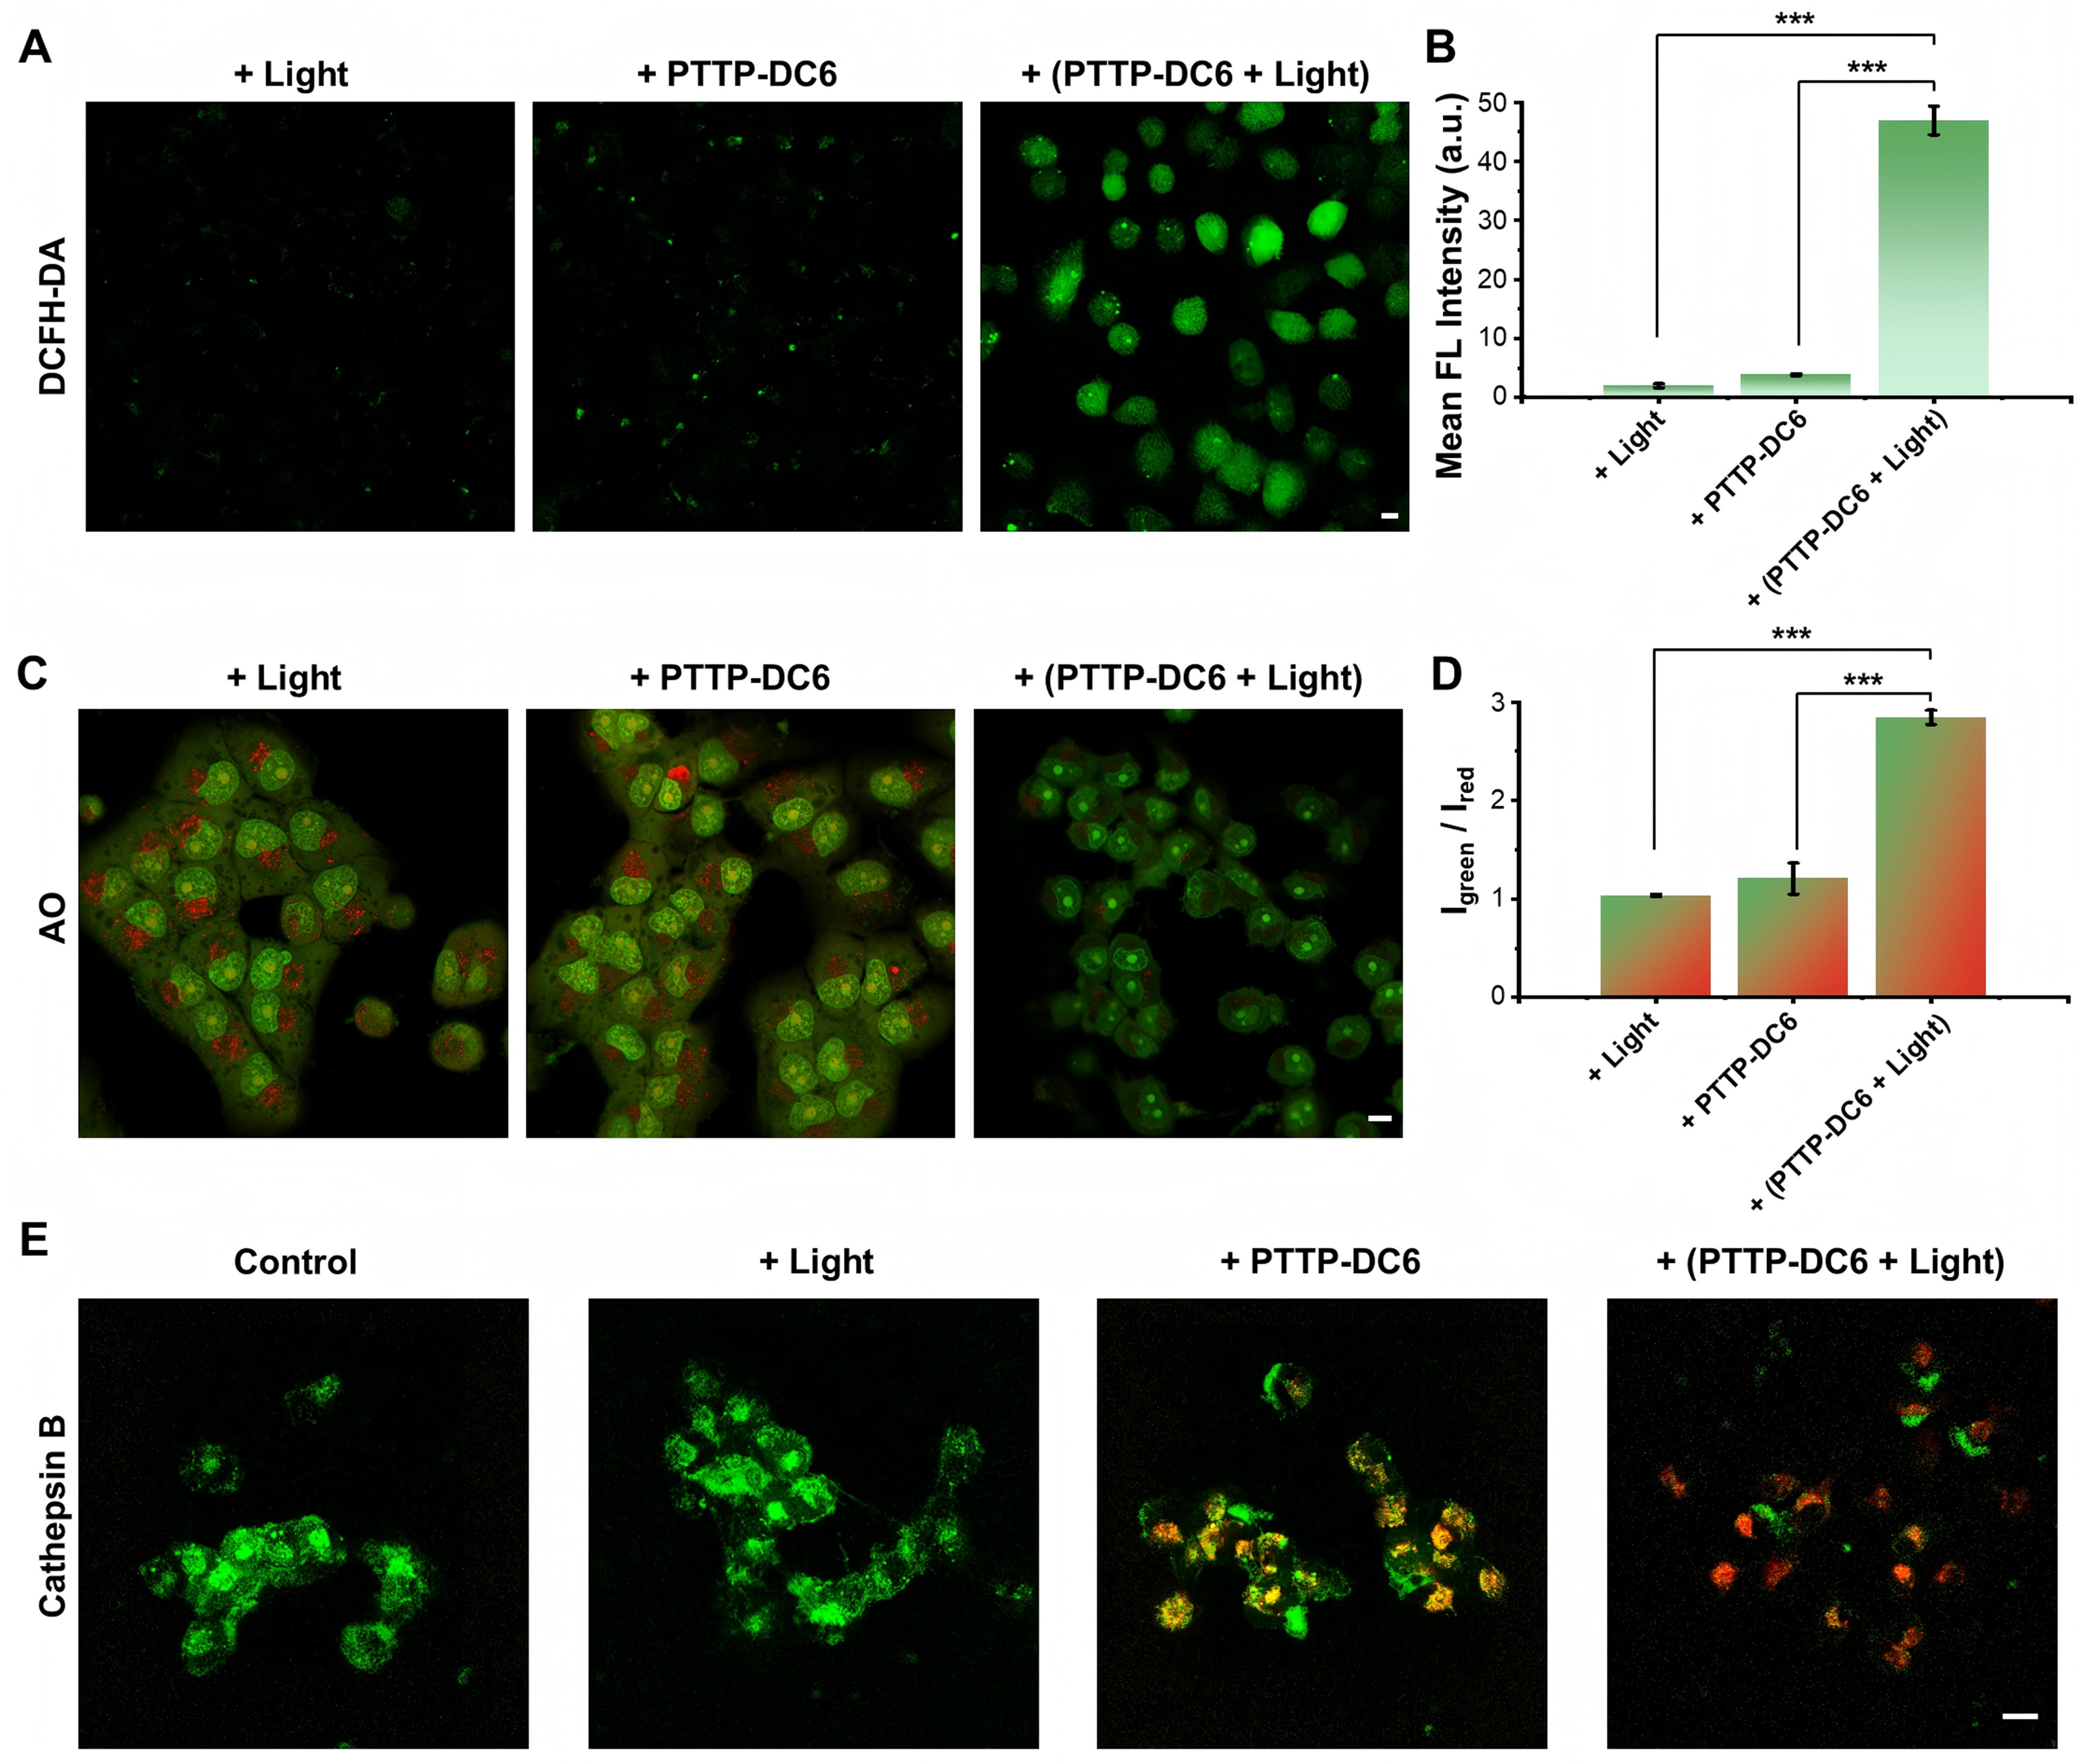
Figure 4. ROS generation and LMP induced by PTTP-DC6. (A and B) CLSM images and quantitative analysis (one-way ANOVA with Tukey’s test, ***P < 0.001) of ROS generation in MCF-7/ADR cells after PTTP-DC6 treatment and following irradiation. DCFH-DA was used as the ROS indicator; (C and D) CLSM images and quantitative analysis (one-way ANOVA with Tukey’s test, ***P < 0.001) of AO staining in MCF-7/ADR cells after various pretreatment. Igreen/Ired: ratio of green-to-red mean fluorescence intensity in the cytoplasmic region; (E) CLSM images for assessment of cathepsin B activity in MCF-7/ADR cells after PTTP-DC6 treatment and following irradiation. Scale bar: 10 μm. Data presented as mean ± SD. ROS: Reactive oxygen species; LMP: lysosomal membrane permeabilization; PTTP-DC6: benzene-pyridothiadiazole-thienothiophene-pyridothiadiazole-benzene conjugated framework with quaternary ammonium-terminated C6 alkyl chains at both ends; CLSM: confocal laser scanning microscope; ANOVA: analysis of variance; MCF-7/ADR: Michigan Cancer Foundation-7/adriamycin-resistant; DCFH-DA: 2′,7′-dichlorodihydrofluorescein diacetate; AO: acridine orange; SD: standard deviation; FL: fluorescence.


