


fig2
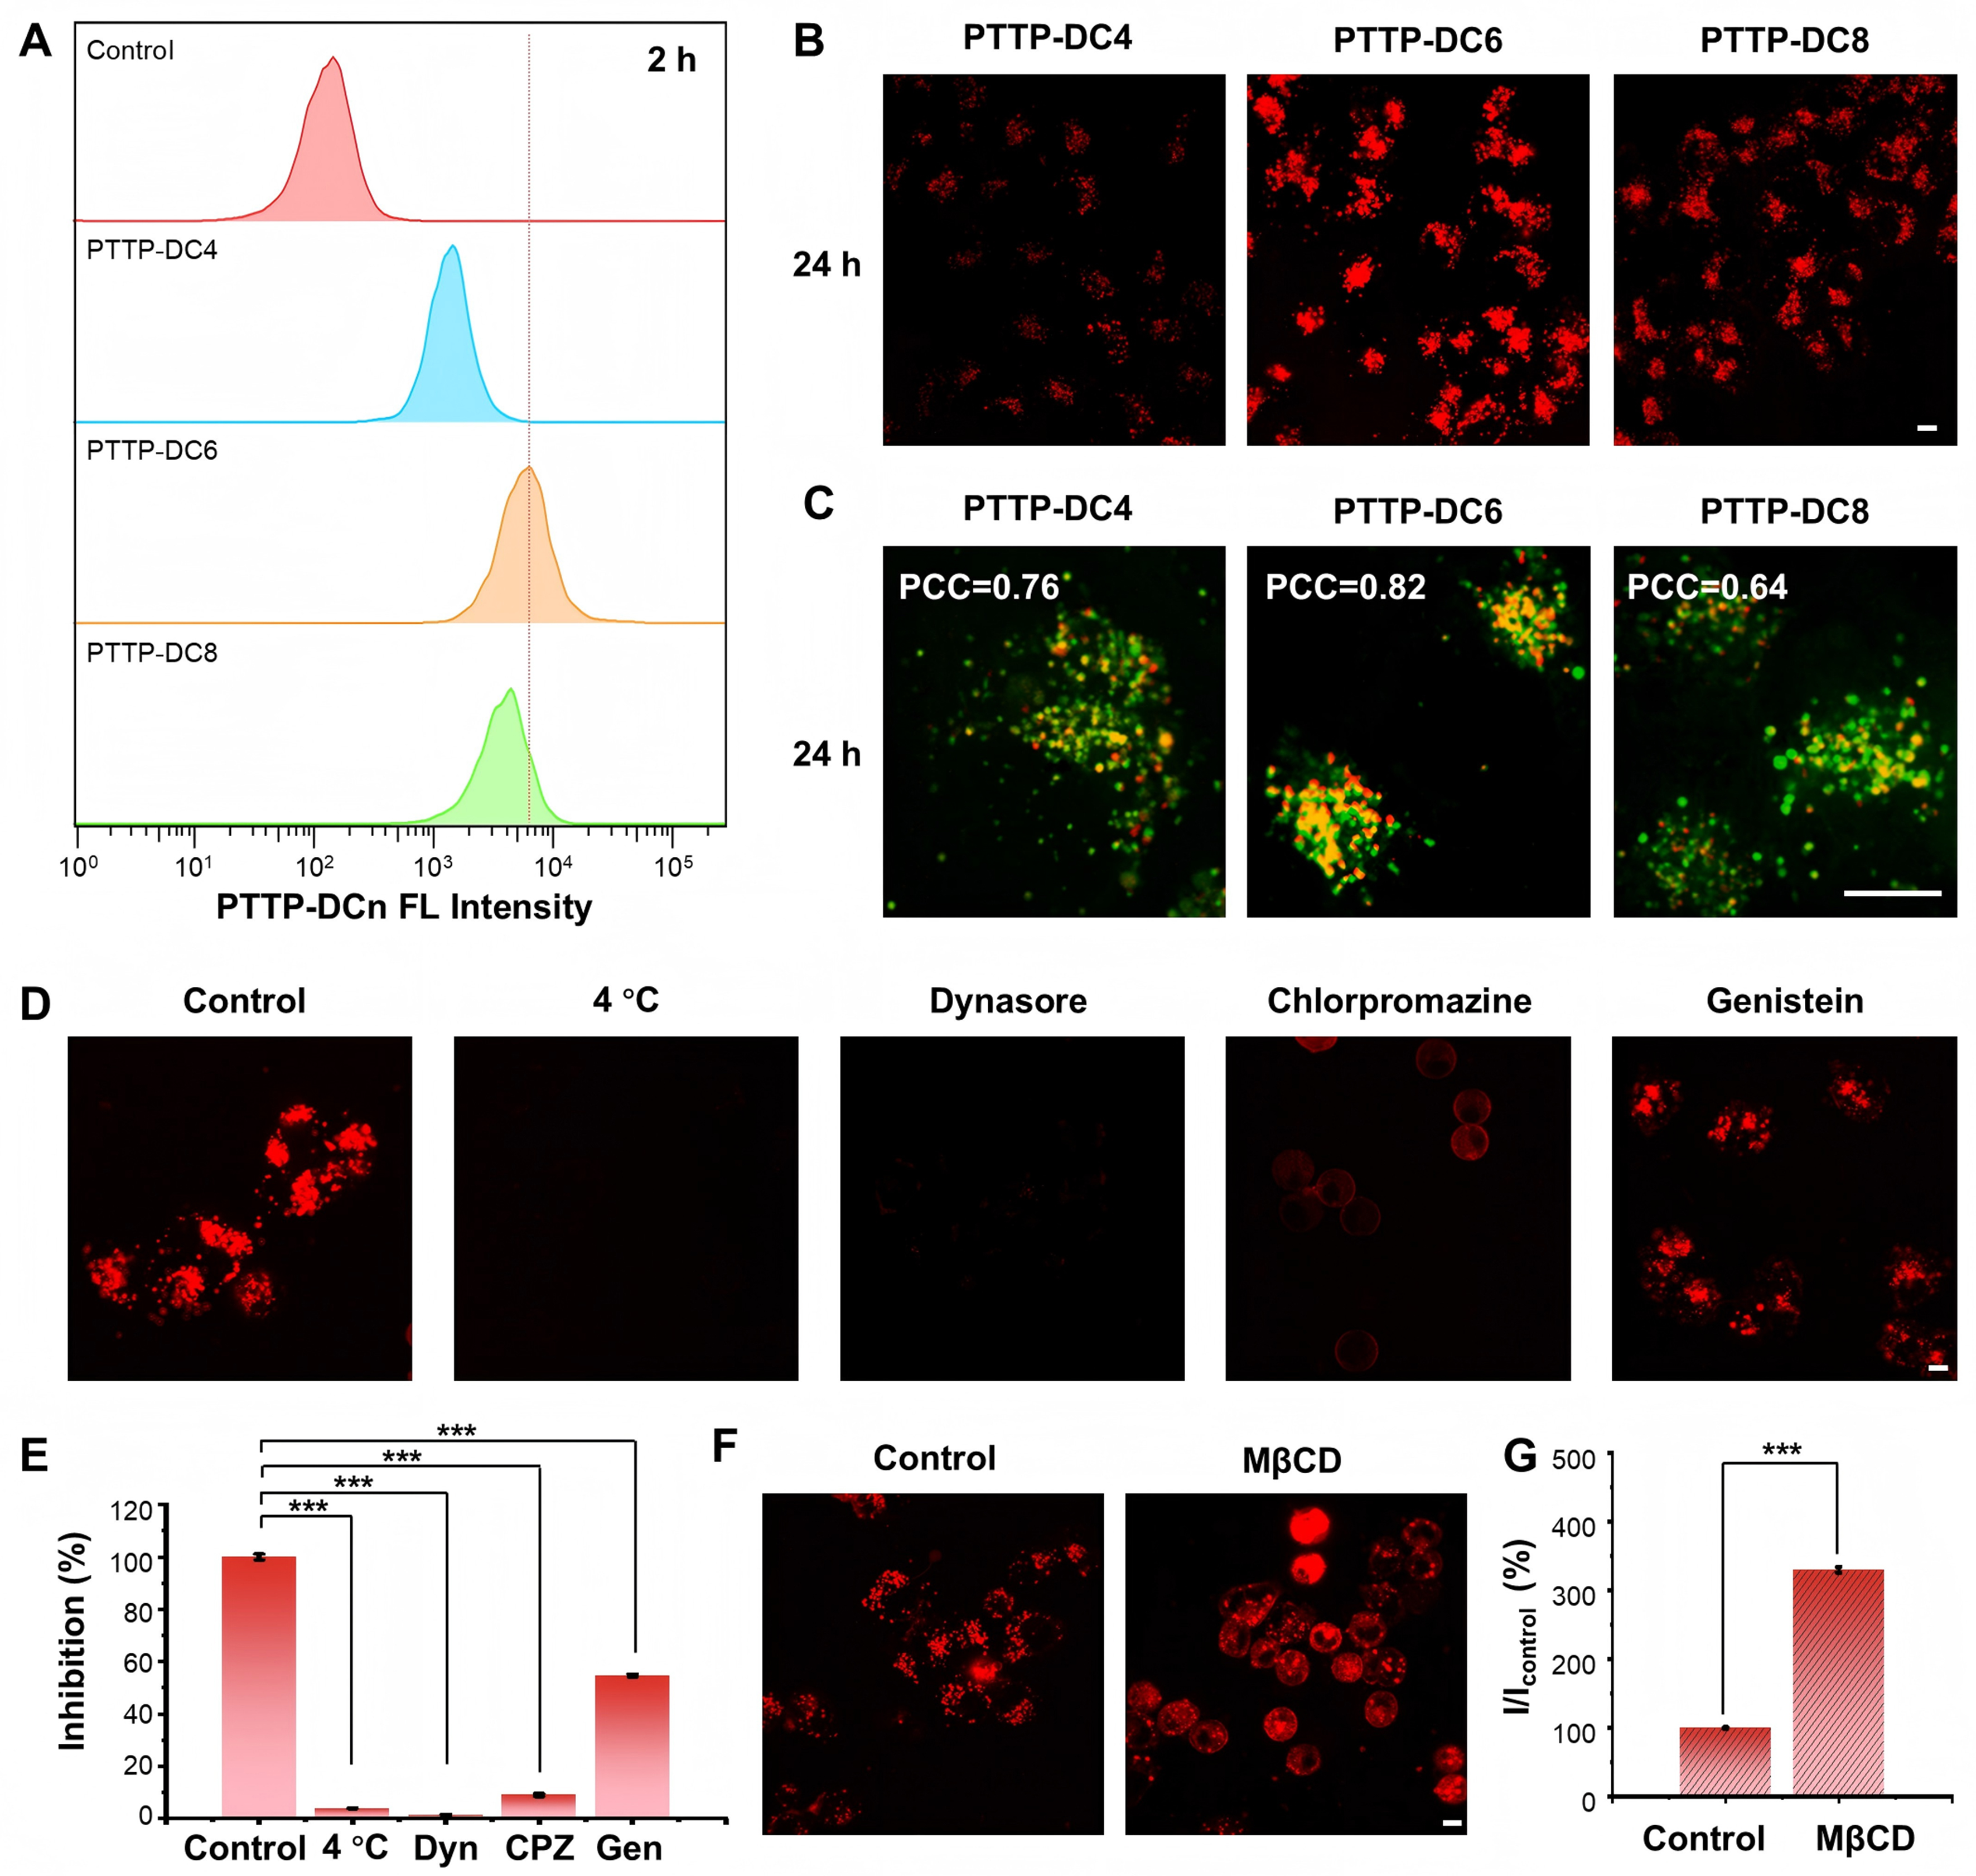
Figure 2. Cellular accumulation of PTTP-DCns. (A) Flow cytometric analysis of the cellular uptake of PTTP-DCns in MCF-7/ADR cells after a 2-hour incubation; (B) Confocal images of MCF-7/ADR cells stained with PTTP-DCns molecules after 24-hour incubation; (C) Representative merged images showing the co-localization of PTTP-DCns (red) and lysosome-specific dye LysoTracker Green (green) in MCF-7/ADR cells; (D and E) Confocal images and corresponding quantitative analysis (one-way ANOVA with Tukey’s test, ***P < 0.001) of MCF-7/ADR cells incubated with PTTP-DC6 (1 µM) in the presence of various endocytosis inhibition conditions; (F and G) Confocal images and corresponding quantitative analysis (Student’s t-test, ***P < 0.001) of MCF-7/ADR cells pre-treated with MβCD (10 mM) for 30 min and then incubated with PTTP-DC6 (10 µM) at 37 °C for 2 h. Scale bar: 10 μm. Data presented as mean ± SD. PTTP-DCns: Benzene-pyridothiadiazole-thienothiophene-pyridothiadiazole-benzene conjugated framework with quaternary ammonium-terminated n-carbon alkyl chains at both ends; MCF-7/ADR: Michigan Cancer Foundation-7/adriamycin-resistant; ANOVA: analysis of variance; PTTP-DC4/6/8: benzene-pyridothiadiazole-thienothiophene-pyridothiadiazole-benzene conjugated framework with quaternary ammonium-terminated C4/C6/C8 alkyl chains at both ends; PCC: Pearson’s correlation coefficient; MβCD: methyl-β-cyclodextrin; SD: standard deviation; FL: fluorescence; Dyn: dynasore; CPZ: chlorpromazine; Gen: genistein.


