


fig6
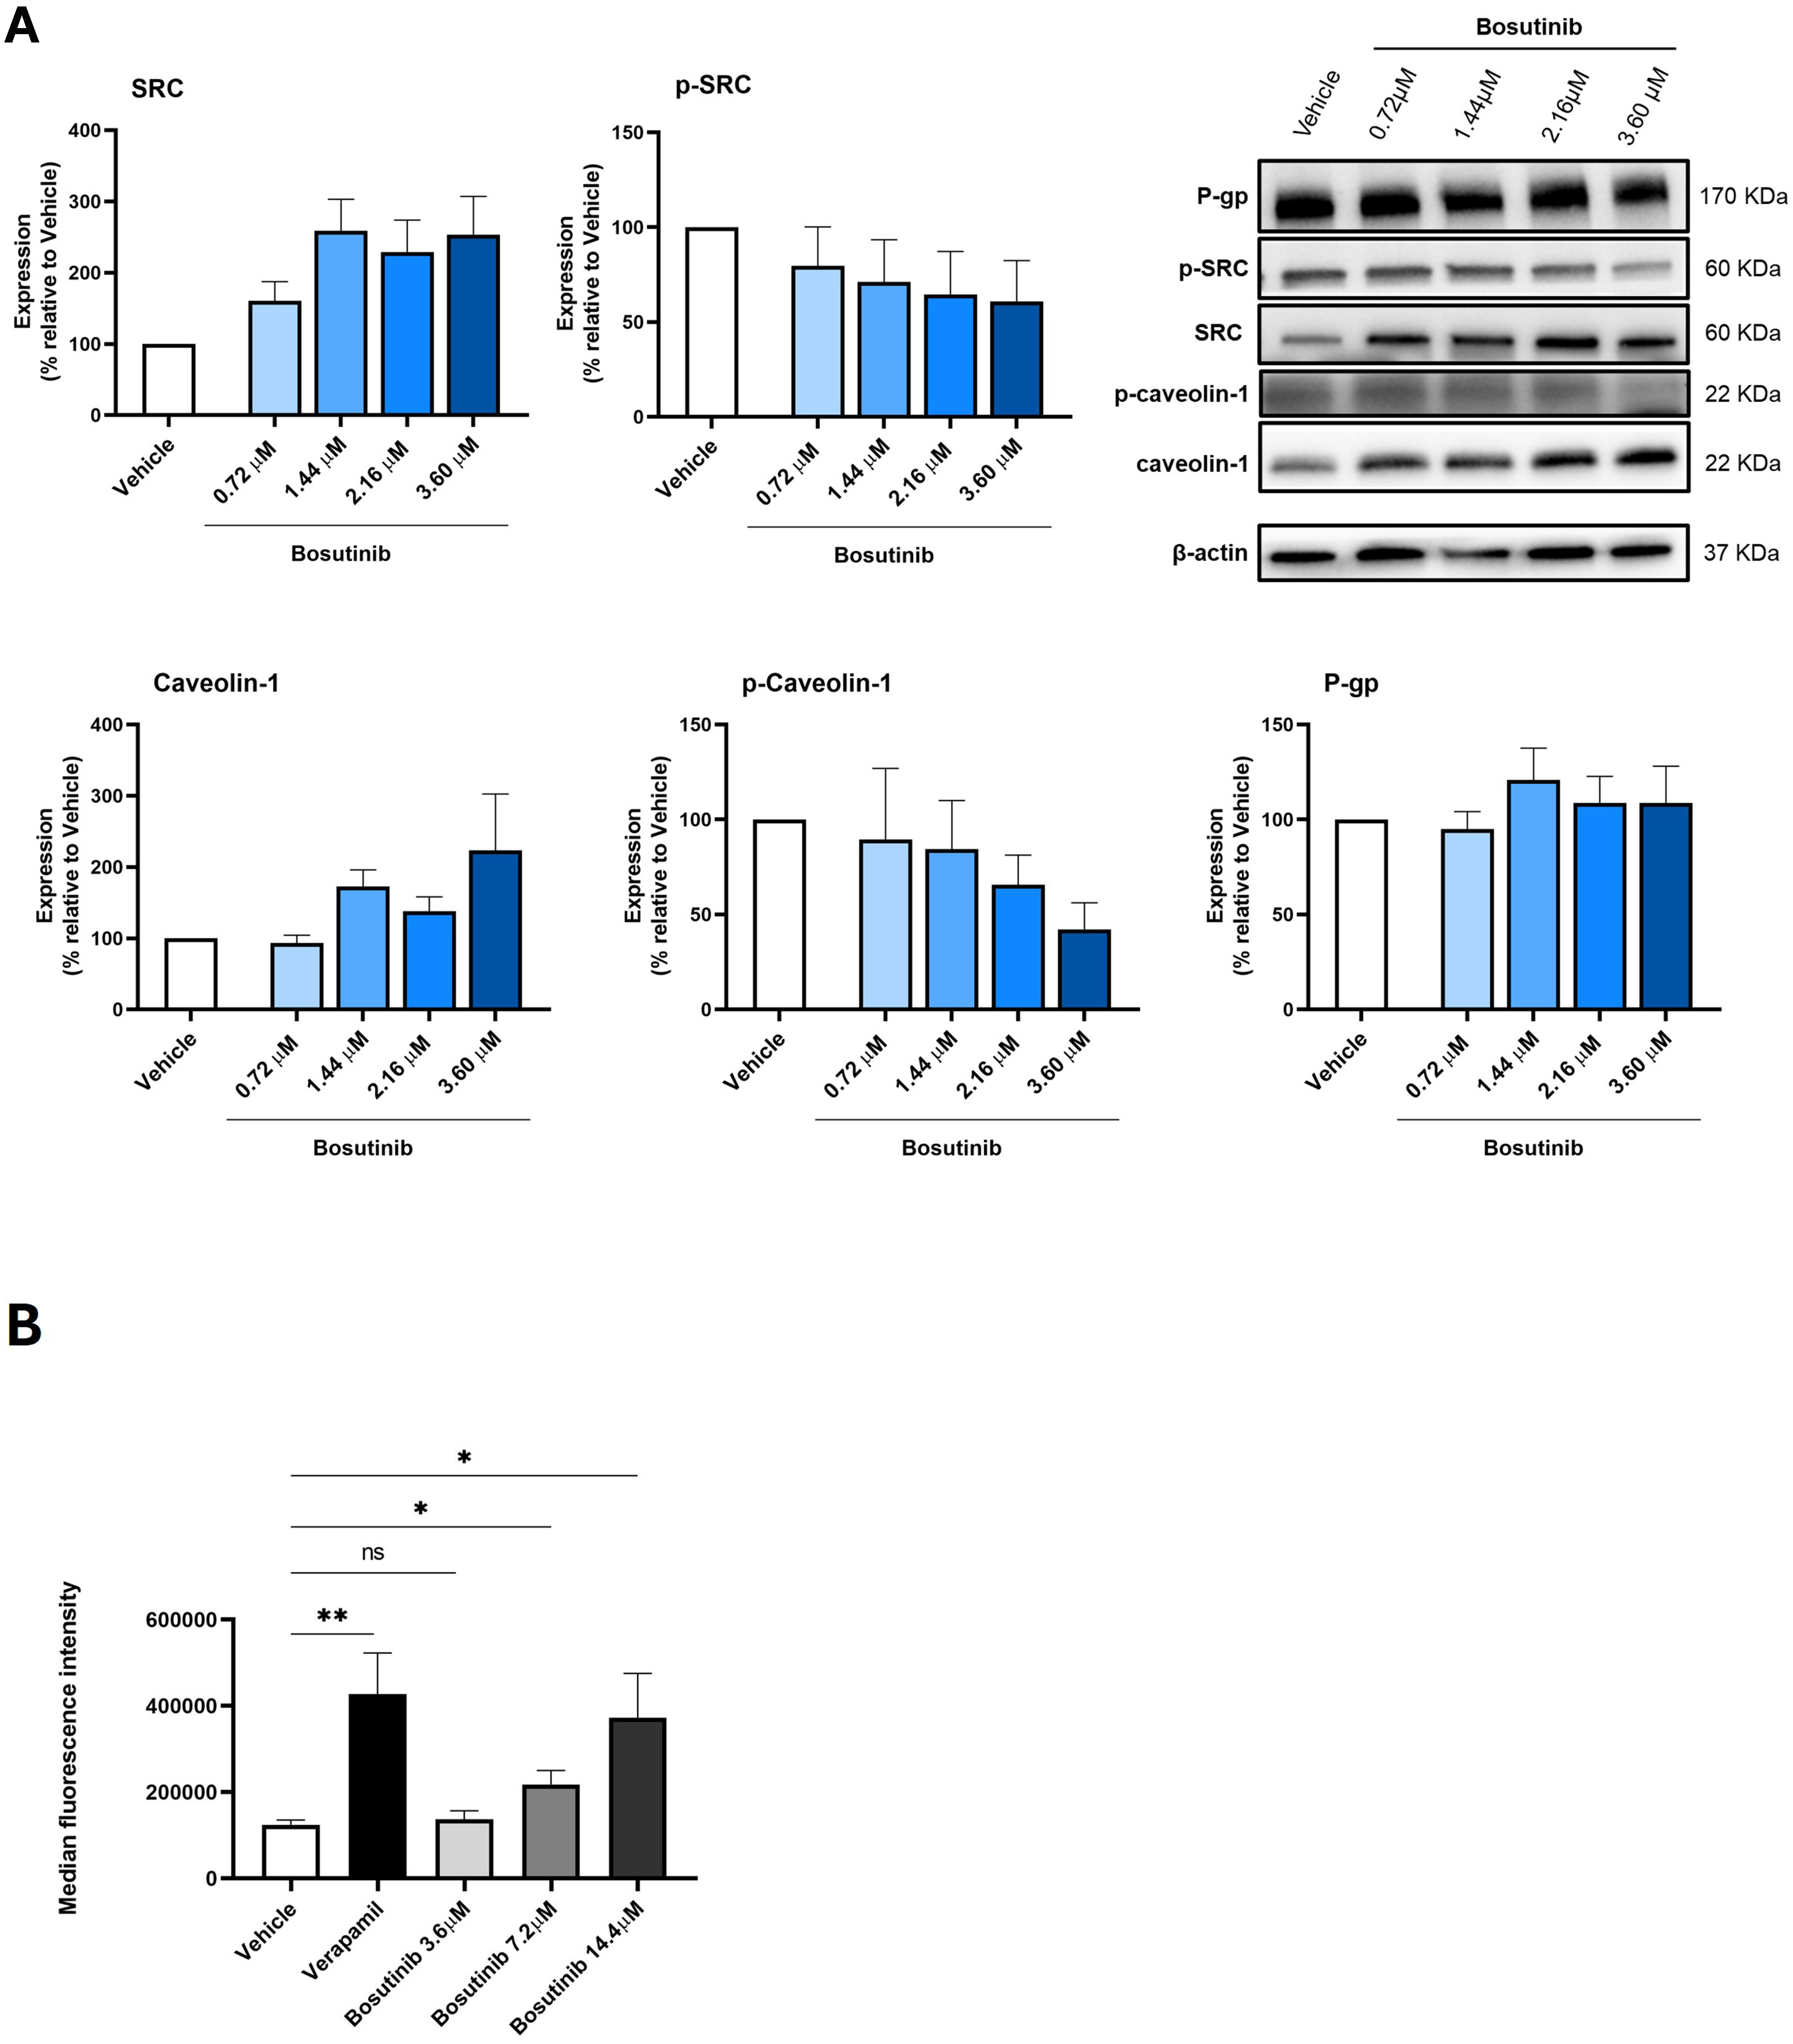
Figure 6. Effect of bosutinib on SRC, p-SRC, caveolin-1, p-caveolin-1, and P-gp in NCI-H460/R cells. (A) Protein expression levels were assessed by WB. Vehicle (DMSO at the highest concentration) was used as control. Results are expressed as the expression level of each protein normalized to β-actin, SRC (in the case of p-SRC) or caveolin-1 (in the case of p-caveolin-1). Data represent mean ± SEM of at least three independent experiments. Representative blots are shown; (B) Effect of different bosutinib concentrations on rhodamine-123 accumulation in NCI-H460/R cells, assessed by flow cytometry. Verapamil was used as a positive control. Vehicle (DMSO at the highest concentration) was included to exclude solvent toxicity. Results are represented as mean fluorescence intensity and are shown as mean ± SEM of at least three independent experiments. Statistical significance was determined using an unpaired Student’s t-test. *P < 0.05; **P < 0.01; ns: not significant. p-SRC: Phosphorylated form of SRC; P-gp: P-glycoprotein; WB: Western blotting; DMSO: dimethyl sulfoxide; SEM: standard error of the mean.


