


fig5
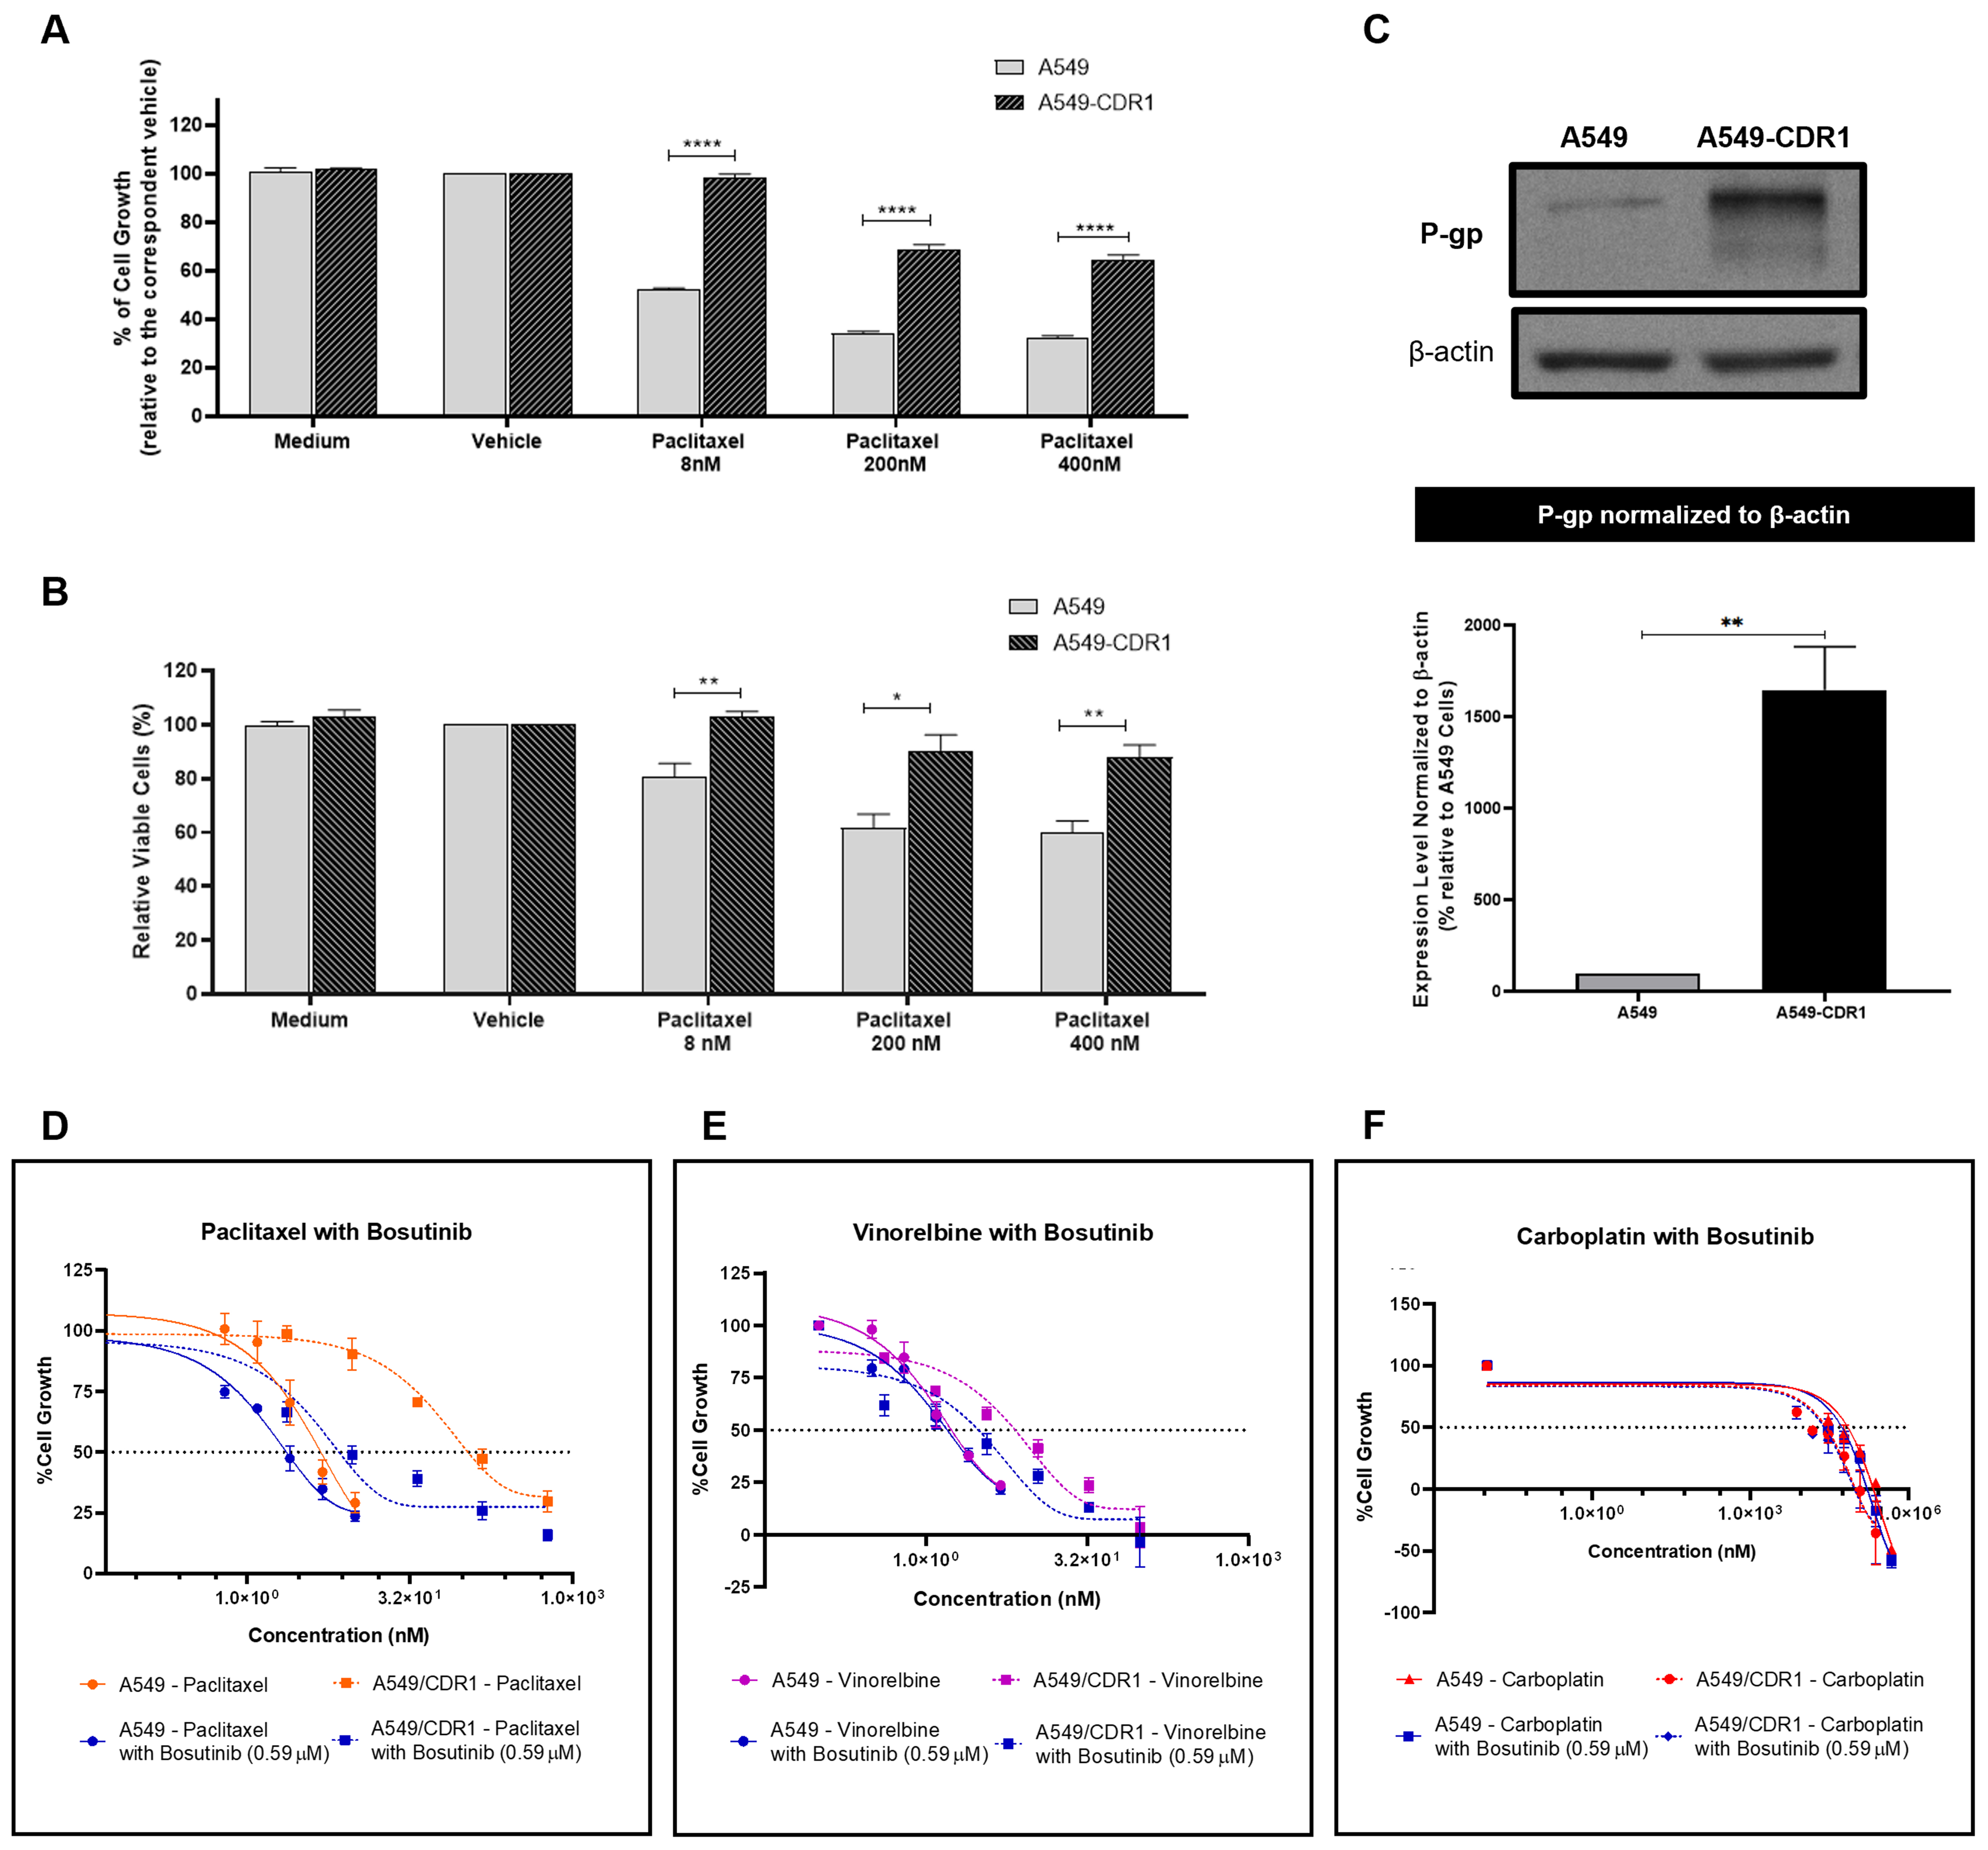
Figure 5. Confirmation of the MDR phenotype in the A549-CDR1 cell line and evaluation of the synergistic effect of bosutinib combined with conventional chemotherapeutic drugs in sensitive A549 and MDR A549-CDR1 cells. (A) Effect of different paclitaxel concentrations (8, 200, and 400 nM) on the % of cell growth of A549 and A549-CDR1 cells, assessed by the SRB assay. Vehicle at the highest concentration tested was used as control. Results are expressed as mean ± SEM of at least three independent experiments. Statistical significance was assessed using an unpaired Student’s t-test. ****P < 0.0001; (B) Effect of different paclitaxel concentrations (8, 200, and 400 nM) on cell viability (% of viable cells) of A549 and A549-CDR1 cells, assessed by trypan blue exclusion assay. Vehicle at the highest concentration tested was used as control. Results are expressed as mean ± SEM of at least three independent experiments. Statistical significance was assessed using an unpaired Student’s t-test. *P < 0.05; **P < 0.01; (C) P-gp expression in A549 and A549-CDR1 cells, assessed by WB. Protein levels were normalized to β-actin. Results are expressed as mean ± SEM of at least three independent experiments. **P < 0.01. Representative blot shown; (D-F) Effect of serially diluted chemotherapeutic drugs: - paclitaxel (D), vinorelbine (E), and carboplatin (F), - alone or in combination with 0.59 µM bosutinib, on the % of cell growth of A549 and A549-CDR1 cells, assessed by the SRB assay. Vehicle at the highest concentration tested was used as control. Results are expressed as mean ± SEM of at least three independent experiments. MDR: Multidrug resistance; SRB: sulforhodamine B; SEM: standard error of the mean; P-gp: P-glycoprotein; WB: Western blotting.


