


fig2
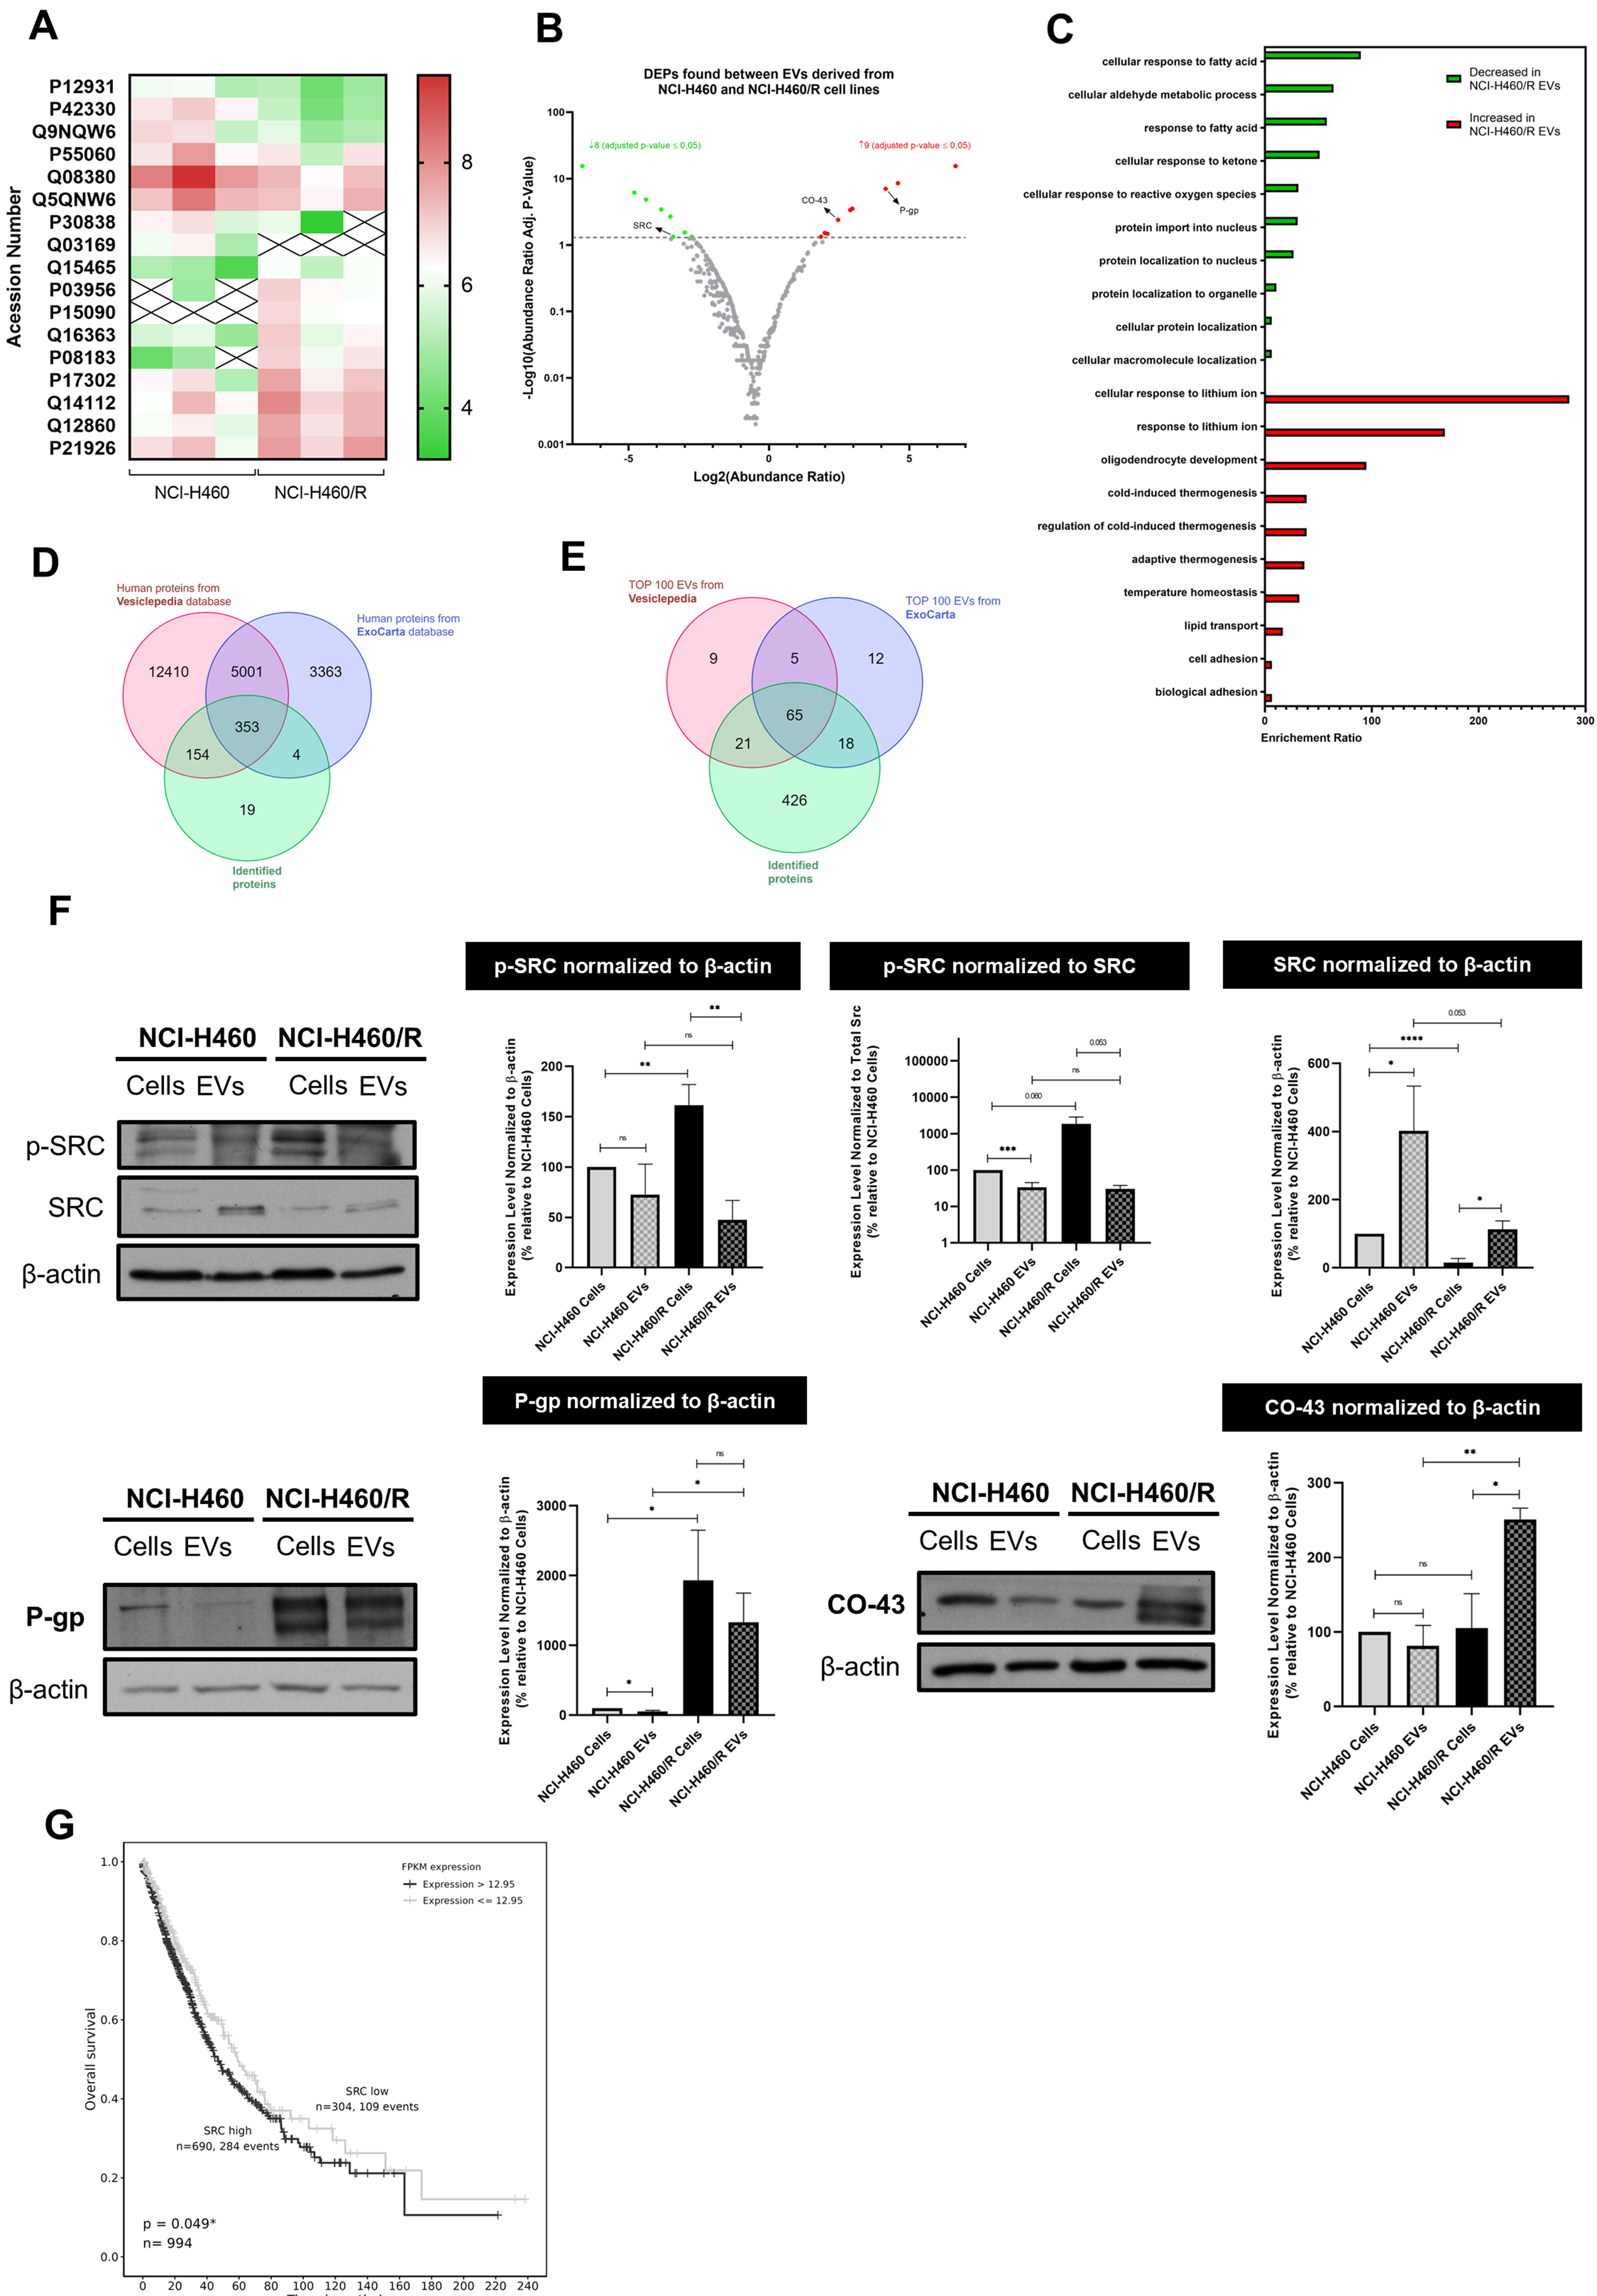
Figure 2. Proteomic analysis of EVs isolated from NCI-H460 and NCI-H460/R cell lines and validation of the results. (A) Heat map of DEPs between EVs isolated from the sensitive and multidrug resistant cell lines; (B) Volcano plot of all identified proteins in EVs isolated from both cell lines; (C) Gene ontology analysis showing the biological processes associated with proteins present in EVs isolated from both cell lines; (D) Venn diagram comparing proteins identified in this study with those in the Vesiclepedia and ExoCarta databases; (E) Comparative analysis between the Top 100 EV proteins identified in this study and those reported in Vesiclepedia and ExoCarta databases; (F) Analysis of the levels of proteins found in cells and EVs from counterpart sensitive and MDR cells, determined by WB. Representative blots and quantitative analysis (mean ± SEM) are from at least three independent experiments. Statistical significance was assessed using an unpaired Student’s t-test: *P < 0.05; **P < 0.01; ***P < 0.001; ****P < 0.0001; ns: non-significant; (G) Kaplan-Meier curves showing OS according to SRC gene expression in NSCLC patients. EVs: Extracellular vesicles; DEPs: differentially expressed proteins; MDR: multidrug resistance; WB: Western blotting; SEM: standard error of the mean; OS: overall survival; NSCLC: non-small cell lung cancer; p-SRC: phosphorylated form of SRC; P-gp: P-glycoprotein.


