fig4
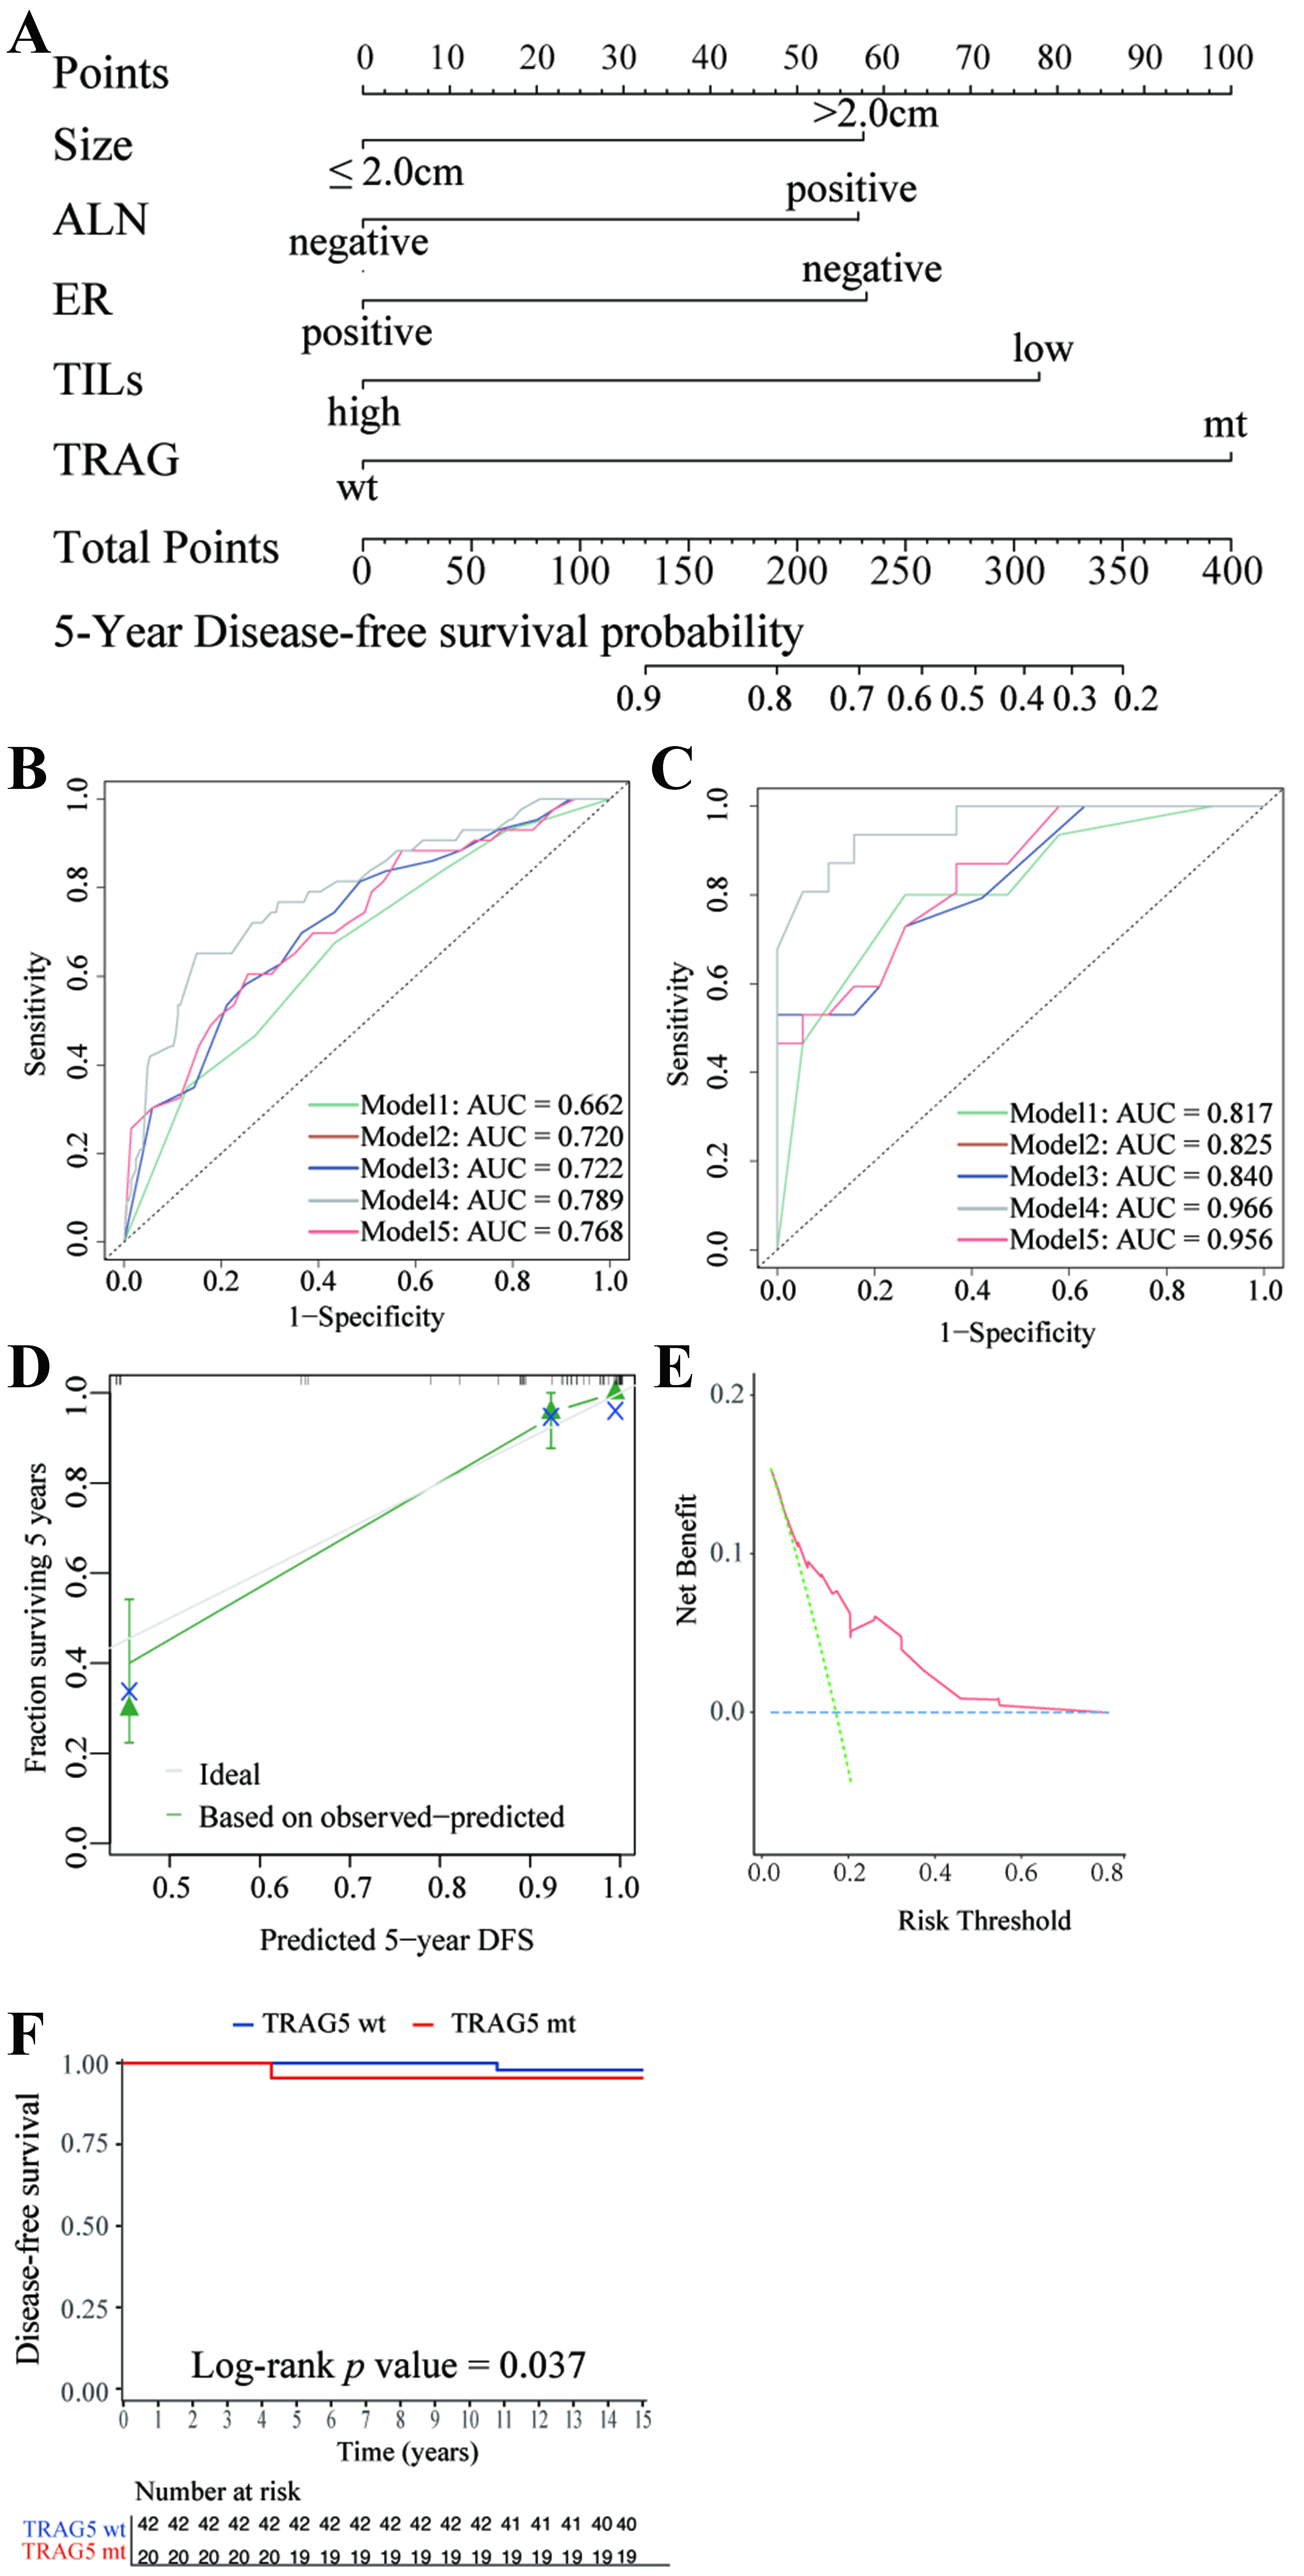
Figure 4. Visualization of the novel model and its performance. (A) Nomogram of the novel model for predicting 5-year DFS in HER2-positive early-stage BC patients receiving 1-year trastuzumab-based adjuvant treatment; (B) ROC curves in the training cohort for: Model 1 (tumor size, ALN status, ER status; green curve), Model 2 (Model 1 + TILs; brown curve), Model 3 (Model 2 + CNA level; blue curve), Model 4 (our novel 5-variable model: tumor size, ALN status, ER status, TILs, TRAG status; grey curve), and Model 5 (Model 3 + TRAG status; red curve). The performance of the novel model was evaluated by AUC; (C) ROC curves and AUC of Models 1-5 in the internal validation cohort; (D) Calibration curve in the validation cohort; (E) DCA in the validation cohort; (F) Kaplan-Meier estimates of DFS according to TRAG status (wild-type vs. mutant) in the TCGA cohort. ALN: Axillary lymph node; ER: estrogen receptor; TILs: tumor-infiltrating lymphocytes; TRAG: trastuzumab response-associated gene; DFS: disease-free survival; AUC: area under the receiver operating characteristic curve; wt: wild-type; mt: mutant; TCGA: The Cancer Genome Atlas; ROC: receiver operating characteristic curve; DCA: decision curve analysis.


