


fig5
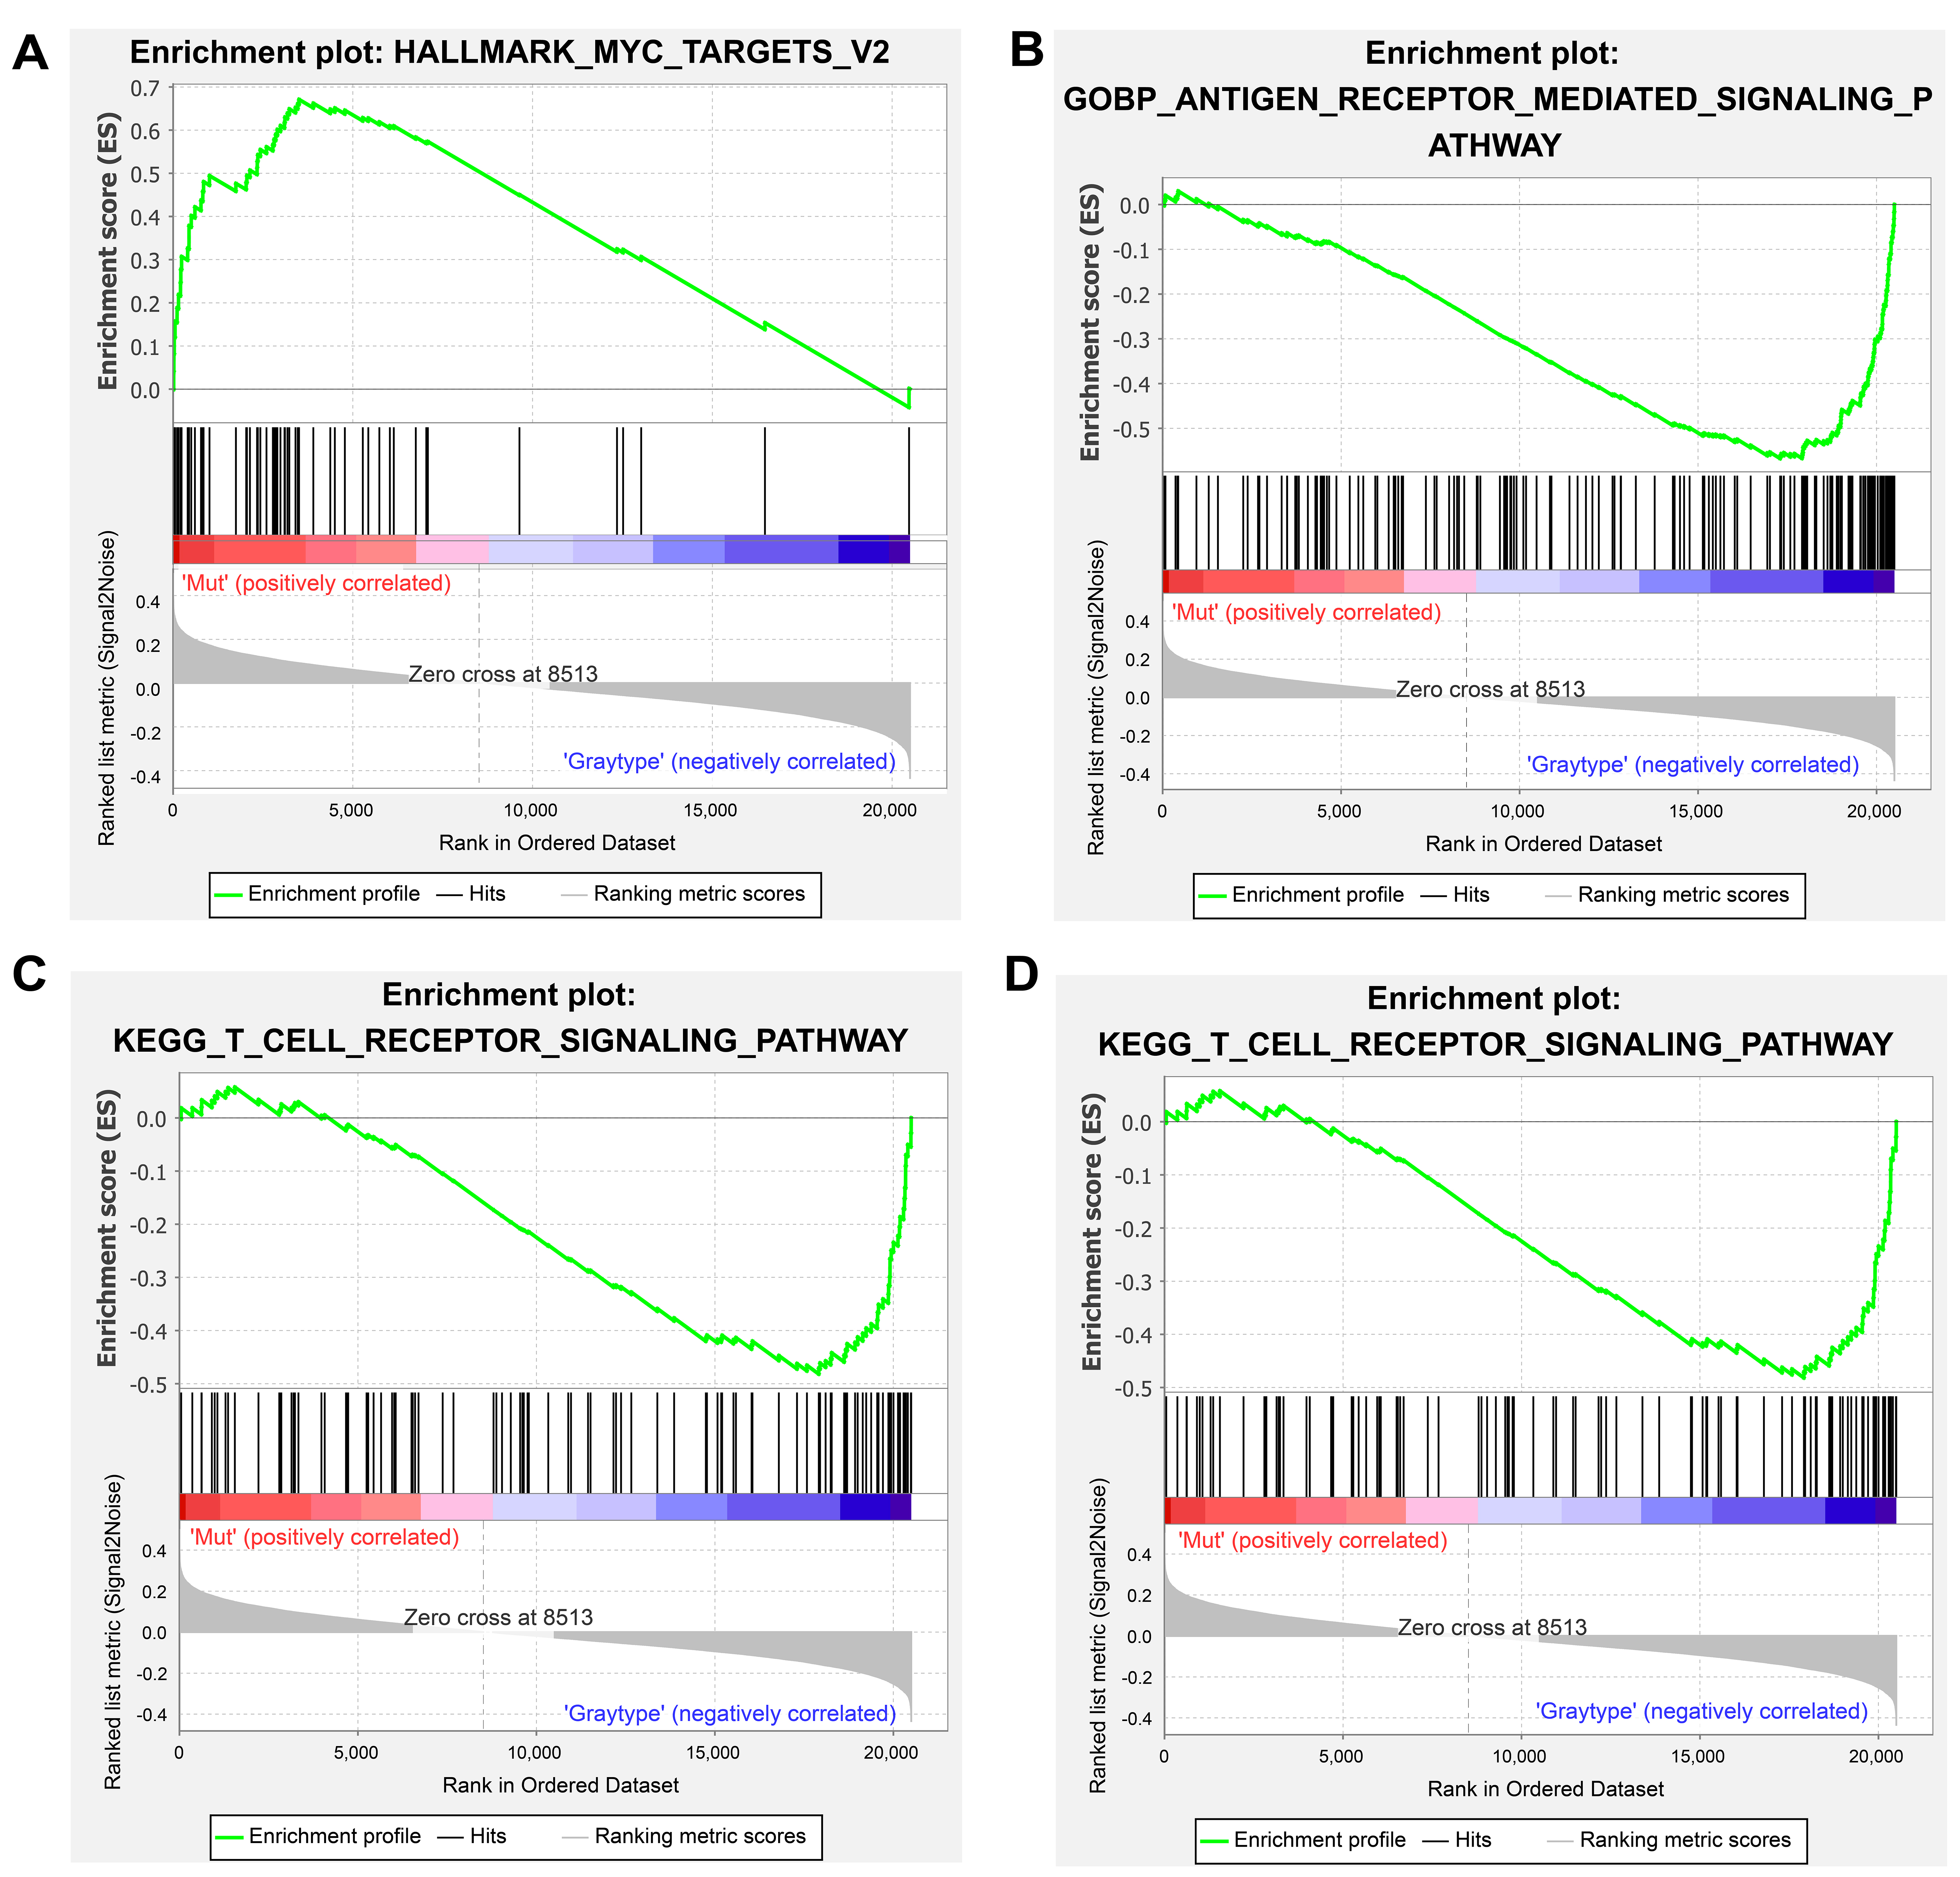
Figure 5. GSEA results for hallmark gene sets (A) and KEGG pathways (B-D). A t-value > 0 (red) indicates higher scores in ROS1-Mut tumors; t-value < 0 (blue) indicates higher scores in ROS1-WT tumors. GSEA: Gene set enrichment analysis; ROS1-Mut: ROS1 mutations; ROS1-WT: ROS1-wild-type.


