


fig3
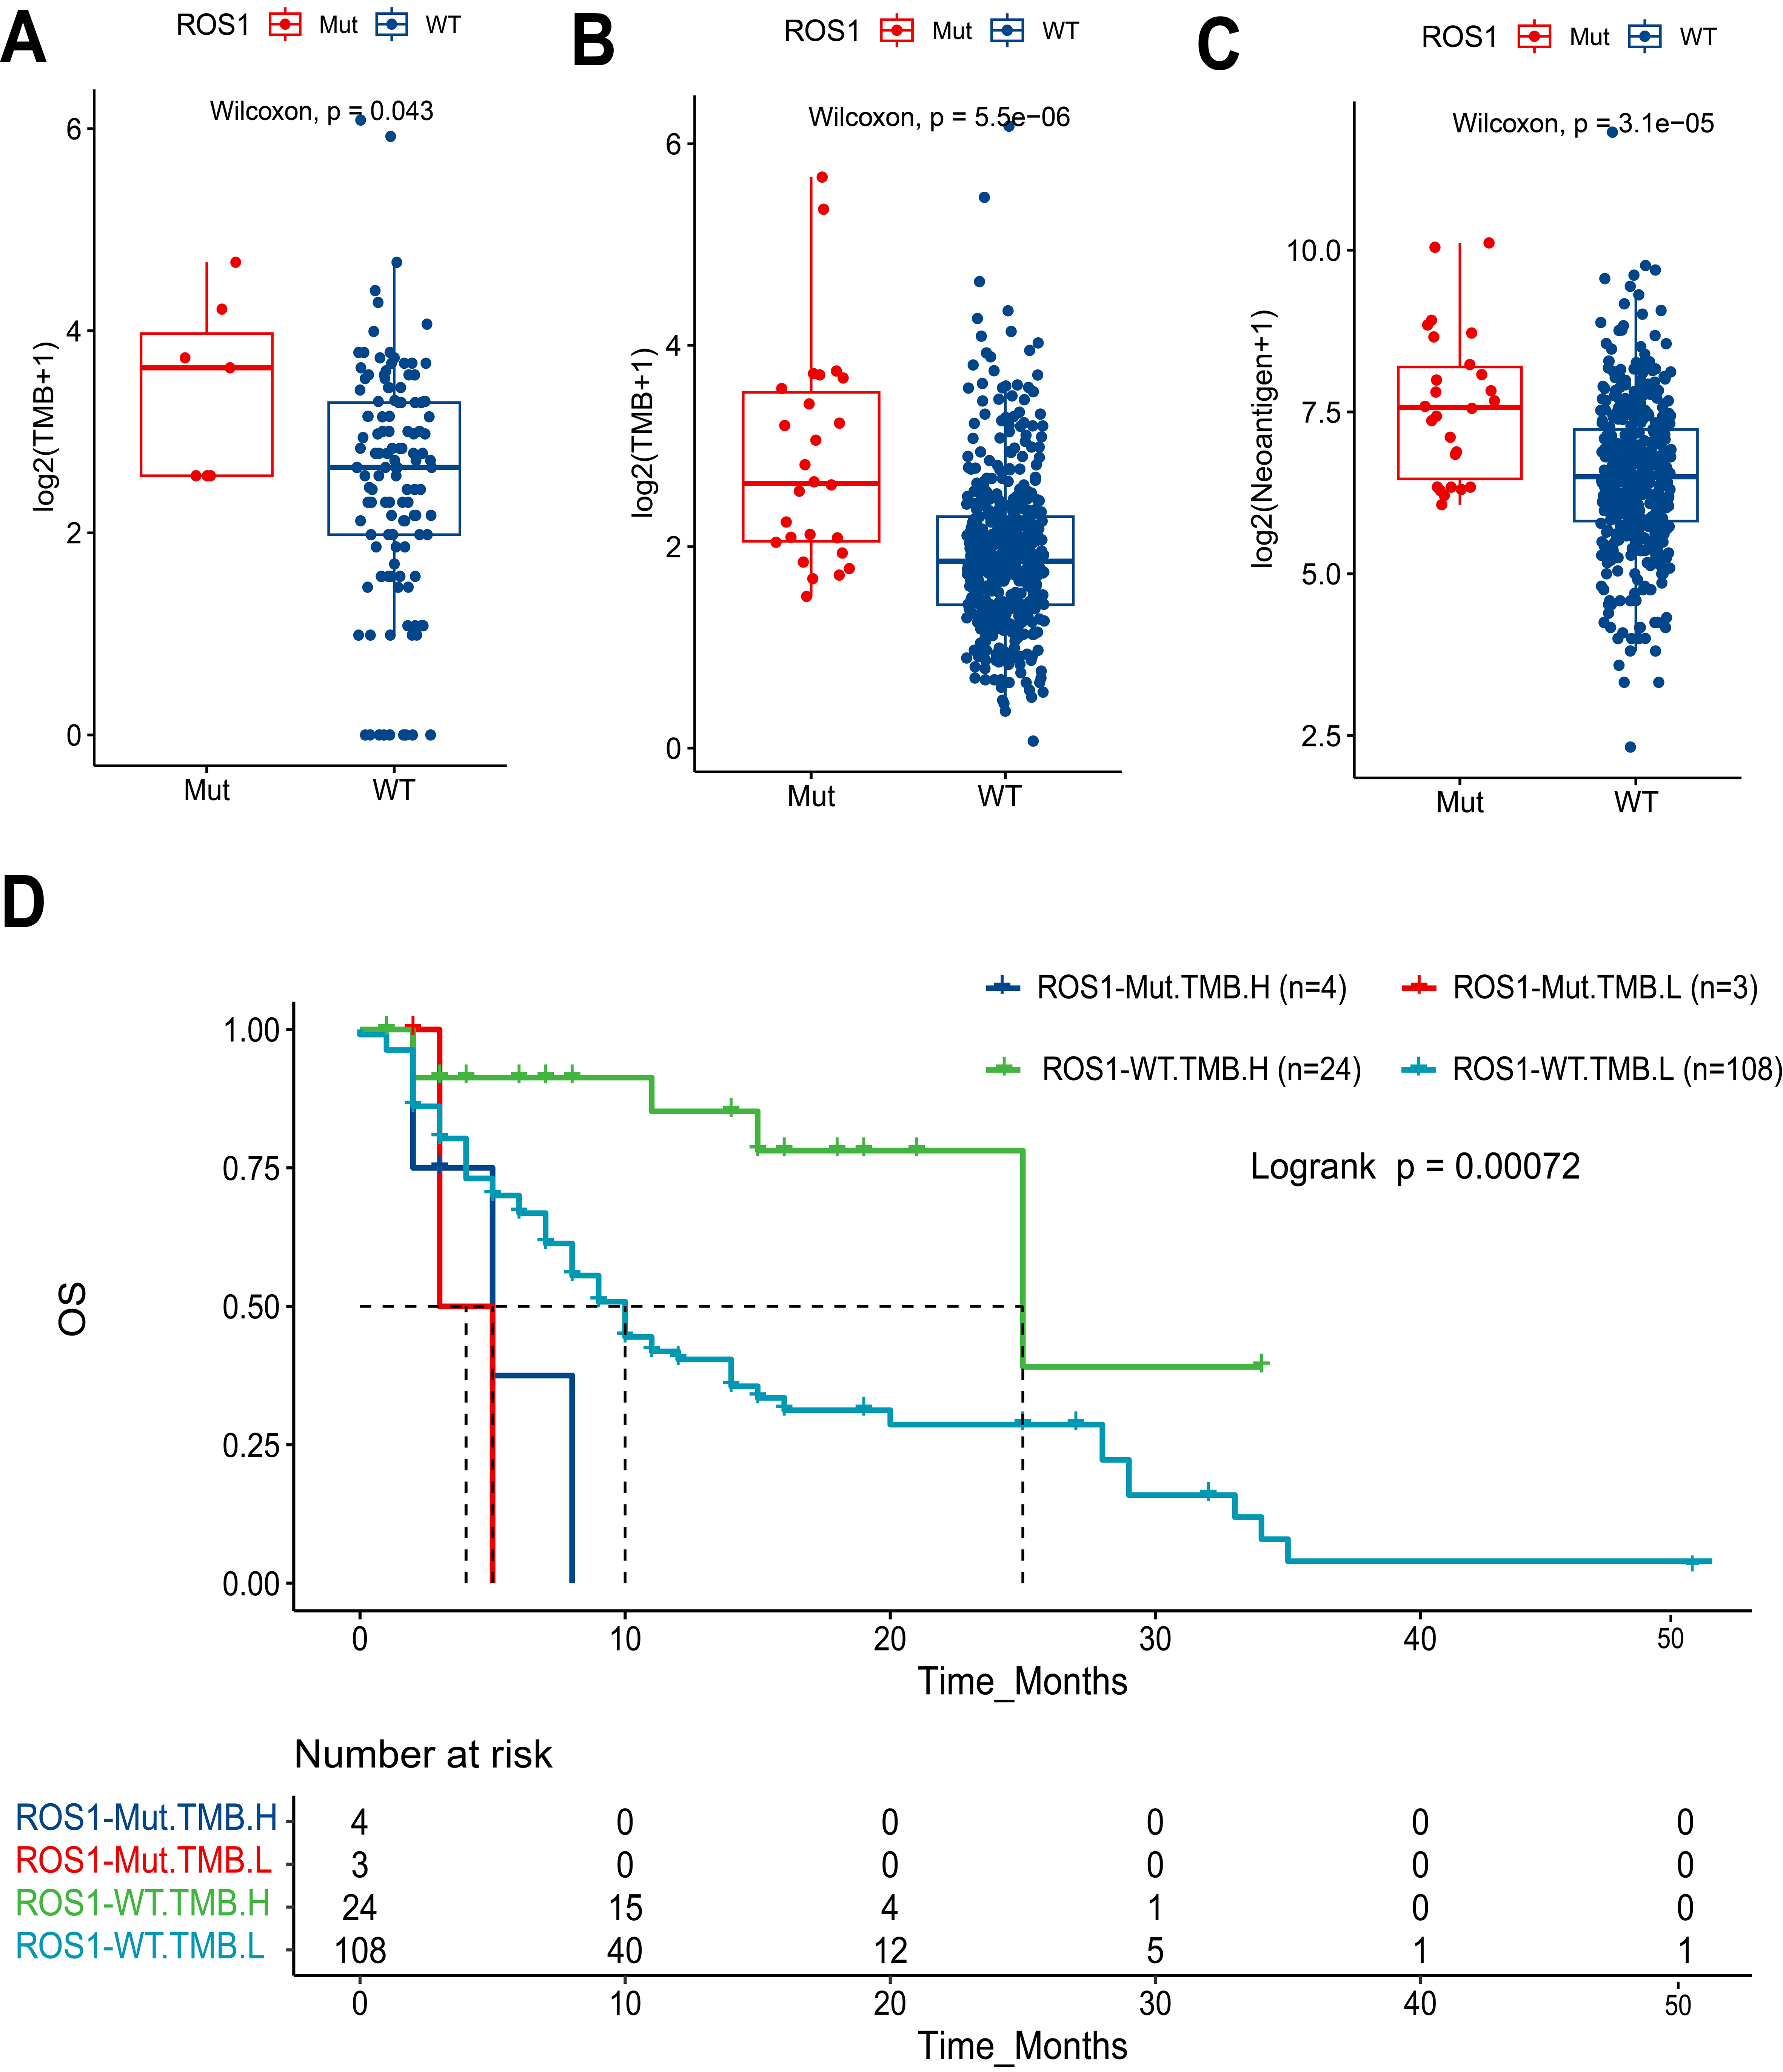
Figure 3. Association of ROS1 mutations with TMB, neoantigen levels, and patient survival in HNC. Boxplots comparing log2-transformed TMB between ROS1-Mut and ROS1-WT tumors in (A) MSKCC HNC cohort and (B) TCGA HNC cohort; (C) Boxplot comparing log2-transformed neoantigen levels in TCGA HNC tumors by ROS1 mutation status; (D) Kaplan-Meier analysis of OS stratified by ROS1 mutation status and TMB levels. TMB: Tumor mutational burden; HNC: head and neck cancer; ROS1-Mut: ROS1 mutations; ROS1-WT: ROS1-wild-type; TCGA: The Cancer Genome Atlas; OS: overall survival.


