


fig4
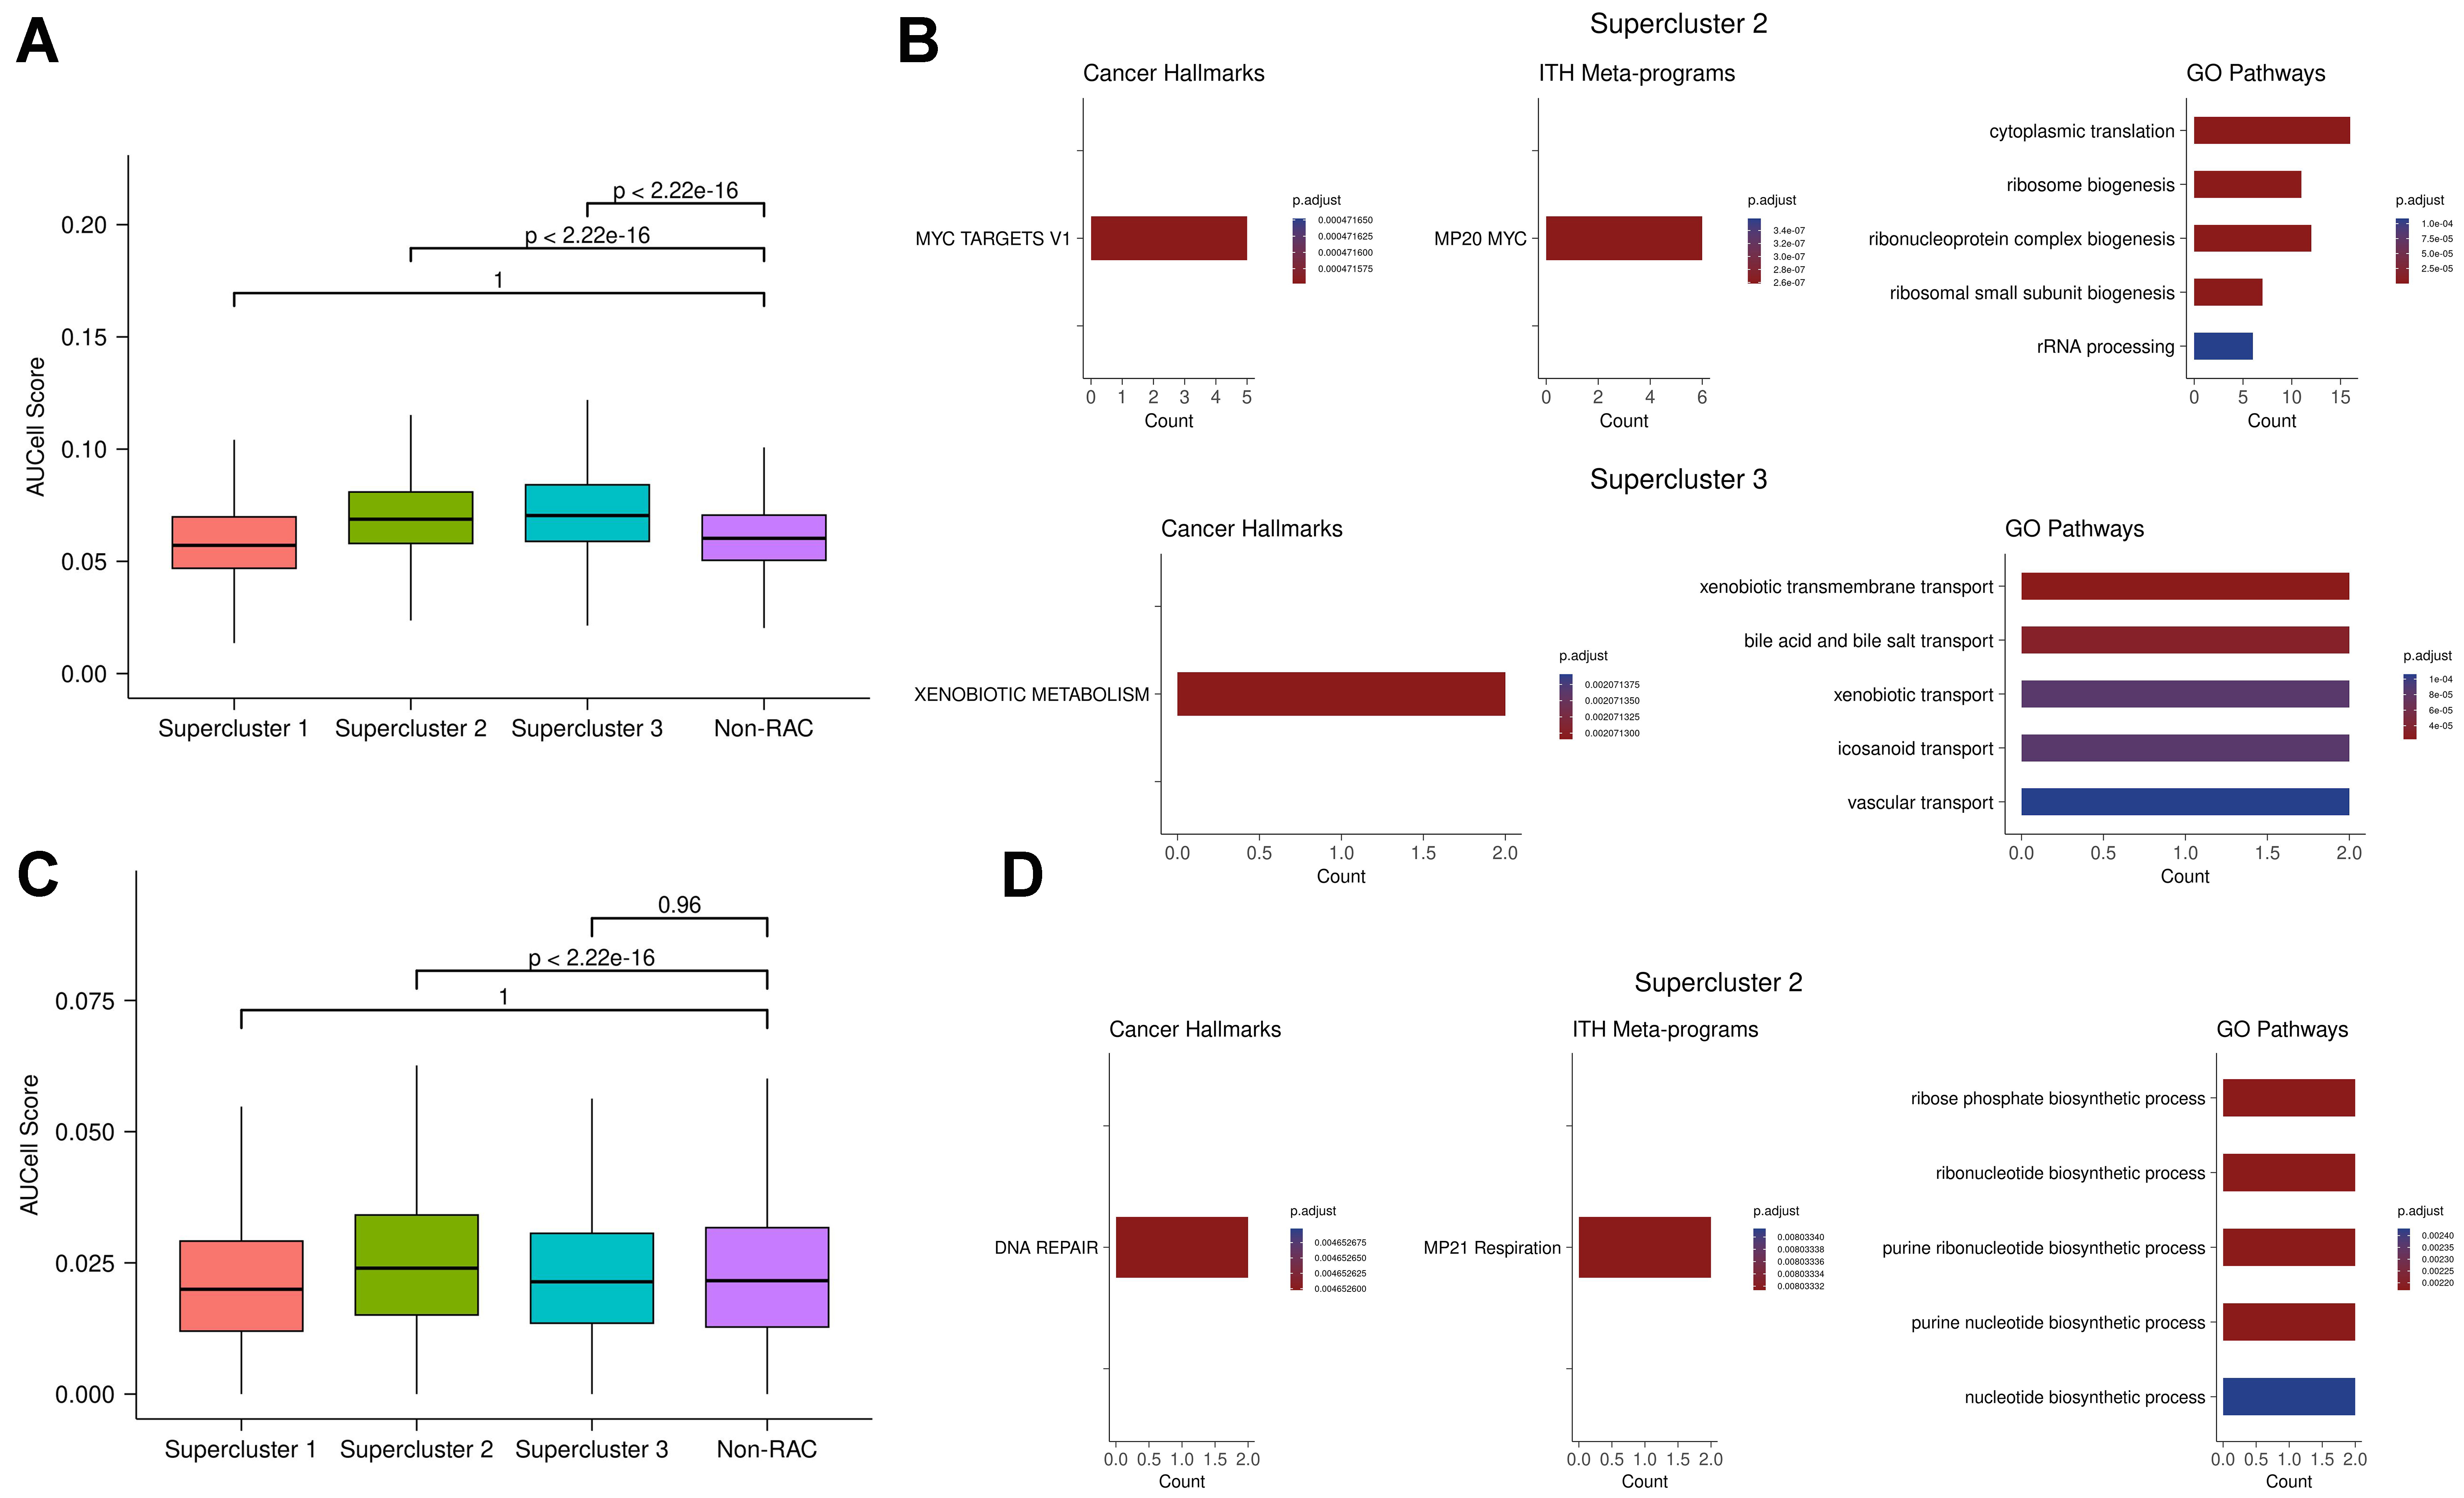
Figure 4. (A) C. auris antifungal resistance gene signature scores in human resistance and non-resistance clusters. Each distribution shows scores for individual cells in each supercluster or non-RAC cluster across three cell lines; (B) Pathway enrichment analysis of shared genes between C. auris resistance orthologs and superclusters 2 and 3. “Count” indicates the number of overlapping genes between the gene set of interest and the enriched pathway; (C) E. coli antimicrobial resistance gene signature scores in human resistance and non-resistance clusters. Each distribution shows scores for individual cells in each supercluster or non-RAC cluster across three cell lines; (D) Pathway enrichment analysis of shared genes between E. coli resistance orthologs and supercluster 3. RAC: Resistance-activated cluster.


