


fig3
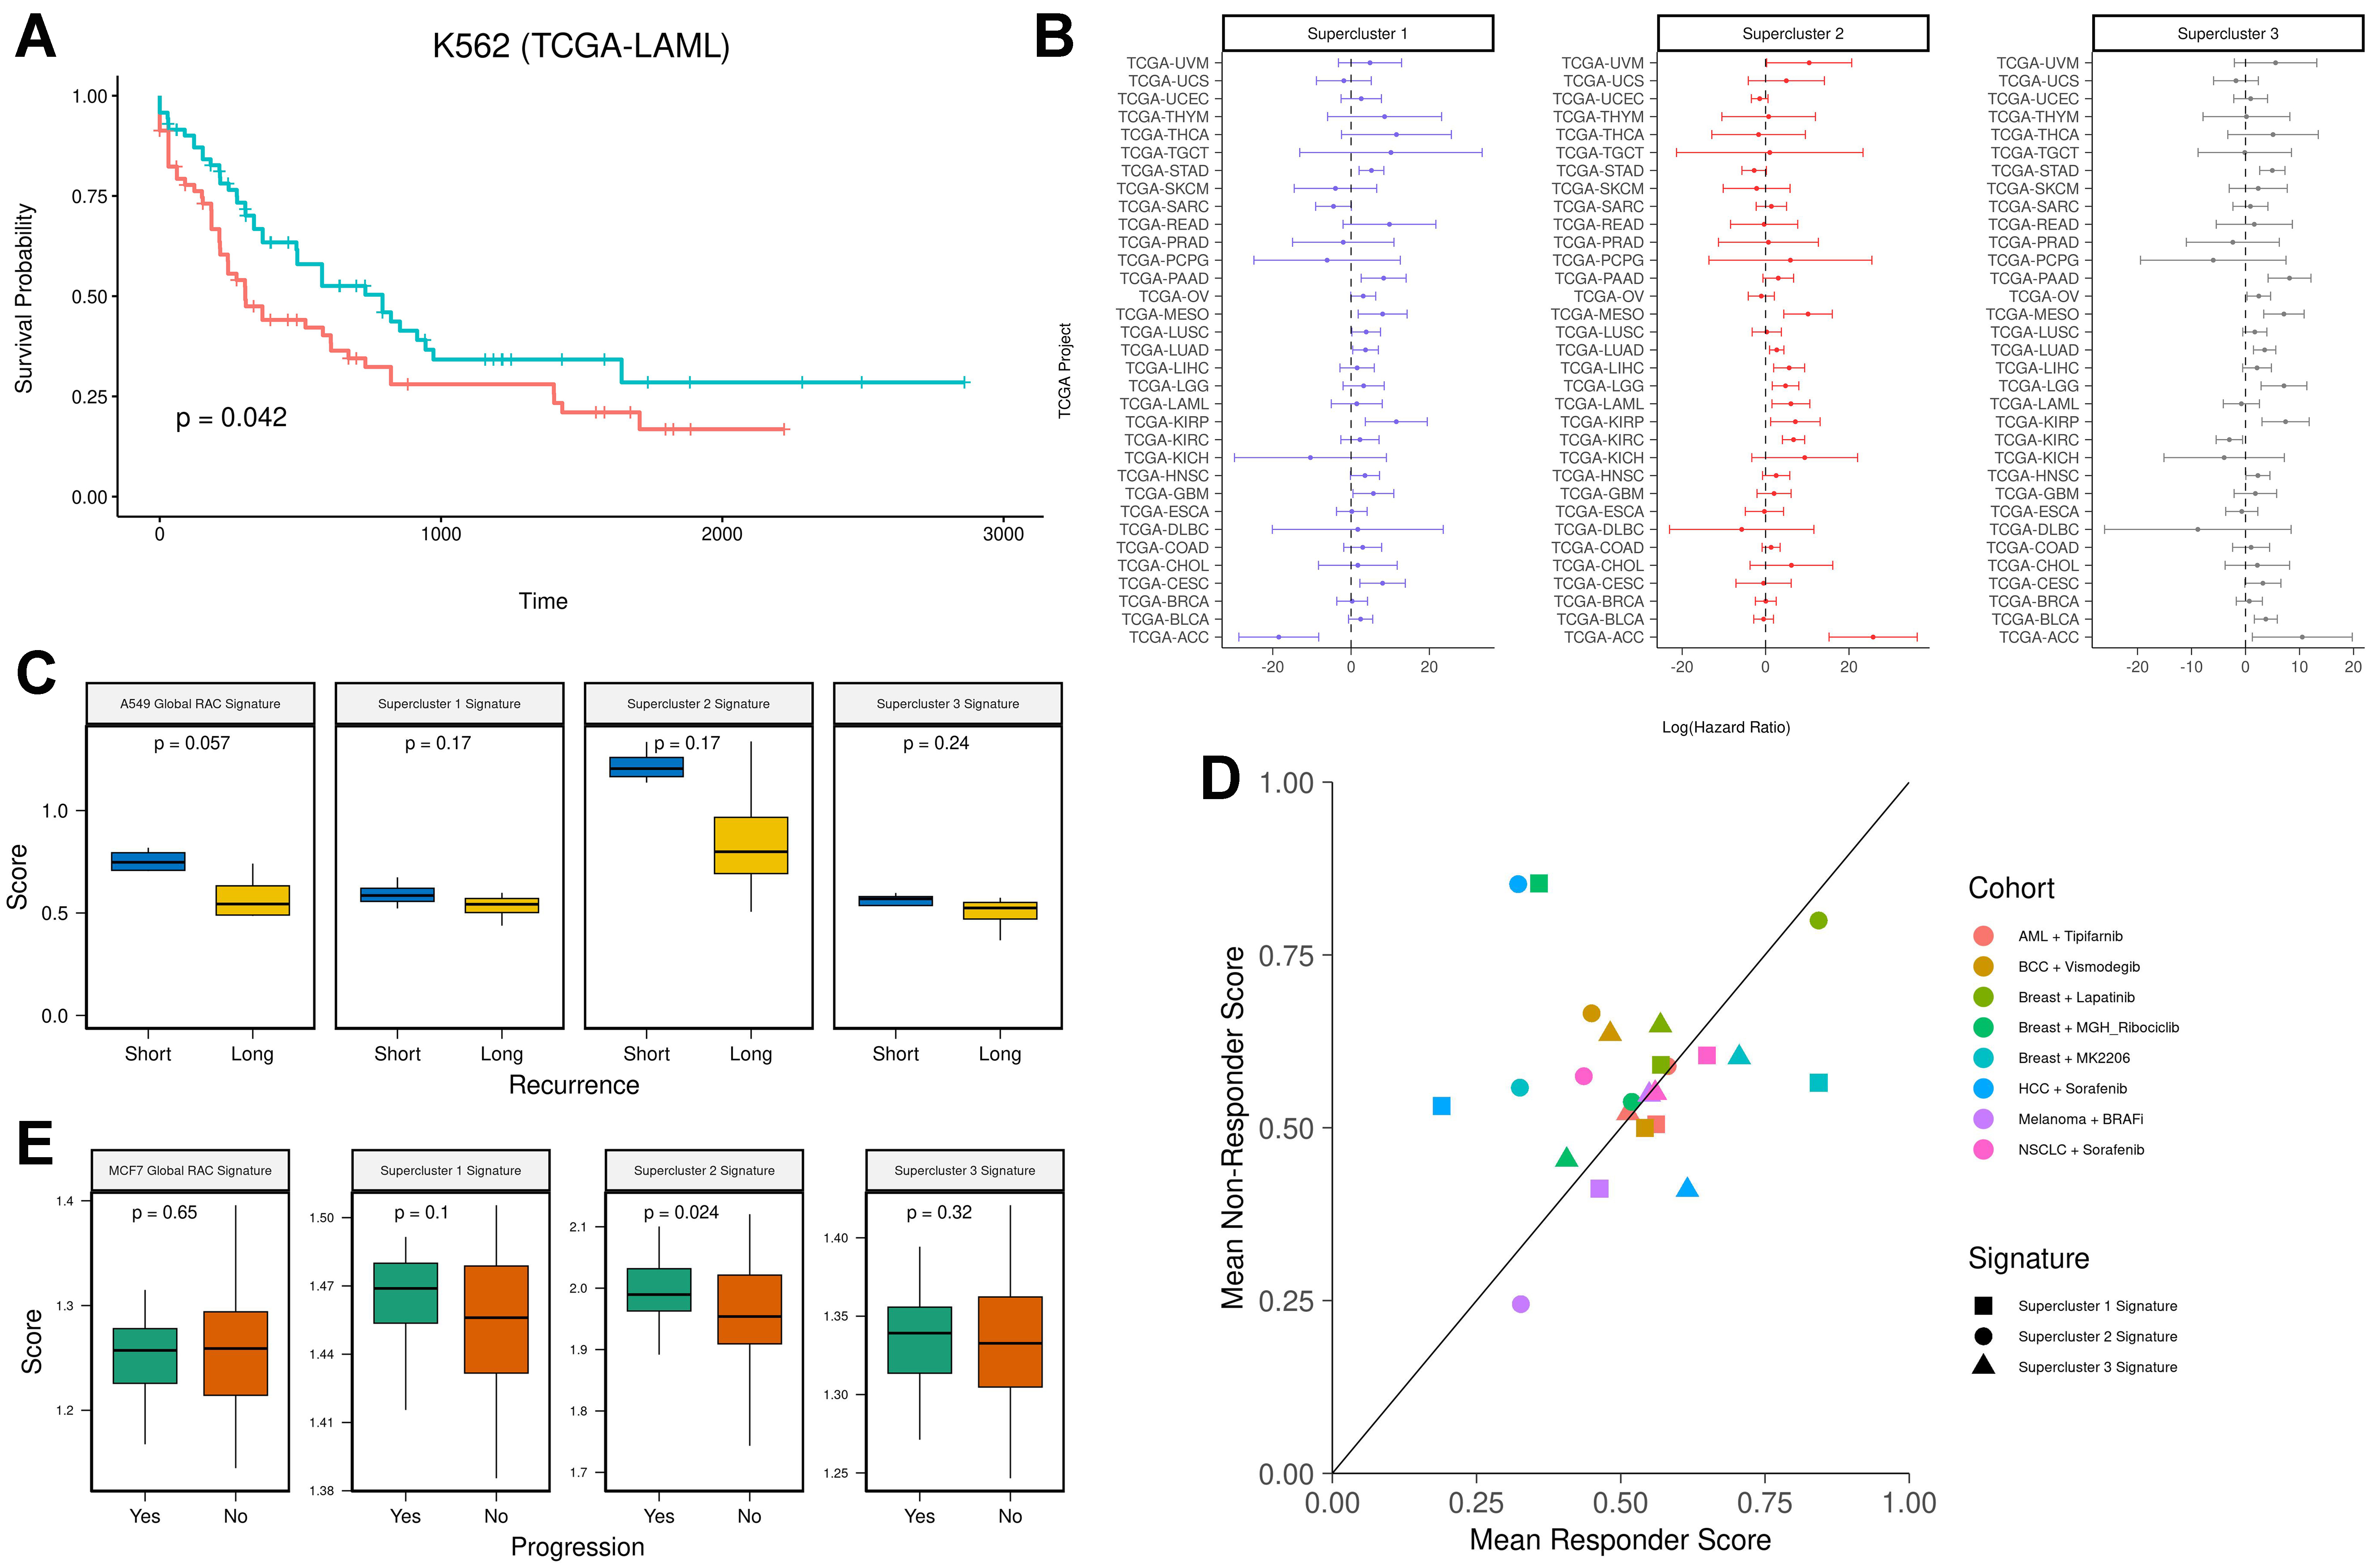
Figure 3. (A) Kaplan-Meier survival analysis of the K562 RAC signature in the LAML cohort. Patients were stratified into two groups based on K562 RAC signature scores (red = high, blue = low); (B) Hazard ratios with 95% confidence intervals for supercluster signatures across all 33 TCGA cancer types; (C) Pre-treatment RAC signature scores in lung cancer patients prior to tyrosine kinase inhibitor treatment. The Y-axis shows ssGSEA scores, and the X-axis stratifies patients by recurrence time (blue = short-term recurrence; yellow = long-term recurrence); (D) Mean supercluster signature scores for responders and non-responders across various treatment cohorts (cohort = drug × cancer type); (E) RAC signature scores in premalignant lesions. The Y-axis represents ssGSEA scores, and the X-axis stratifies patients by progression status (green = progression; orange = no progression). RAC: Resistance-activated cluster.


