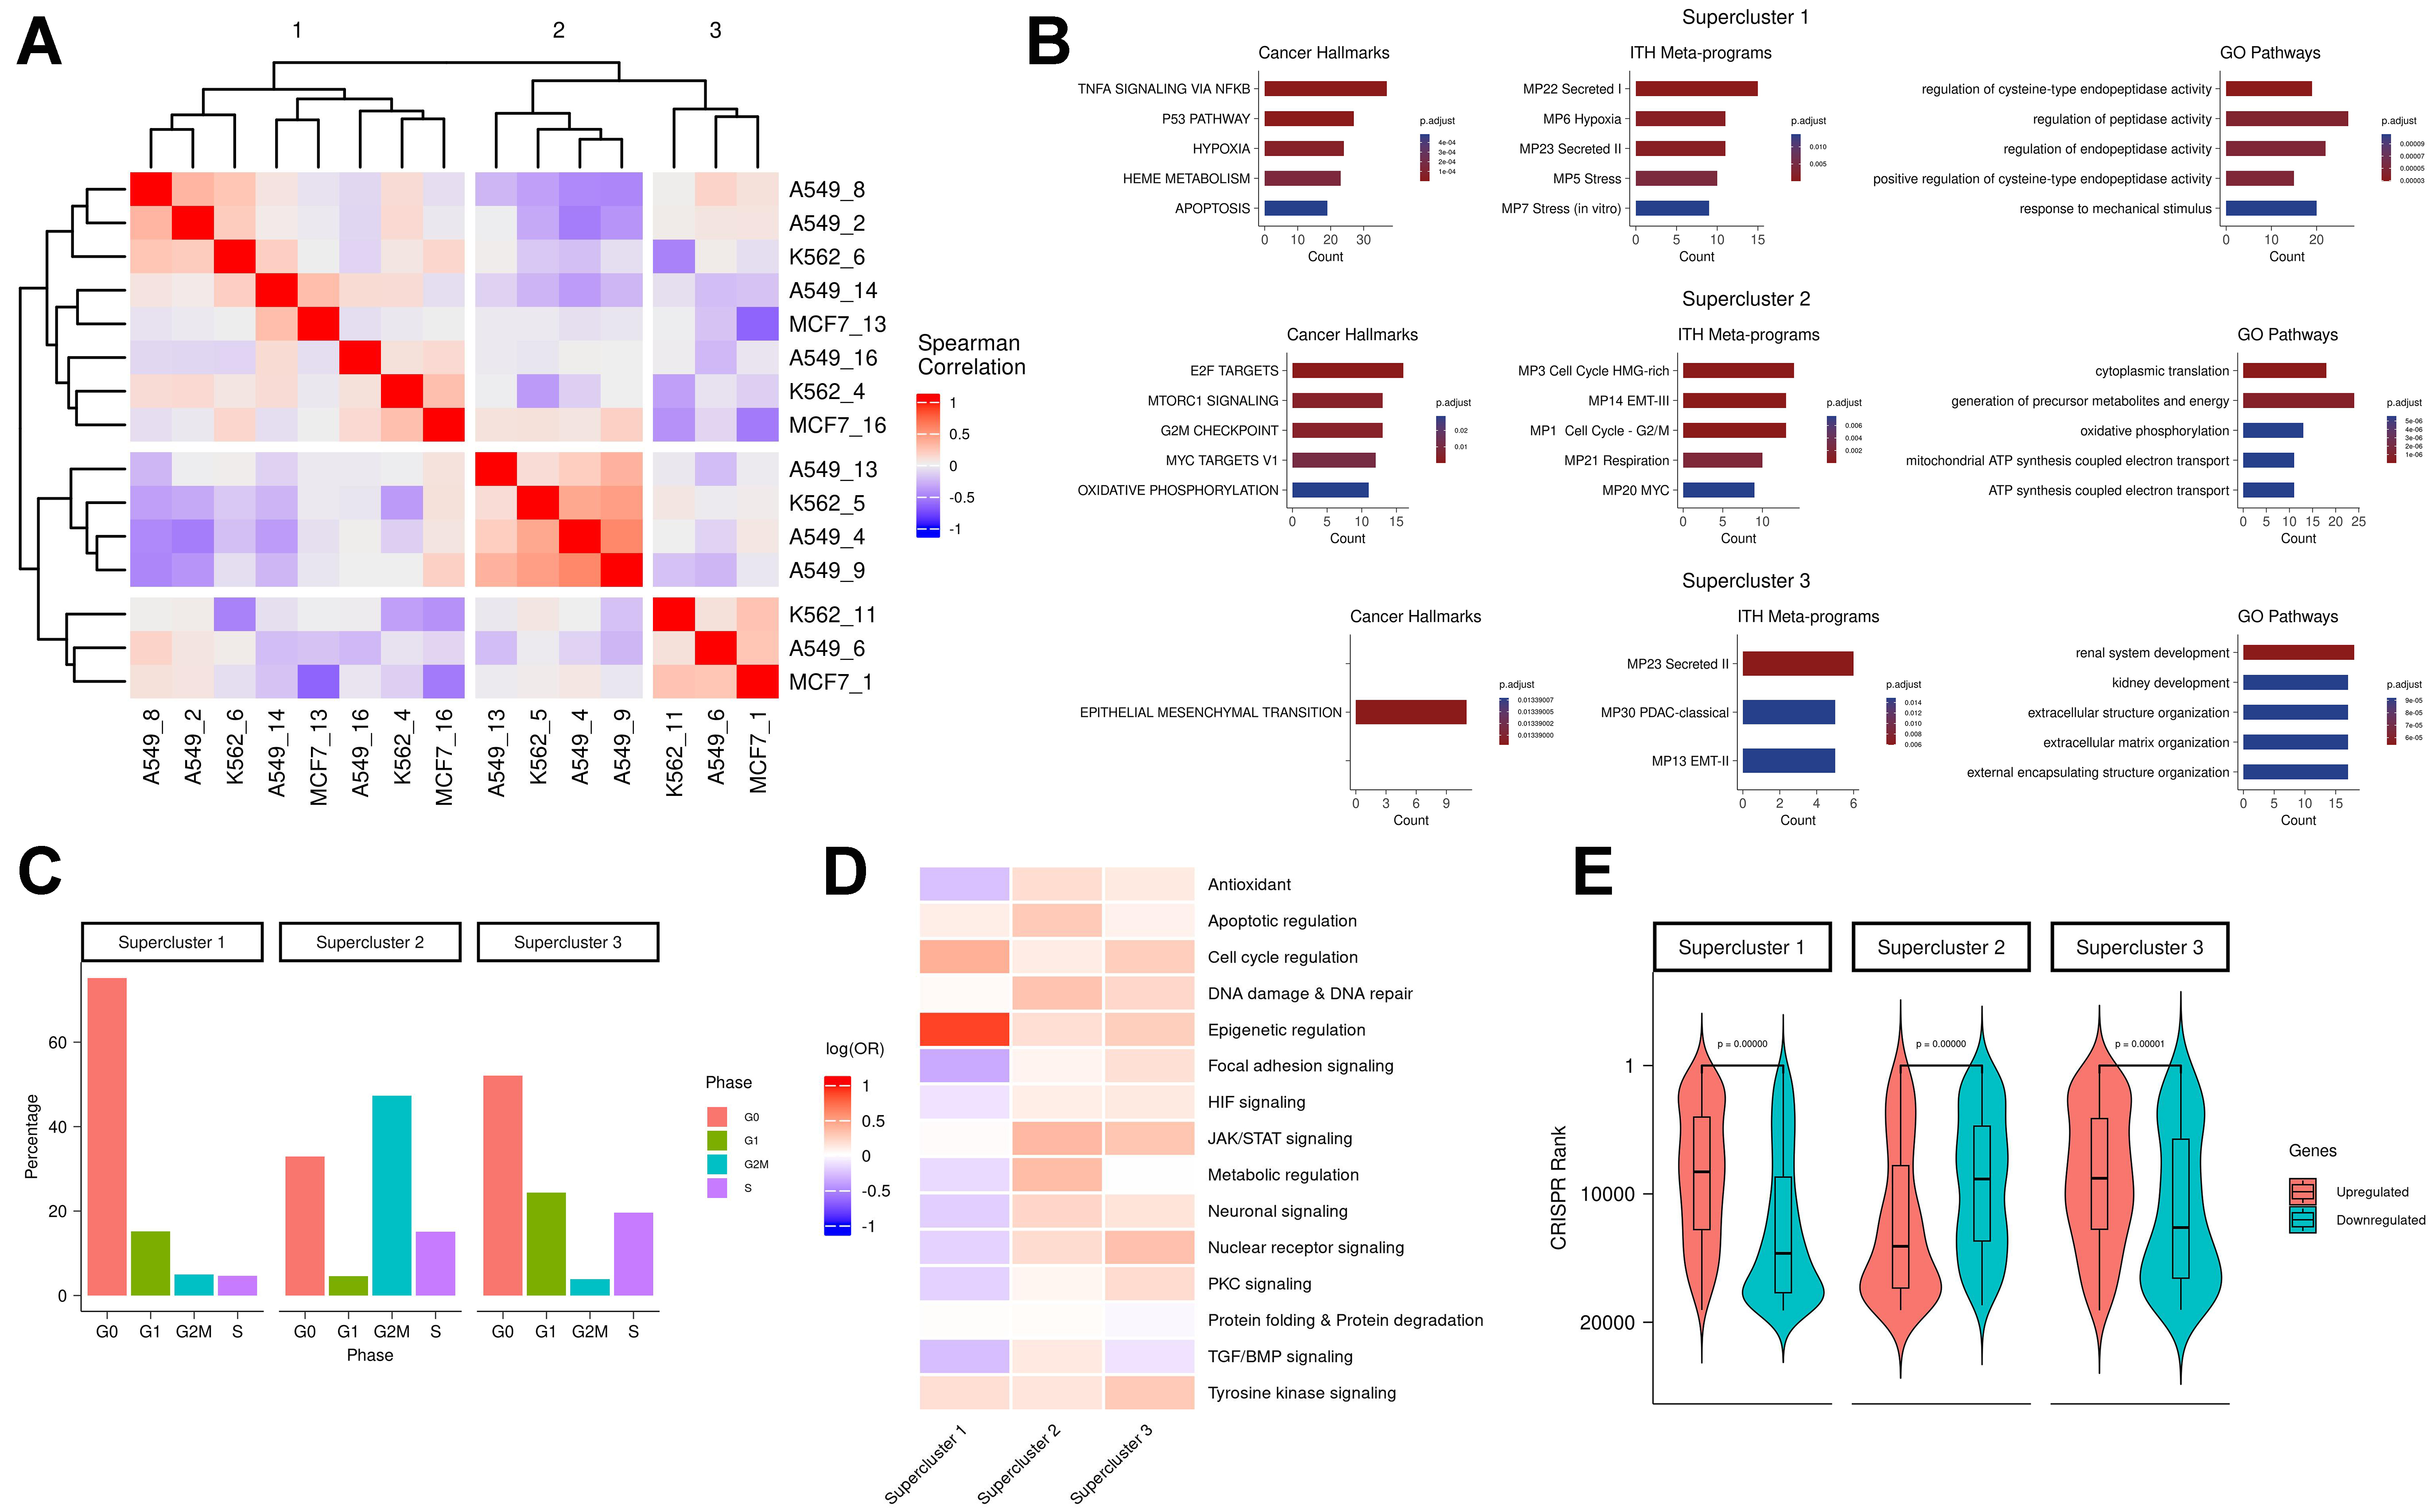
fig2
Figure 2. (A) All-by-all Spearman correlation matrix of RAC differential mean expression vectors; (B) Functional enrichment of supercluster signatures. Columns from left to right show enrichment in cancer hallmarks, ITH MPs, and GO pathways, respectively. Rows represent the three superclusters. Count values indicate the number of overlapping genes between the supercluster signature and the enriched pathway; (C) Distribution of cell cycle phase percentages for each supercluster (G0 = red; G1 = green; G2M = blue; S = purple); (D) Drug class enrichment for each supercluster; (E) CRISPR rank distributions (Y-axis) for upregulated (red) and downregulated (blue) genes in each supercluster. RAC: Resistance-activated cluster; ITH MPs: intratumoral heterogeneity meta-programs; GO: Gene Ontology.


