


fig1
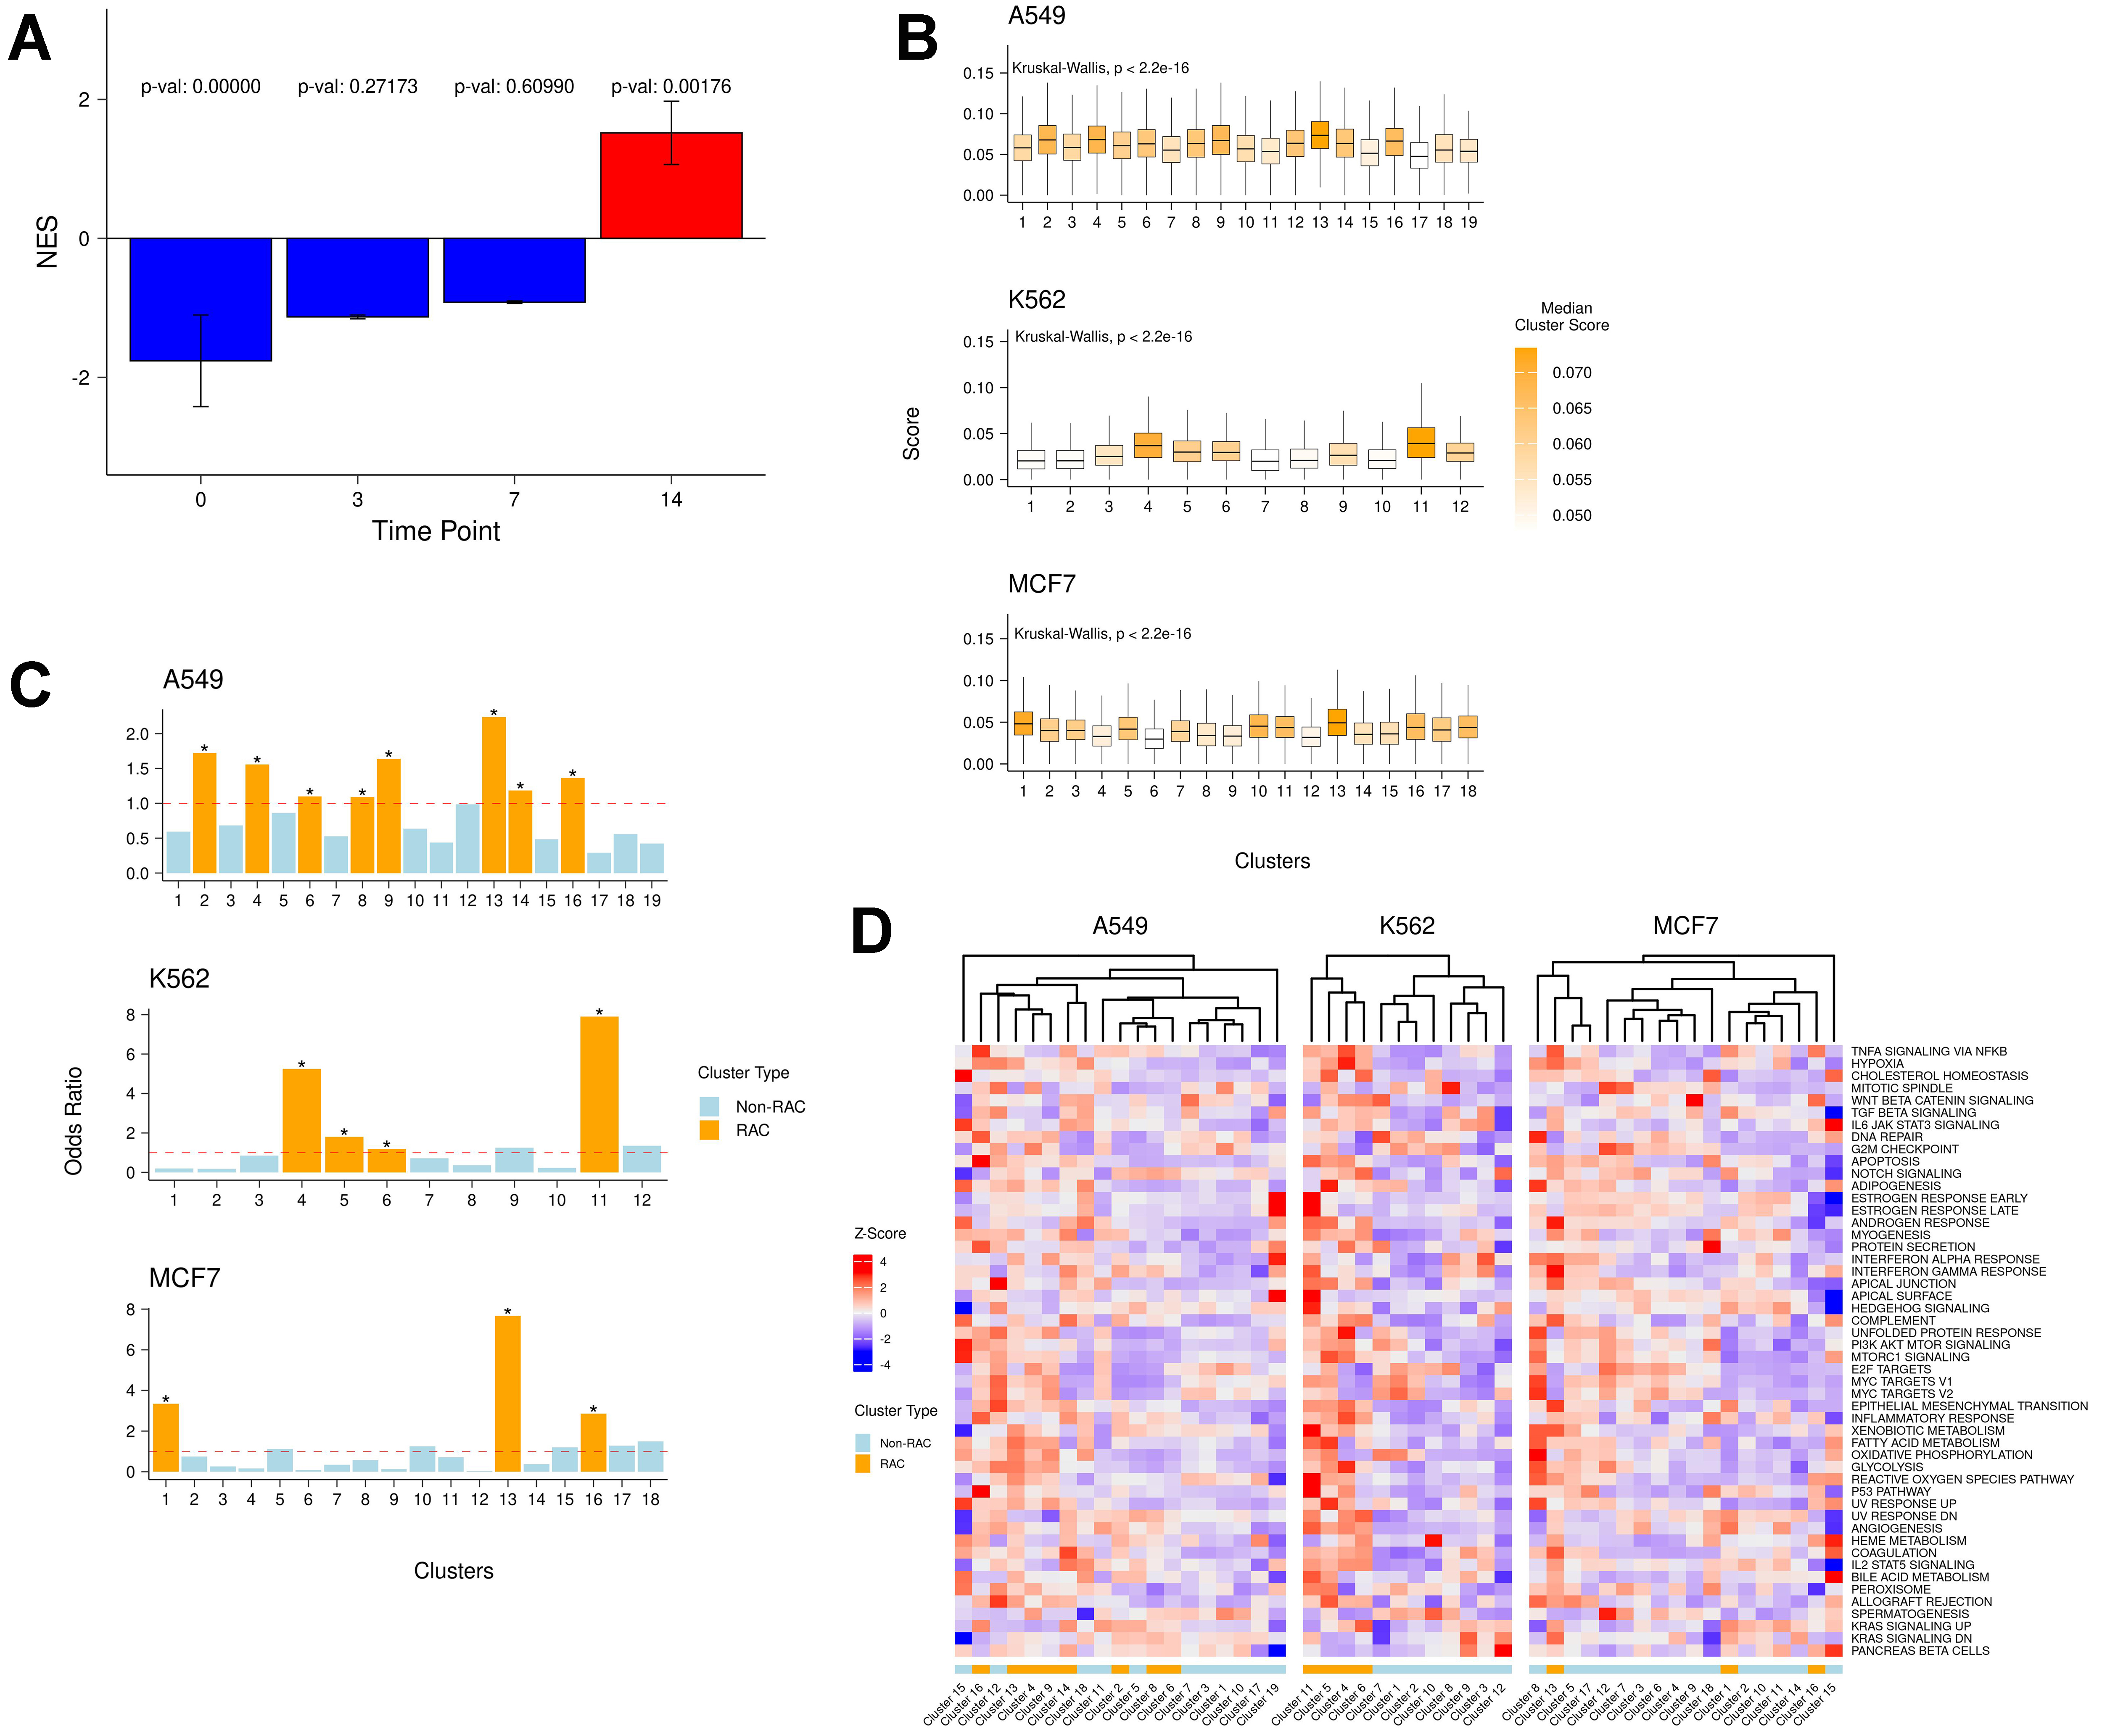
Figure 1. (A) Enrichment of the derived drug resistance signature gene at days 0, 3, 7, and 14 in the Oren et al. dataset[9]; (B) Distributions of raw AUCell scores of the resistance signature in each cluster across all cell lines; (C) Enrichment odds ratio of resistance-active cells in each cluster. Asterisks indicate significant odds ratio values (P < 0.05); (D) Standardized (z-score) mean AUCell scores of cancer hallmark pathways in each cluster across all cell lines. NES: Normalized Enrichment Score.


