


fig8
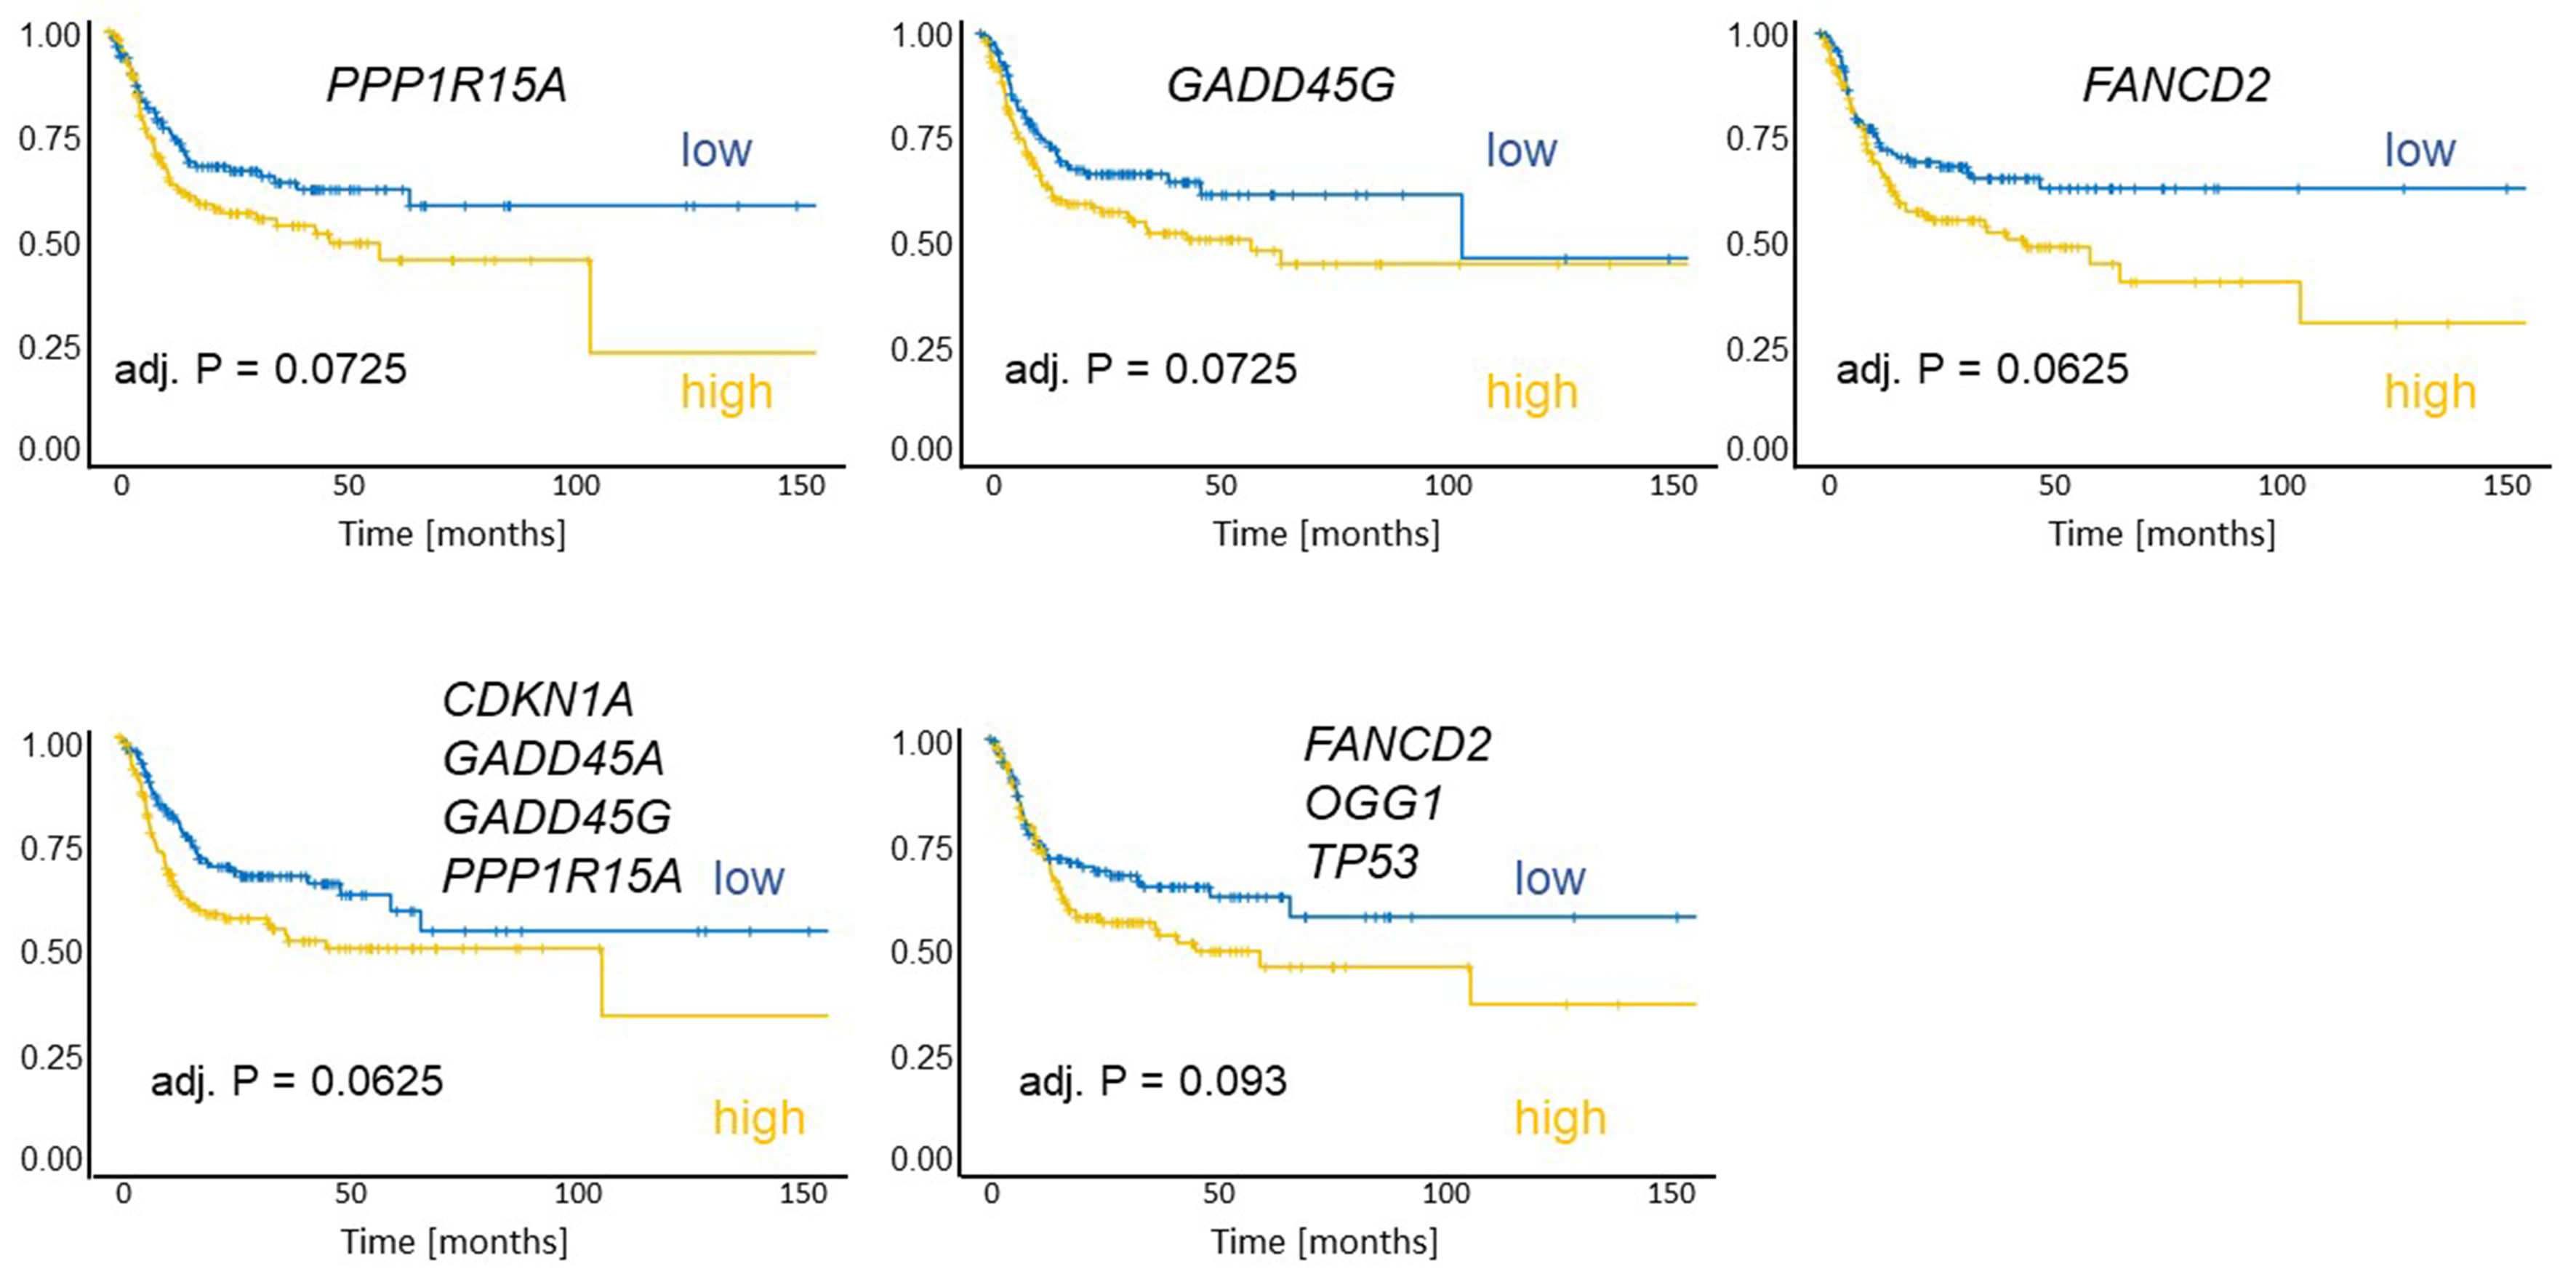
Figure 8. Kaplan-Meier plots of recurrence-free survival were generated for 292 patients. Patients were grouped according to the expression of individual genes (PP1R15A, GADD45G, FANCD2), the in vitro treatment-induced signature (mean of: CDKN1A, GADD45A, GADD45G, PP1R15A), and the baseline-high signature (mean of: FANCD2, OGG1, TP53). High expression of these genes or signatures was associated with worse outcomes. Each group comprised 146 patients.


