


fig7
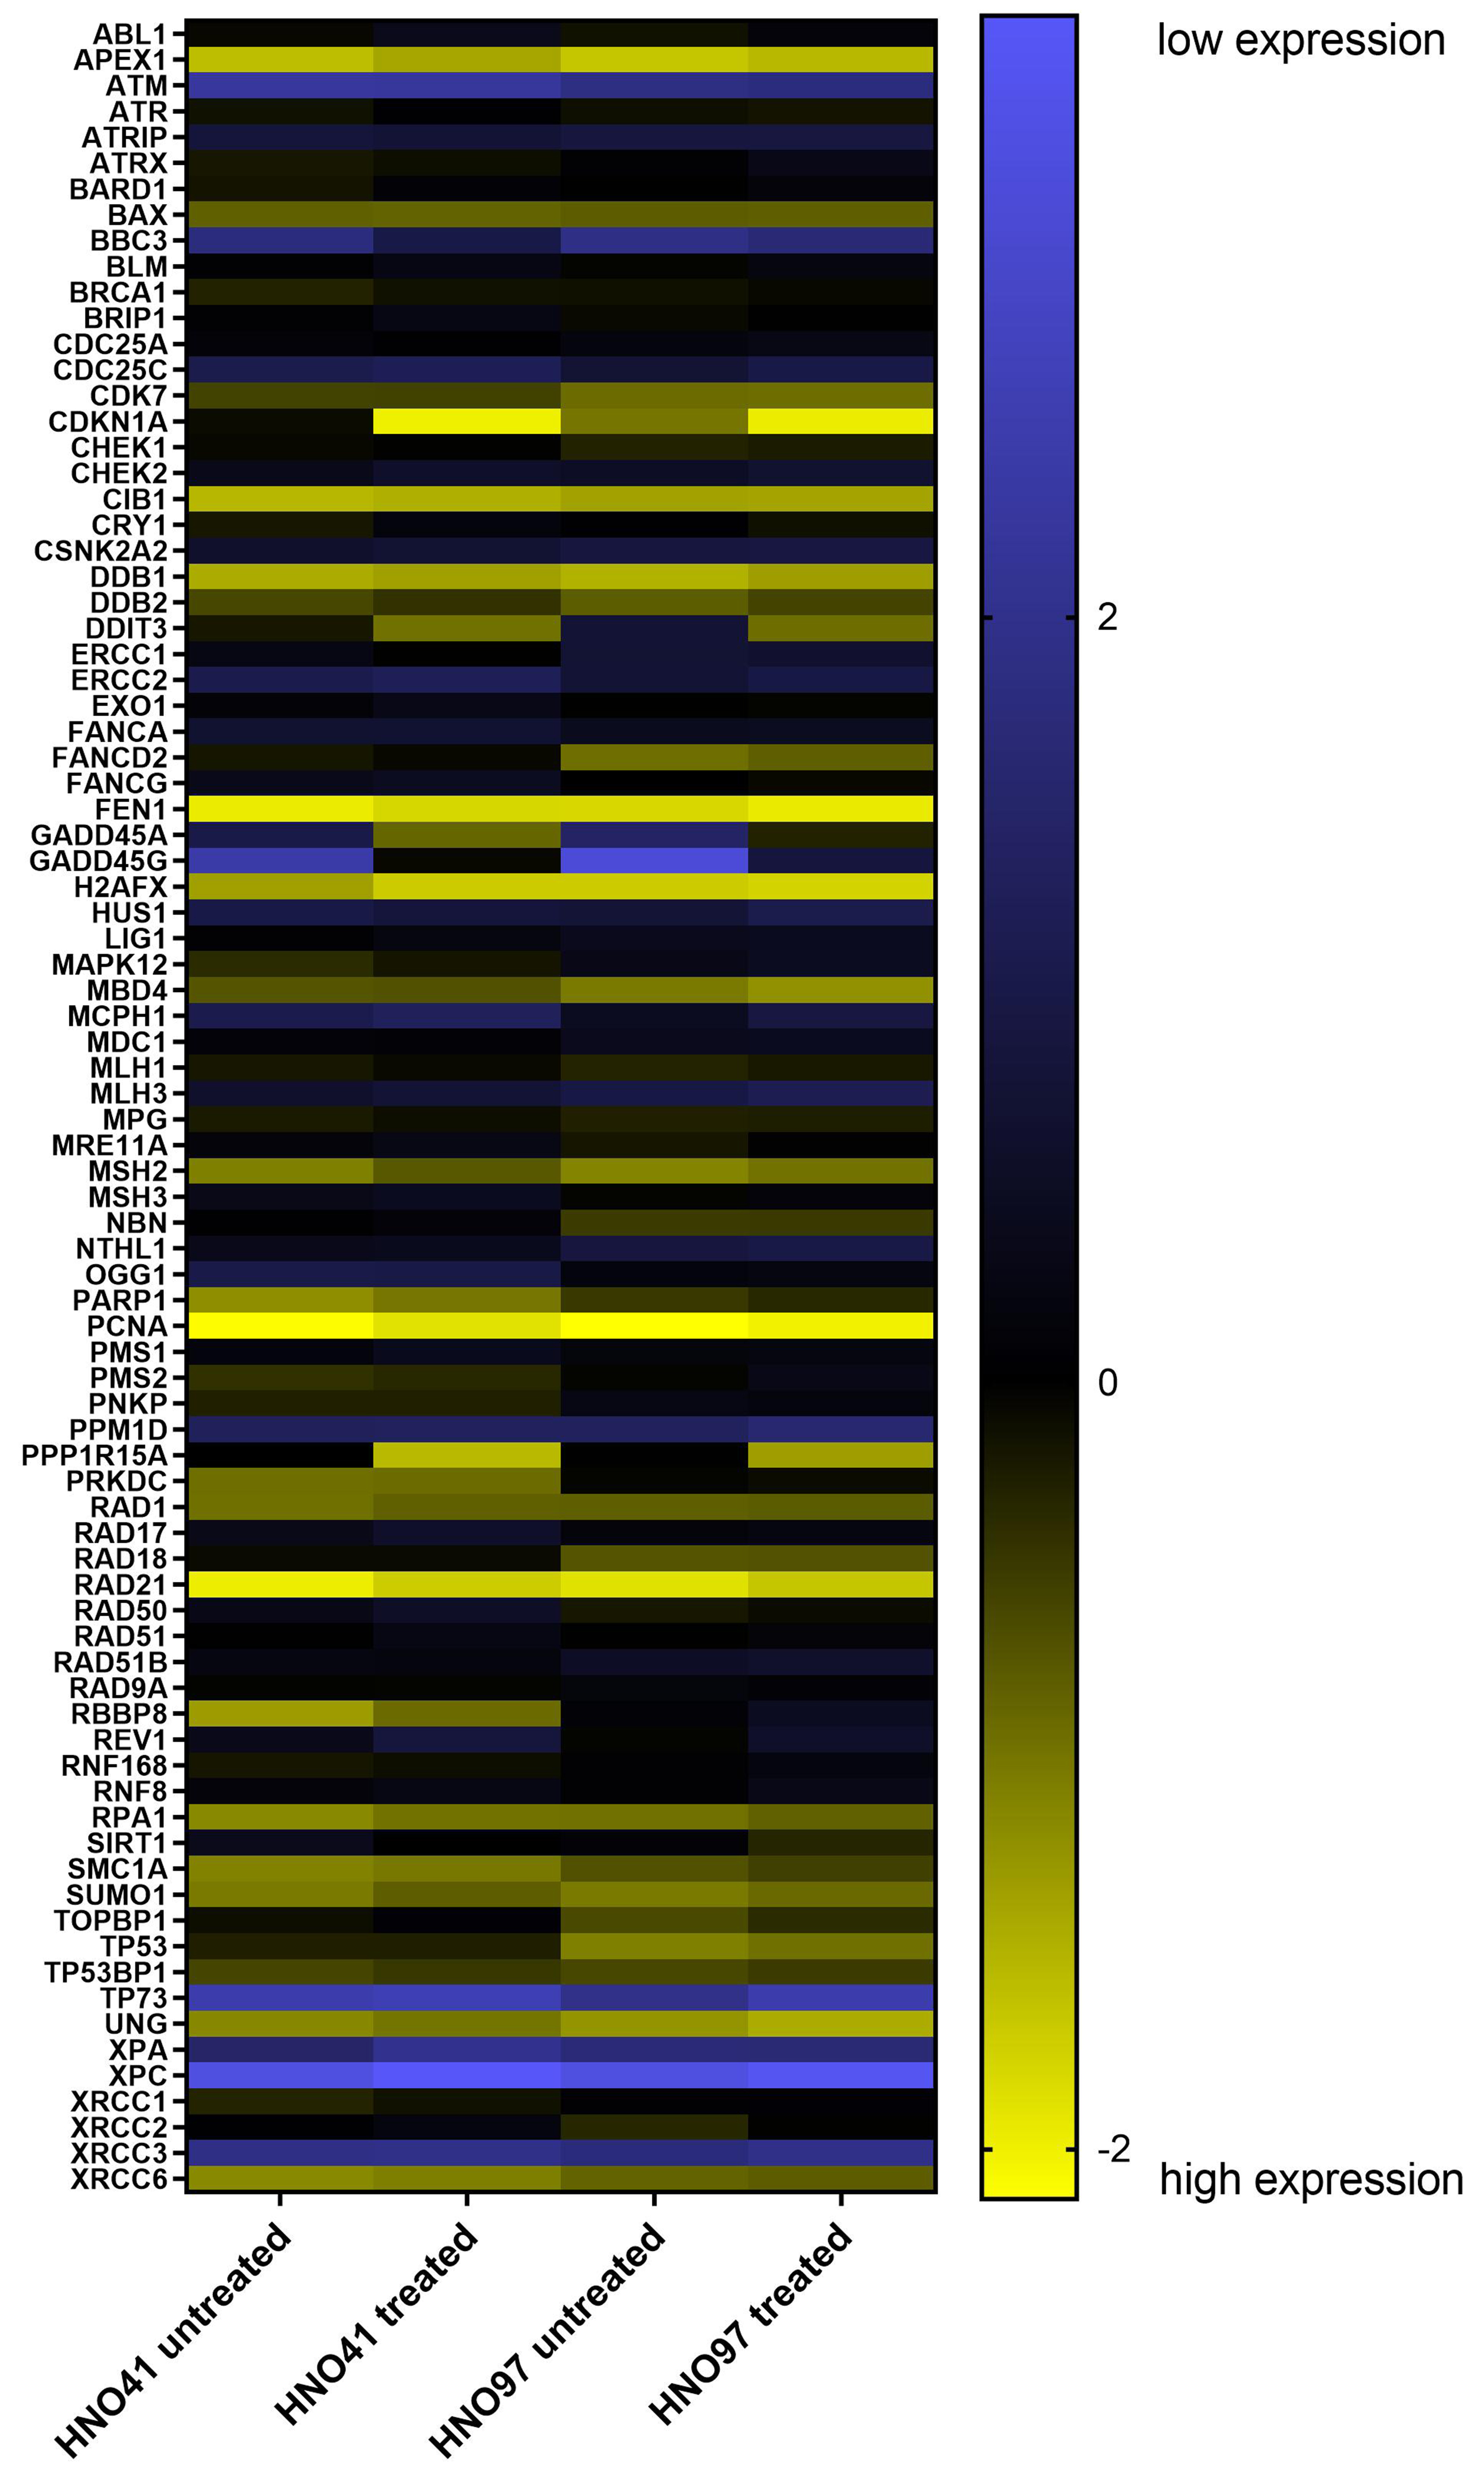
Figure 7. Heat map visualization of mRNA expression levels in untreated and treated HNO41 and HNO97 cells. Mean expression values from three independent replicates were Z-transformed and color-coded, with yellow indicating high expression and blue indicating low expression.


