


fig6
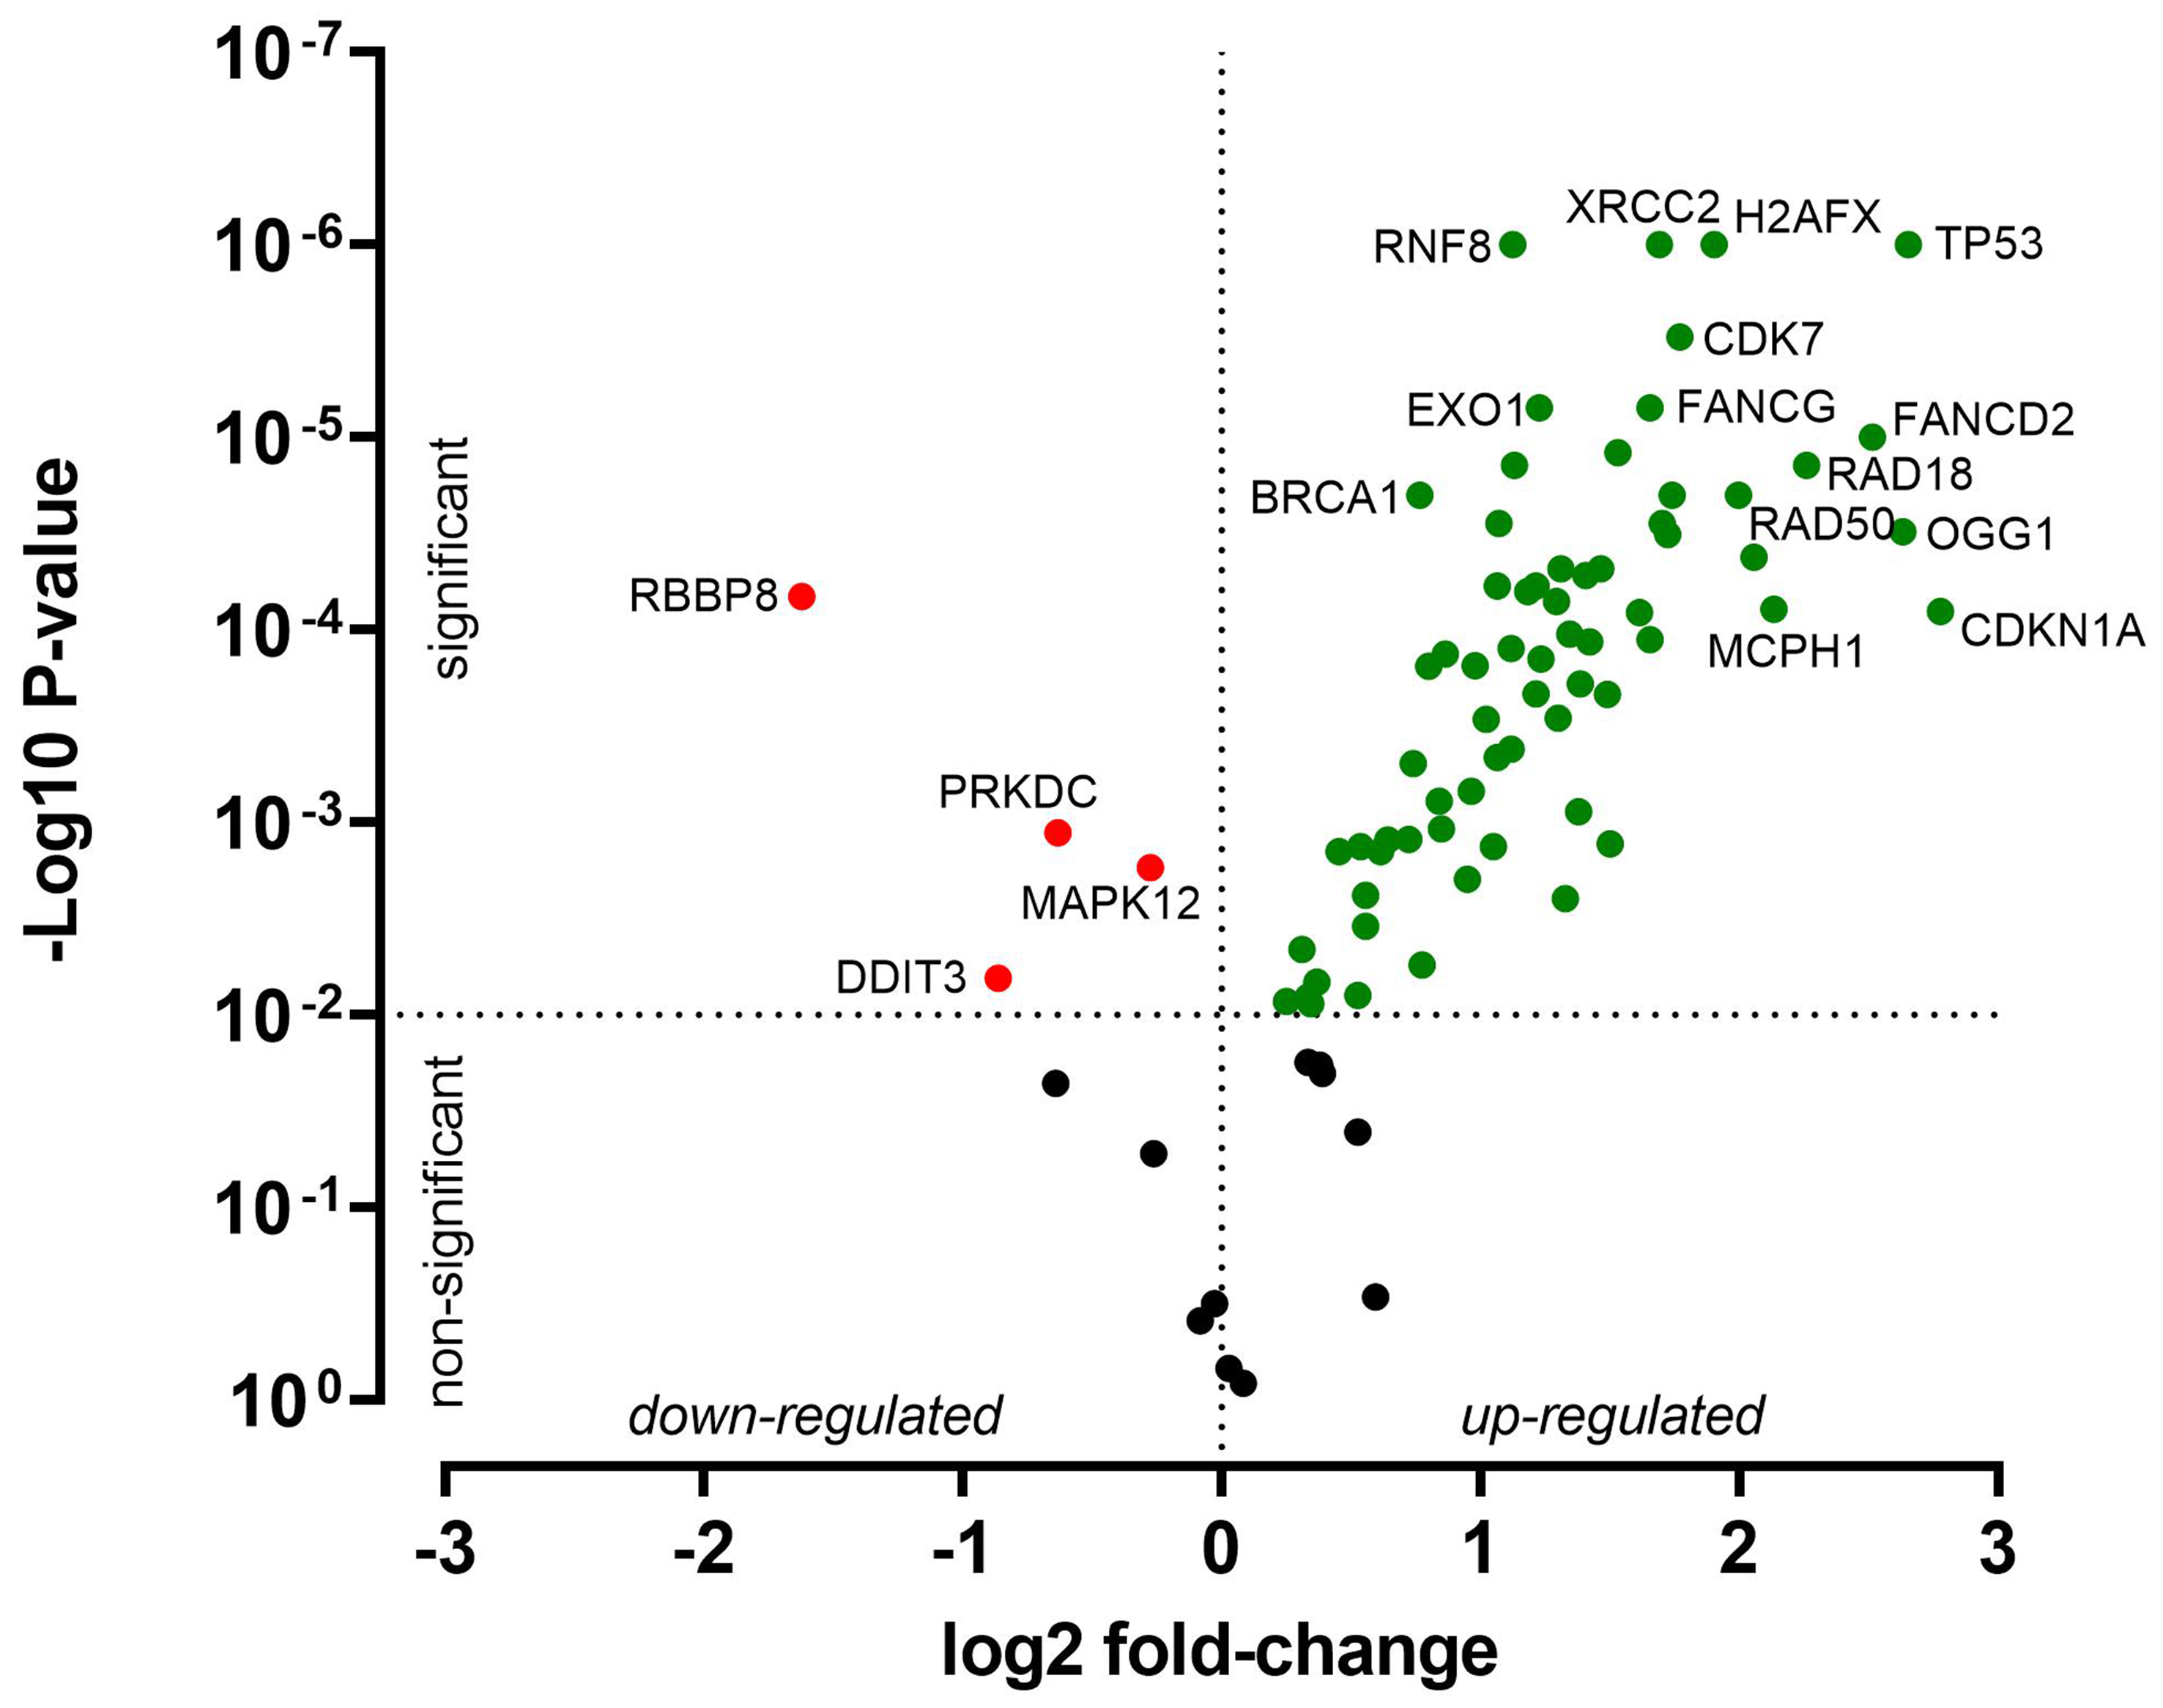
Figure 6. Relative baseline gene expression differences between HNO97 cells (three independent biological replicates) and HNO41 cells (three independent biological replicates). Genes significantly upregulated in HNO97 compared with HNO41 are highlighted in green, significantly downregulated genes are highlighted in red, and genes with no significant difference (P > 0.01) are shown in black.


