


fig3
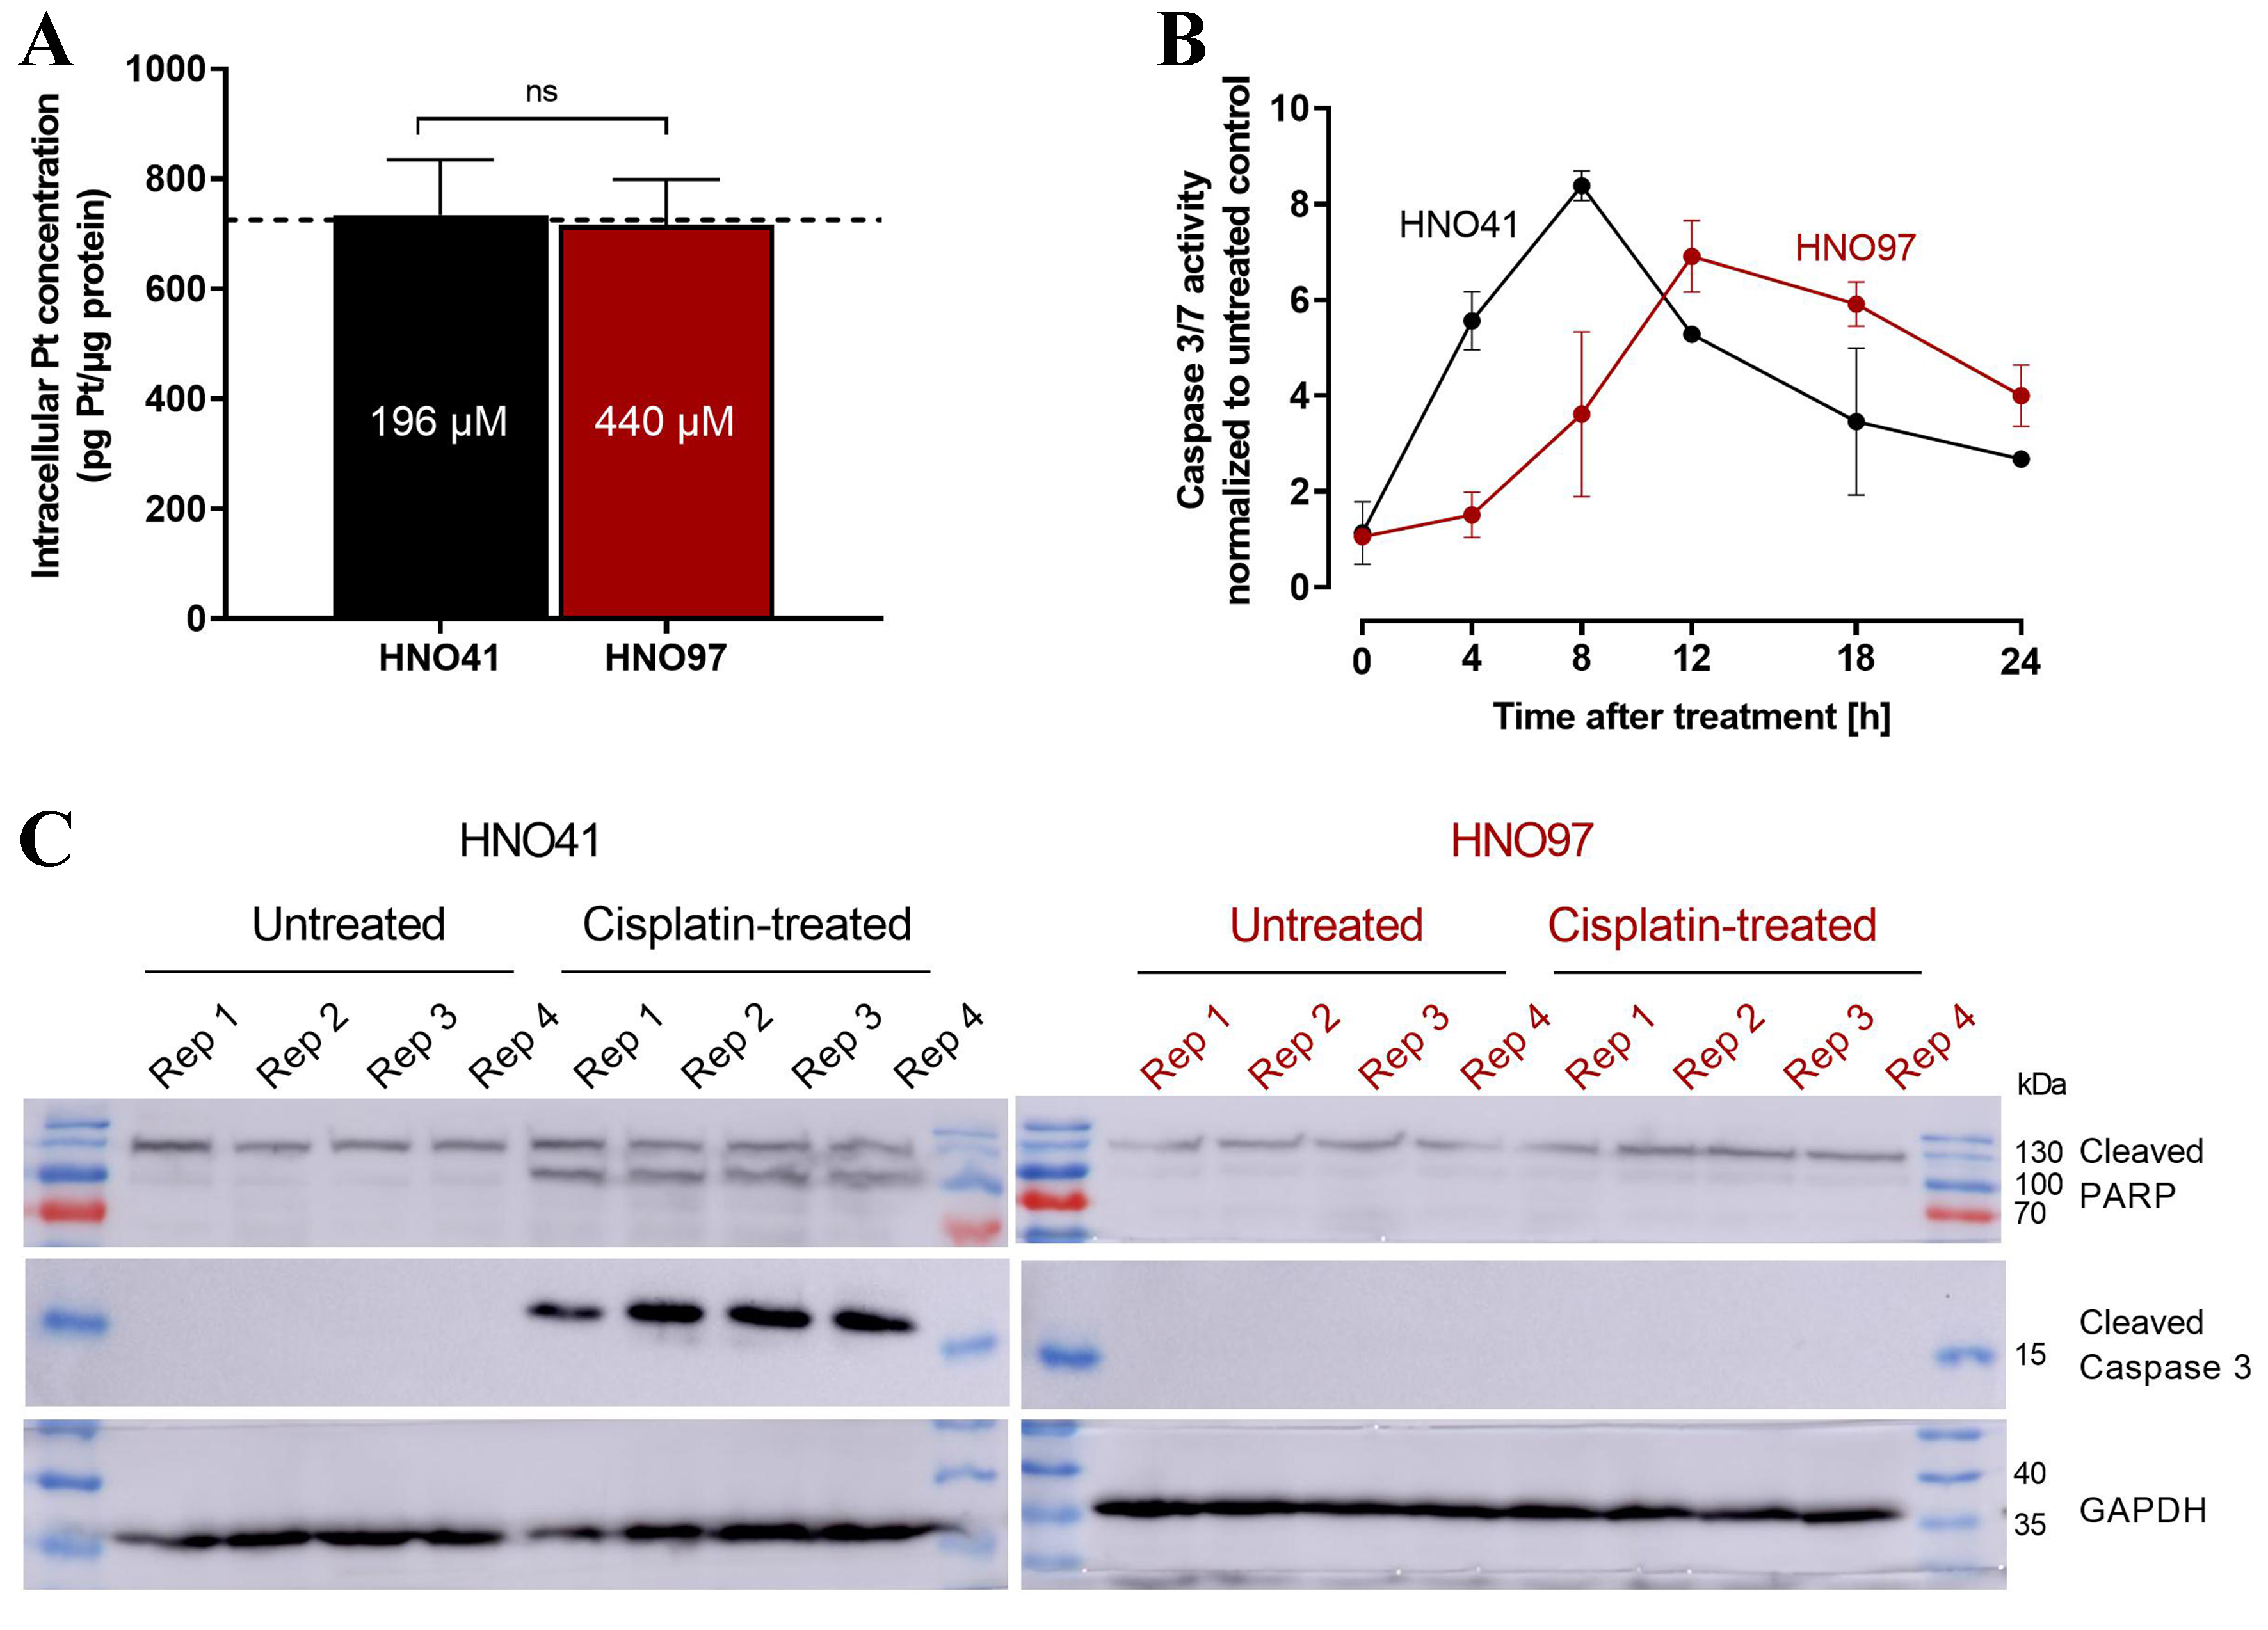
Figure 3. (A) Validation of similar total intracellular platinum concentrations (725 pg Pt/µg protein; dotted line) after exposure of HNO41 (black) to 196 µM cisplatin and HNO97 (dark red) to 440 µM cisplatin. Data represent mean ± SD of four independent biological replicates. Statistical significance was evaluated by the non-parametric Mann-Whitney test; ns: not significant; (B) Caspase 3/7 activity in HNO41 (black) and HNO97 (dark red) over time after 2.5 h of cisplatin treatment (HNO41: 196 µM; HNO97: 440 µM), yielding comparable intracellular platinum concentrations. Data represent mean ± SD of four independent biological replicates; (C) Western blot analysis of cleaved caspase 3 and cleaved PARP in HNO41 (black, left) and HNO97 (dark red, right), 4 h after 2.5 h of cisplatin treatment (HNO41: 196 µM; HNO97: 440 µM) or in untreated controls (four independent biological replicates each). Twenty


