


fig2
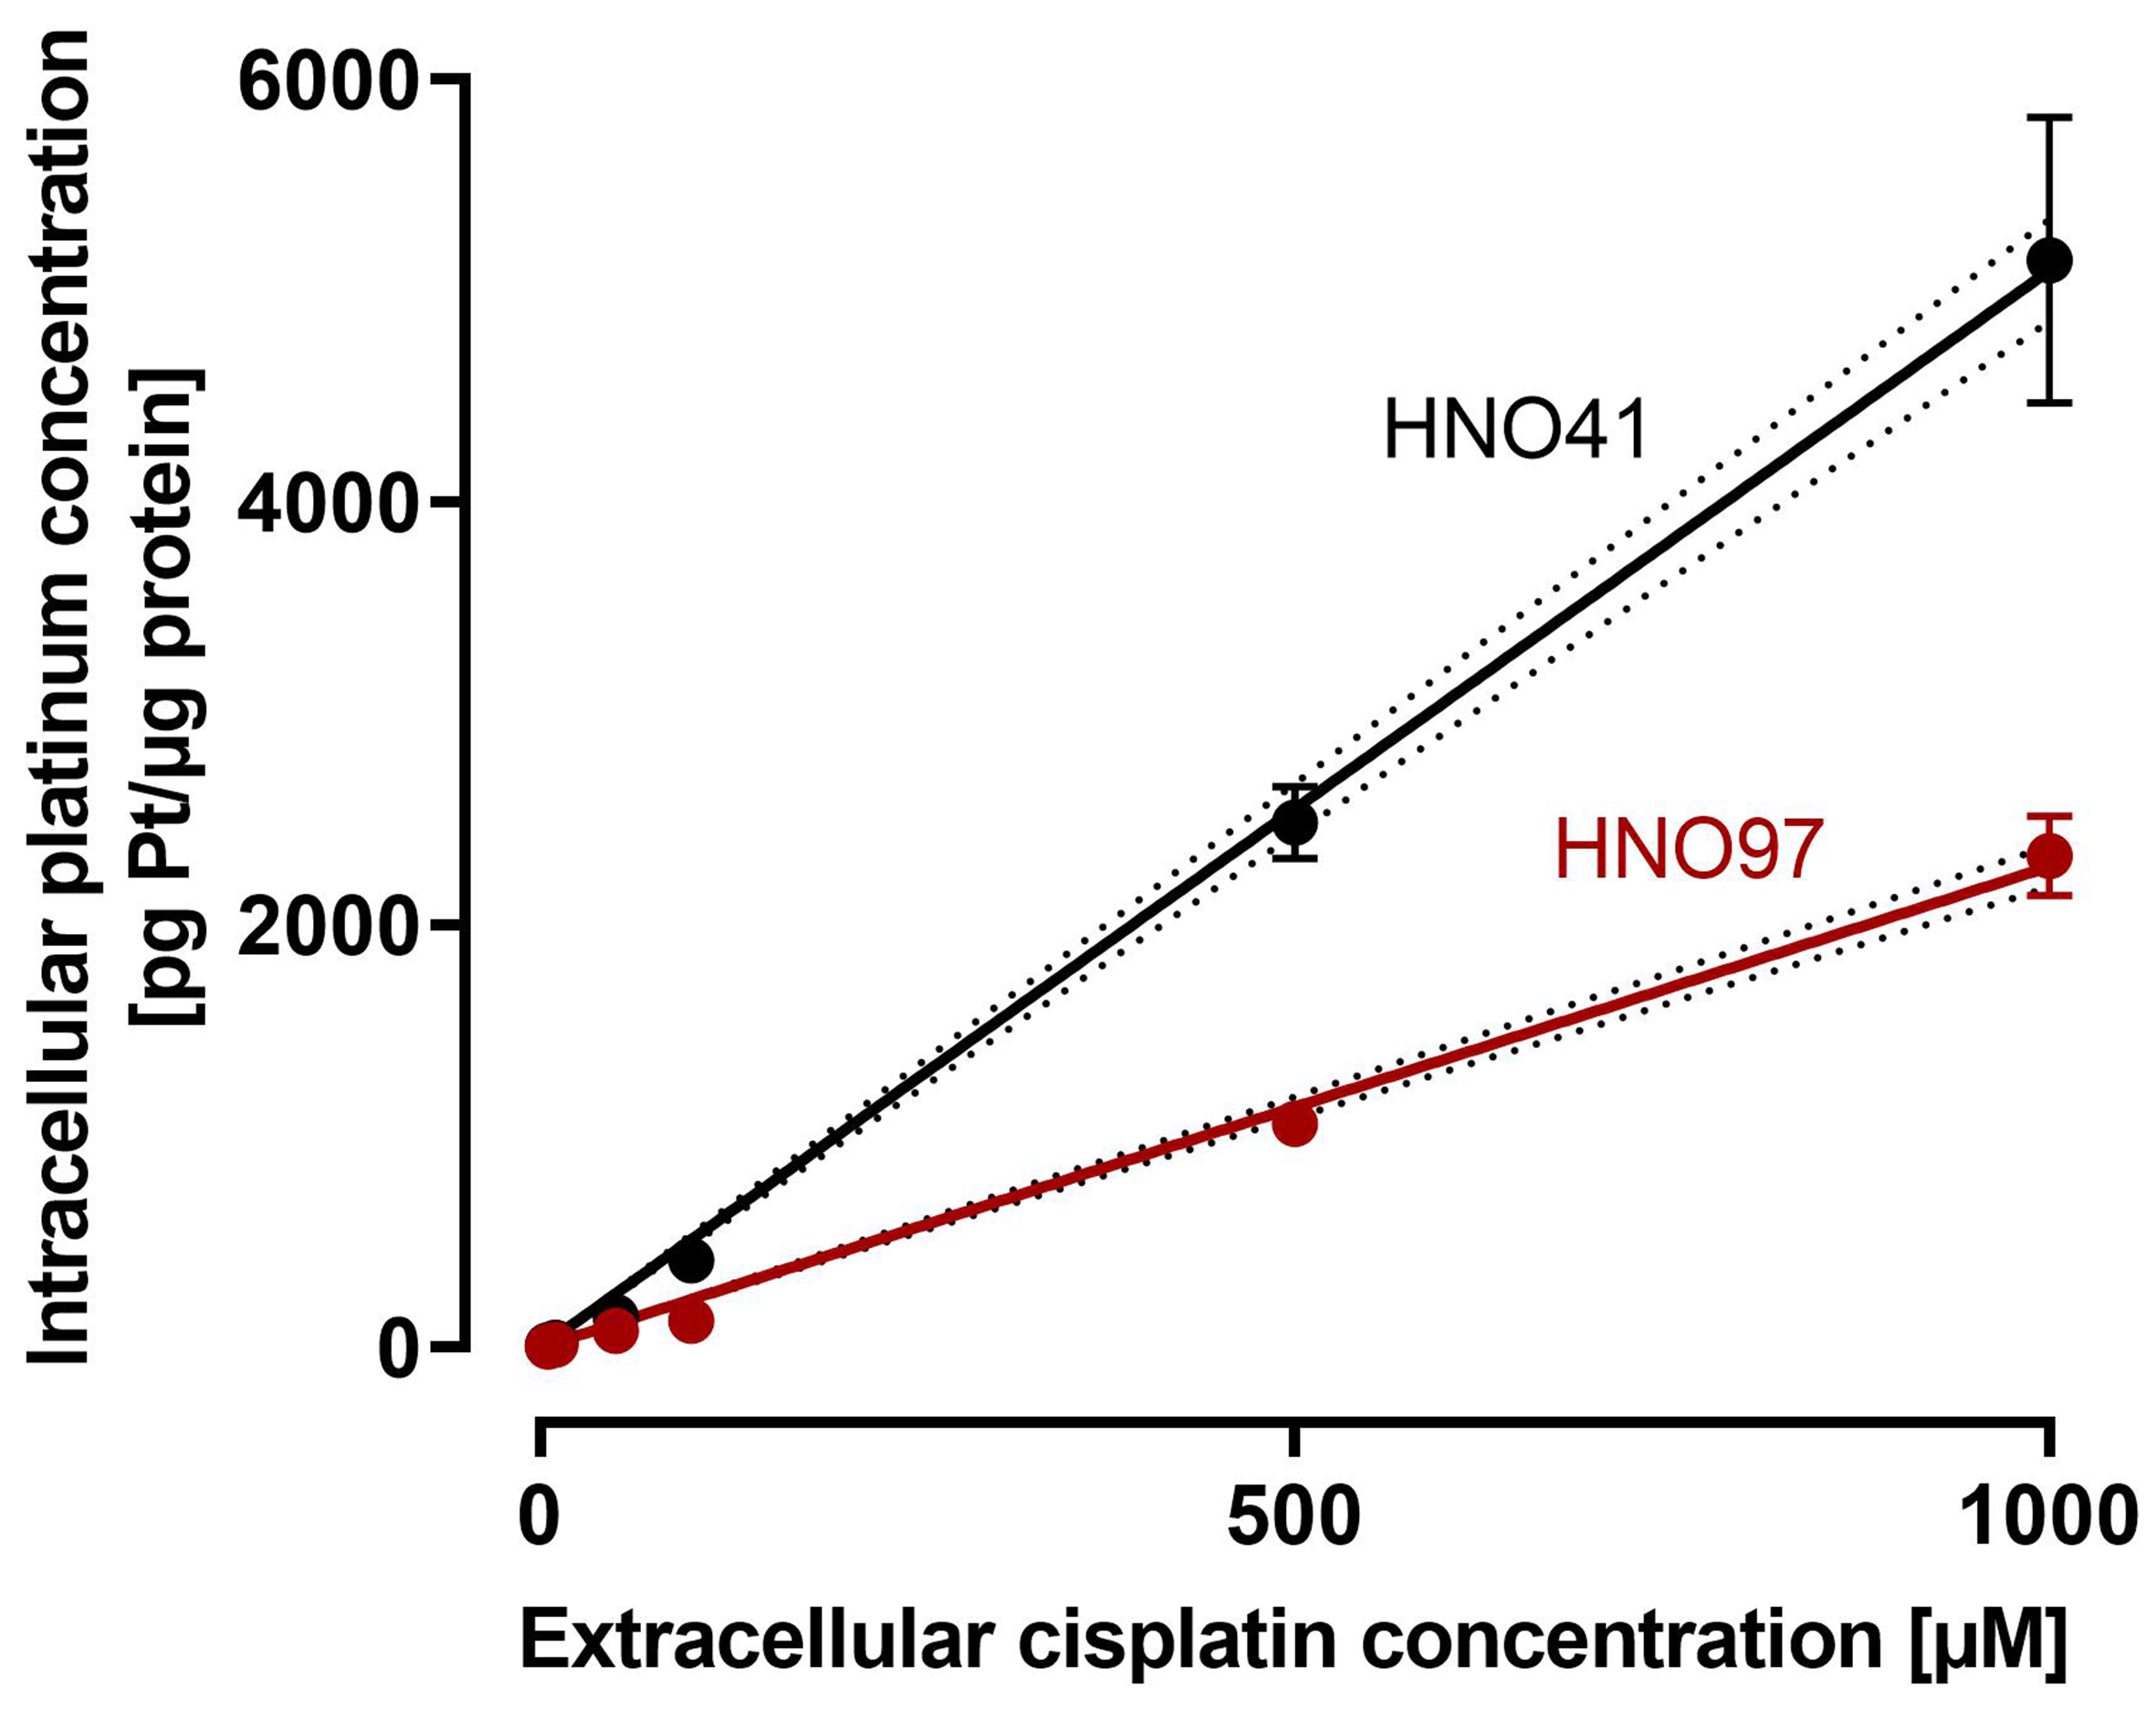
Figure 2. Cisplatin uptake characteristics in HNO41 (black) and HNO97 (dark red). Cells were exposed to cisplatin for 2.5 h, and total intracellular platinum concentrations were quantified. Data represent mean ± SD of four independent biological replicates. Linear regression lines with 95%CI margins (dotted lines) are depicted. SD: Standard deviation.


