


The predictive role of hematologic indicators in locally advanced esophageal squamous cell carcinoma patients receiving neoadjuvant chemoimmunotherapy
 0
0 Abstract
Aim: Neoadjuvant immunochemotherapy (nICT) has shown promising efficacy in locally advanced esophageal squamous cell carcinoma (LA-ESCC), but reliable predictors of pathological response and prognosis remain lacking. This study aimed to evaluate the predictive value of hematologic indicators for pathological complete response (pCR) and survival outcomes in LA-ESCC patients treated with nICT.
Methods: A total of 204 LA-ESCC patients who received nICT followed by curative esophagectomy were retrospectively analyzed. Baseline and preoperative hematologic indices were collected to calculate neutrophil-to-lymphocyte ratio (NLR), platelet-to-lymphocyte ratio, lymphocyte-to-monocyte ratio, and C-reactive protein-to-albumin ratio (CAR). Logistic regression factors identified associated with pCR, and a nomogram was developed and internally validated. Kaplan-Meier analysis and Cox regression analyses were performed for disease-free survival (DFS) and overall survival (OS).
Results: Among the 204 patients, 59 achieved pCR, with a pCR rate of 28.9%. Multivariate logistic regression identified lower baseline NLR, lower preoperative NLR, lower preoperative CAR, earlier clinical Tumor-Node-Metastasis stage, and better tumor differentiation were independently associated with pCR. The nomogram showed good discrimination with a concordance index (C-index) of 0.816 and a bootstrap-corrected C-index of 0.792. In multivariate Cox analysis, low baseline NLR, female, and pCR were associated with longer DFS, while low baseline NLR and pCR were associated with prolonged OS.
Conclusion: Lower NLR and CAR were associated with improved pathological response and survival outcomes. The nomogram may serve as a convenient adjunctive tool for individualized pCR prediction, but external validation is required.
Keywords
INTRODUCTION
Esophageal cancer is one of the most common malignancies worldwide. According to the latest global cancer statistics, it ranks 11th in incidence and 7th in mortality. The two major histological types of esophageal cancer are squamous cell carcinoma (ESCC) and adenocarcinoma[1]. While adenocarcinoma predominates in Western countries, ESCC is more prevalent in East Asia, particularly in China[2]. Due to the lack of specific early symptoms, most patients are diagnosed at locally advanced or advanced stages[3]. For locally advanced ESCC (LA-ESCC), the current standard treatment consists of neoadjuvant therapy followed by radical surgery; however, the overall prognosis remains unsatisfactory[4-7].
In recent years, immunotherapy has revolutionized cancer treatment. The combination of immune checkpoint inhibitors (ICIs) and chemotherapy has been established as the standard first-line regimen for advanced ESCC[8-12]. Encouraged by these results, ICIs have been increasingly investigated in the neoadjuvant setting for resectable LA-ESCC. Several clinical studies have demonstrated that neoadjuvant immunochemotherapy (nICT) improves pathological response rates and local disease control with manageable toxicity[13-15]. Notably, the achievement of pathological complete response (pCR) not only reflects short-term therapeutic efficacy but also associates with favorable long-term survival outcomes in esophageal cancer[16,17].
Despite these advances, reliable biomarkers for predicting pCR are still lacking. Previous studies have investigated multiple potential approaches, including molecular markers (e.g., PD-L1 expression, tumor mutational burden [TMB], and microsatellite instability [MSI]), imaging-based assessments (positron emission tomography/computed tomography [PET/CT], magnetic resonance imaging [MRI], and computed tomography [CT]), and multi-omics analyses[13,18-26]. However, their predictive value remains inconsistent, and these methods are often costly and technically demanding, limiting their applicability in routine clinical practice. Therefore, developing an accessible, cost-effective, and reproducible predictive tool is essential for guiding individualized treatment strategies and optimizing clinical decision-making.
Systemic inflammation plays a pivotal role in tumor development, progression, and therapeutic response[27-30]. Consequently, inflammation-based hematological indices—which are inexpensive, readily available, and easily standardized—have gained growing attention. Previous studies have reported that markers such as the neutrophil-to-lymphocyte ratio (NLR), platelet-to-lymphocyte ratio (PLR), lymphocyte-to-monocyte ratio (LMR), and C-reactive protein-to-albumin ratio (CAR) are associated with treatment response and survival outcomes across various malignancies, including esophageal cancer[31-37].
However, to the best of our knowledge, research evaluating the role of these inflammation-based biomarkers in predicting response to nICT for LA-ESCC remains limited, and most studies have focused only on baseline (pre-treatment) indicators. Therefore, this study aimed to evaluate the predictive value of both baseline and preoperative inflammatory biomarkers for pCR in LA-ESCC patients treated with nICT. In addition, we further assessed the prognostic significance of these biomarkers for disease-free survival (DFS) and overall survival (OS), with the goal of exploring convenient adjunctive markers for treatment response prediction and prognostic stratification in this population.
METHODS
Patient selection
This study retrospectively and consecutively screened patients with LA-ESCC who received nICT at Sun Yat-sen University Cancer Center between 2020 and 2024. Patients were selected according to the predefined inclusion and exclusion criteria. The inclusion criteria were as follows: (1) histologically confirmed ESCC; (2) clinical Tumor-Node-Metastasis (cTNM) stage II-IVA according to the 8th edition of the American Joint Committee on Cancer (AJCC) staging system[38]; and (3) administration of at least one cycle of PD-1 inhibitor combined with chemotherapy. Exclusion criteria included: (1) administration of other neoadjuvant treatment regimens such as radiotherapy or targeted therapy before surgery; (2) presence of other primary malignancies; (3) failure to undergo surgery after nICT due to disease progression during treatment, severe treatment-related toxicity, poor physical condition unsuitable for surgery, refusal of surgery, or other reasons; (4) non-R0 resection; (5) active infection, hematologic disorder, or autoimmune disease; and (6) incomplete baseline or follow-up data. All patients who met the inclusion criteria and did not meet any of the exclusion criteria were included in the final analysis. A complete-case analysis was performed. Missing or out-of-window data were minimal (2.99%) and mainly involved biochemical and hematological variables. Detailed information on missing or out-of-window data for each variable is provided in
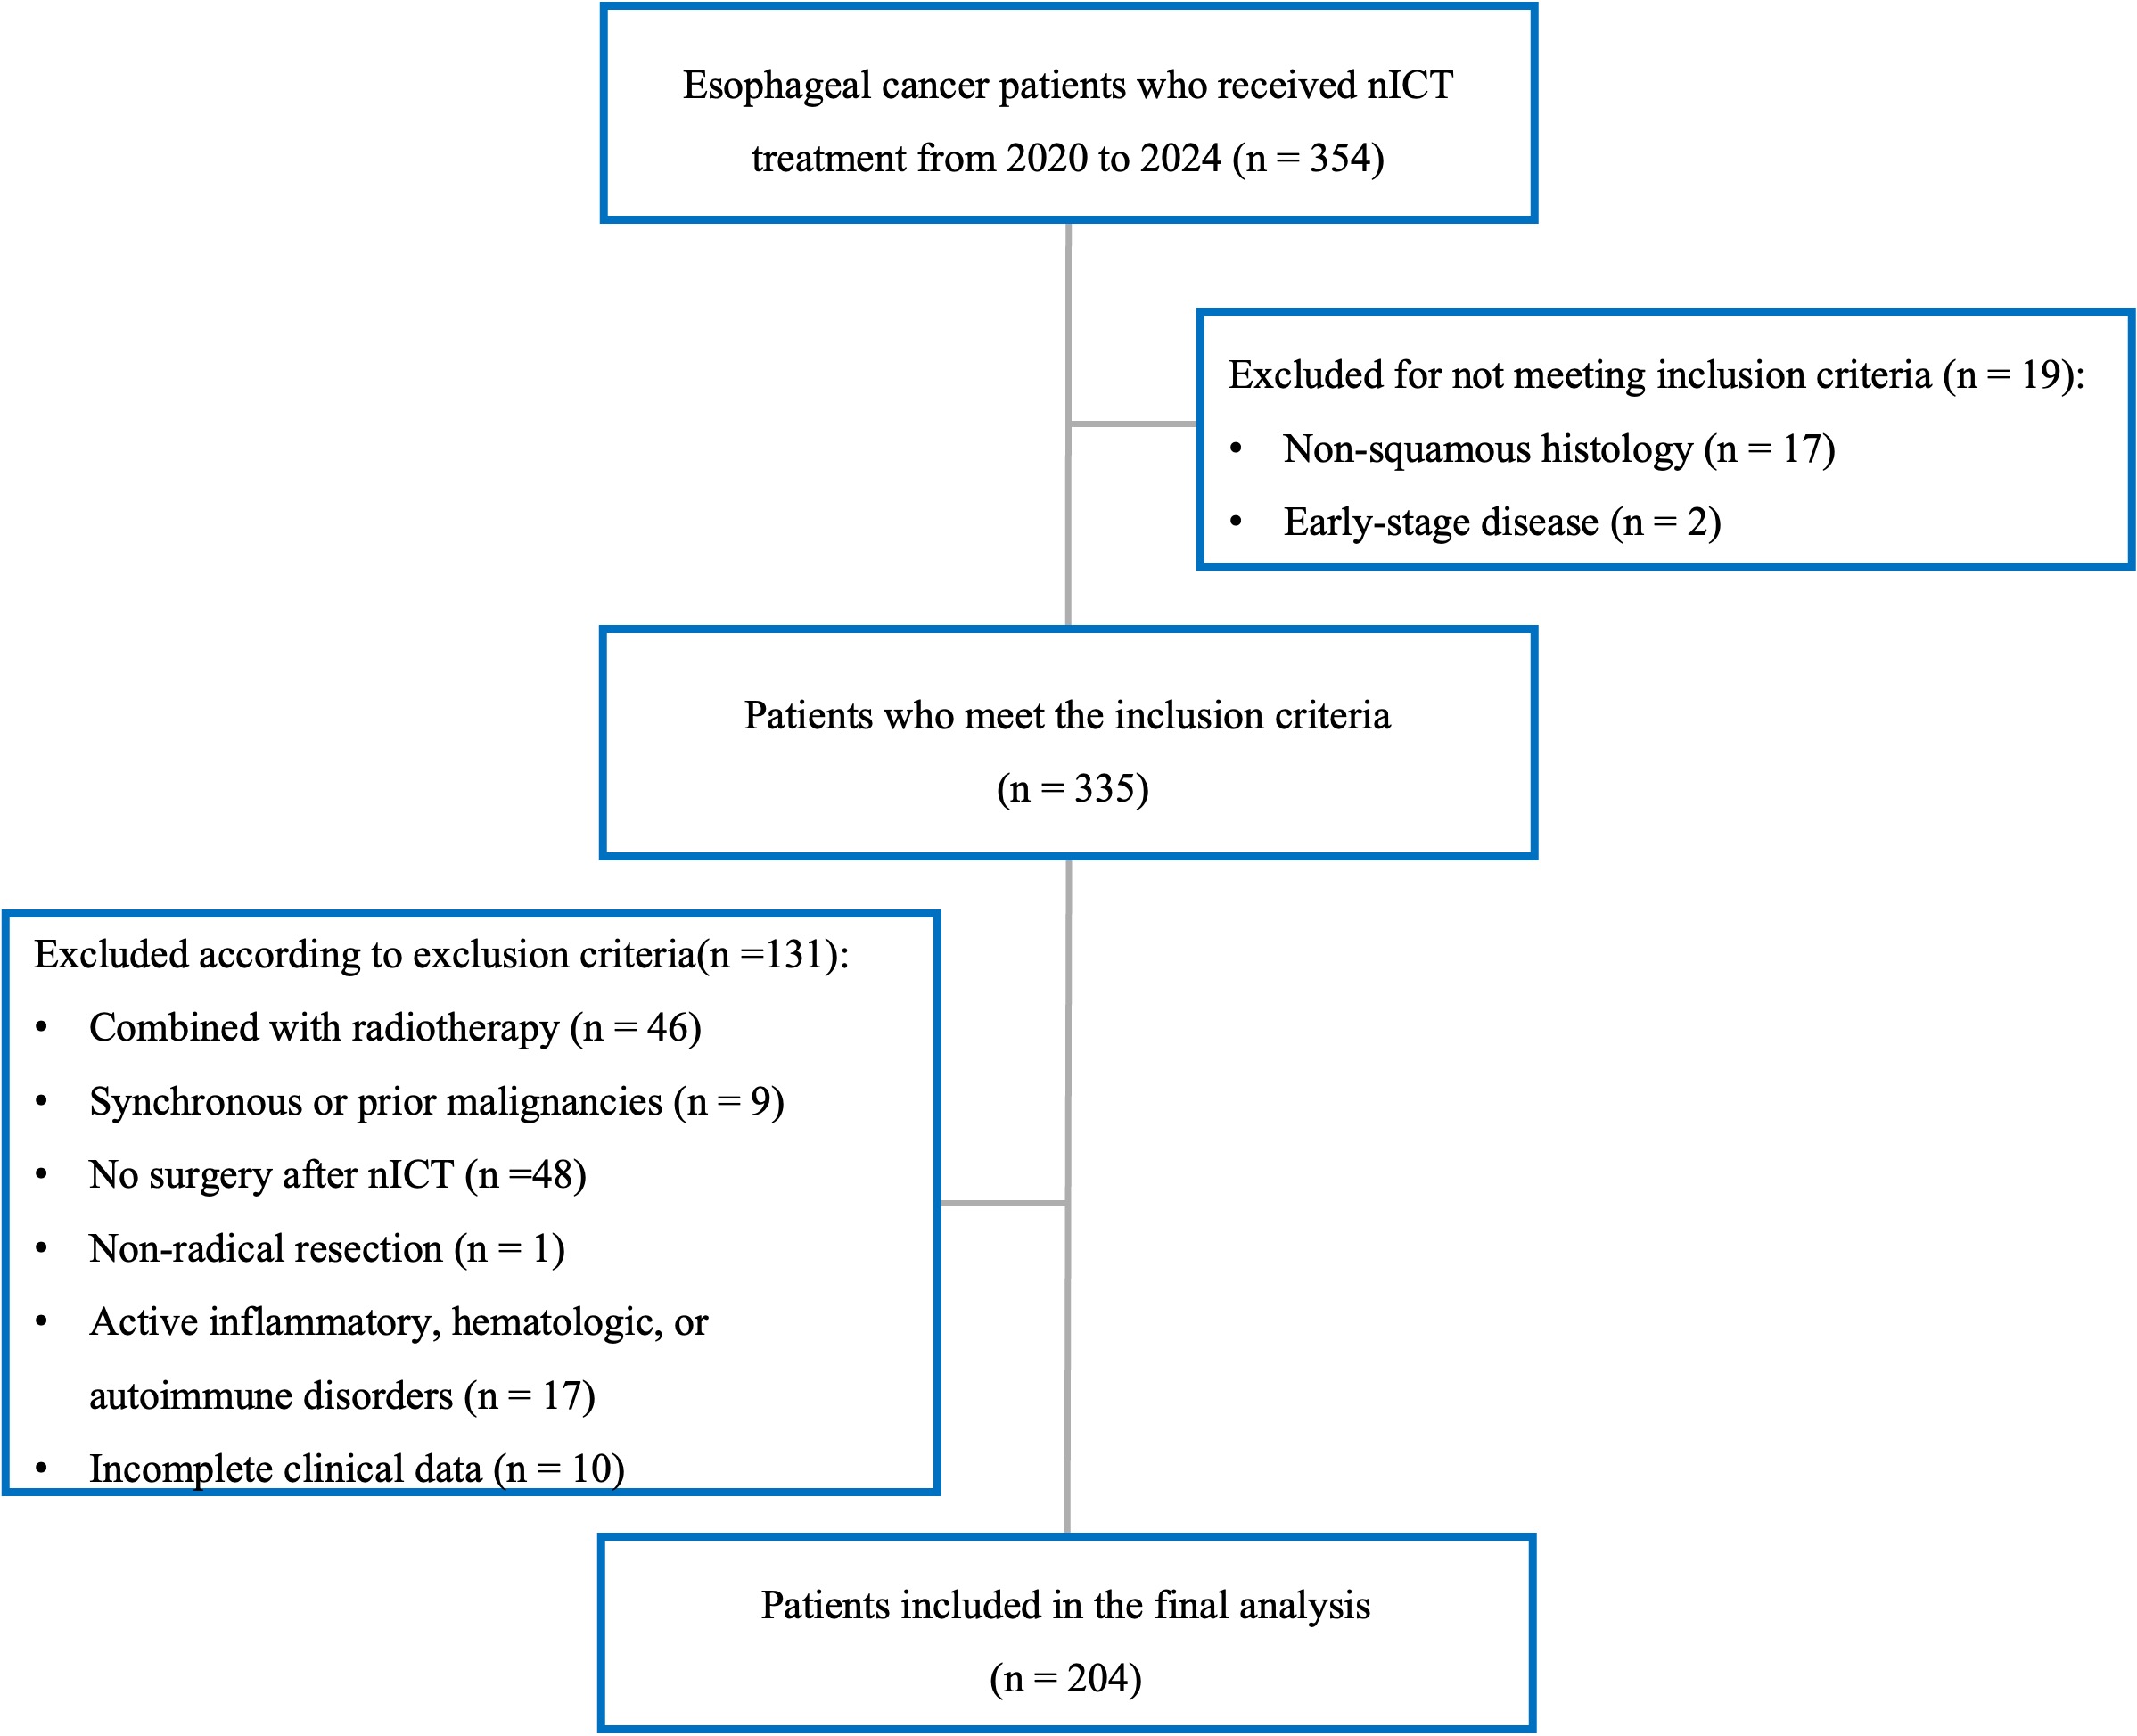
Figure 1. The flow diagram of patient selection. nICT: Neoadjuvant immunochemotherapy.
Treatment protocol
All patients received concurrent chemotherapy and immunotherapy before surgery, administered every three weeks. The chemotherapy regimens included either (1) a taxane-platinum combination, and (2) a taxane-fluoropyrimidine combination. The main chemotherapeutic agents used were paclitaxel, nab-paclitaxel, docetaxel, cisplatin, carboplatin, nedaplatin, lobaplatin, tegafur, and capecitabine. For immunotherapy, patients received one of the following PD-1 inhibitors: camrelizumab (AiRuiKa®, Hengrui Pharmaceuticals, Jiangsu, China), pembrolizumab (Keytruda®, Merck & Co., USA), tislelizumab (BaiZeAn®, BeiGene, Beijing, China), toripalimab (Tuoyi®, Junshi Biosciences, Shanghai, China), sintilimab (Tyvyt®, Innovent Biologics, Suzhou, China), or serplulimab (Hansizhuang®, Henlius Biotech, Shanghai, China).
After completion of neoadjuvant treatment, all patients underwent radical esophagectomy, most commonly minimally invasive esophagectomy (MIE) using the McKeown or Ivor Lewis approach combined with two-field or three-field lymphadenectomy. Although adjuvant immunotherapy following neoadjuvant chemoradiotherapy has been reported to improve survival outcomes[39], there is currently no established consensus on adjuvant therapy after nICT. Therefore, postoperative adjuvant immunotherapy was allowed but not mandatory in this cohort.
Data collection
Peripheral blood samples were collected within two weeks before the initiation of nICT and within one week before surgery. To minimize the influence of non-tumor-related inflammatory conditions, patients with clinically evident fever, active infection, hematologic disorder, autoimmune disease, or other conditions that might significantly affect peripheral blood inflammatory indicators at the time of blood sampling were excluded. In addition, available medical records were reviewed for potential confounding factors before blood sampling, including recent antibiotic use, corticosteroid use, granulocyte colony-stimulating factor support, blood transfusion, immune-related adverse events, and severe treatment-related toxicities. Owing to the retrospective nature of this study, these factors could not be systematically adjusted for in all patients. Laboratory tests including white blood cell count (WBC), neutrophil count (NEUT), lymphocyte count (LYM), monocyte count (MONO), platelet count (PLT), serum C-reactive protein (CRP) level, and serum albumin (ALB) level, were measured, and inflammation-based indices were subsequently calculated as follows: NLR = NEUT/LYM, PLR = PLT/LYM, LMR = LYM/MONO, and CAR = CRP/ALB. In addition, clinicopathological data were also collected, including age, sex, smoking history, body mass index (BMI), Eastern Cooperative Oncology Group performance status (ECOG-PS), tumor location, histologic differentiation, treatment regimen, cycles of neoadjuvant treatment, interval between the last treatment cycle and surgery, T stage, N stage, cTNM stage, pathologic findings, recurrence status, and survival outcomes.
Pathological assessment
Surgical specimens obtained after nICT were processed and evaluated according to the institutional standardized pathological protocol. The primary tumor bed and all dissected regional lymph nodes were systematically examined by experienced gastrointestinal pathologists. Cases with pCR or uncertain pathological response were reviewed and confirmed by a second pathologist. pCR was defined as the absence of viable tumor cells in both the resected primary tumor and all dissected regional lymph nodes, corresponding to ypT0N0. Tumor regression grade (TRG) was evaluated according to the modified Ryan scheme recommended by the College of American Pathologists (CAP) and the National Comprehensive Cancer Network (NCCN). TRG 0 was defined as complete response with no viable cancer cells; TRG 1 as near-complete response with single cells or rare small groups of cancer cells; TRG 2 as partial response with residual cancer showing evident tumor regression; and TRG 3 as poor or no response with extensive residual cancer and no evident tumor regression. Representative hematoxylin and eosin-stained sections of primary tumor tissue, adjacent non-tumor esophageal mucosa, and regional lymph node metastasis were reviewed and are presented in
Endpoints and follow-up
The primary endpoint of this study was pCR, as defined above. The secondary endpoints were DFS and OS. DFS was defined as the interval from the date of radical surgery to the first documented recurrence, disease progression, death from any cause, or last follow-up. OS was defined as the interval from the date of diagnosis to death from any cause or the last follow-up. DFS and OS were calculated from different starting points because DFS reflects postoperative disease control, whereas OS reflects the overall disease course from diagnosis. Survival analyses were restricted to patients who completed nICT and underwent curative surgery. After surgery, all patients were regularly followed up through outpatient visits and telephone interviews. Follow-up data were obtained from the hospital’s electronic medical record system and institutional follow-up database, with the last follow-up date on August 21, 2025.
Statistical analysis
Categorical variables were expressed as numbers and percentages and analyzed using the Chi-square test or Fisher’s exact test. The Shapiro-Wilk test was used to assess the normality of continuous variables. Variables with a normal distribution were expressed as mean ± standard deviation (SD) and compared using the independent-samples t-test, whereas variables with a non-normal distribution were presented as median and interquartile range (IQR) and compared using the Mann-Whitney U test.
ROC curve analysis was performed to evaluate the predictive performance of hematologic indicators for pCR. The optimal cut-off values were determined using the Youden index. The diagnostic performance of these cut-off values was further evaluated using sensitivity, specificity, positive predictive value, negative predictive value, and corresponding 95% confidence intervals.
Univariable and multivariable logistic regression analyses were conducted to identify independent predictors of pCR, with results presented as odds ratios (ORs) and corresponding 95% confidence intervals (CIs). Multicollinearity among candidate variables for multivariable logistic regression was assessed before model construction. The generalized variance inflation factor (GVIF) was calculated, and for categorical variables with more than one degree of freedom, GVIF1/(2 × Df) was reported to allow comparison across variables. To evaluate the potential influence of treatment-related heterogeneity, additional treatment-adjusted models were constructed to assess whether the associations between key hematologic indicators and pCR remained robust after adjustment for treatment-related factors. The events per variable (EPV) was calculated to evaluate the risk of overfitting.
A nomogram model was developed based on the independent predictors identified in the multivariable logistic regression analysis. Internal validation was performed using 1,000 bootstrap resamples. The discriminative ability of the nomogram was evaluated using the area under the ROC curve (AUC) and the concordance index (C-index), while calibration curves were generated to assess the agreement between predicted and observed probabilities. Decision curve analysis (DCA) was further applied to evaluate the clinical utility and net benefit of the nomogram.
OS and DFS were estimated using the Kaplan-Meier method, and differences between groups were compared using the log-rank test. Univariable and multivariable Cox proportional hazards regression analyses were performed to identify independent prognostic factors, with results expressed as hazard ratios (HRs) and 95%CIs. The proportional hazards assumption for the final Cox models was assessed using Schoenfeld residuals.
All statistical analyses were two-sided, and a P-value < 0.05 was considered statistically significant. Analyses were conducted using R software (version 4.5.1, R Foundation for Statistical Computing, Vienna, Austria). The main R packages used included readxl and dplyr for data processing, pROC for ROC analysis, car for multicollinearity assessment, rms for nomogram construction and calibration, rmda for decision curve analysis, ResourceSelection for the Hosmer-Lemeshow goodness-of-fit test, ggplot2 for visualization, and survival and survminer for survival analysis.
RESULTS
Clinical characteristics
The baseline clinicopathological characteristics of the patients are summarized in Table 1. A total of 204 patients with LA-ESCC were included in this study. The median age was 62.5 years (range, 42-75 years), and 169 (82.8%) were male, while 35 (17.2%) were female. A history of smoking was observed in 61.3% of patients. More than half of the tumors were located in the middle thoracic esophagus (60.3%). With respect to tumor differentiation, most cases were moderately differentiated (59.8%) or poorly differentiated (37.3%). According to the 8th edition of the AJCC TNM staging system, 14.2% of patients were classified as stage II, 56.4% as stage III, and 29.4% as stage IVA. Further analysis revealed that tumor differentiation, T stage, and cTNM stage were significantly associated with pCR (P < 0.05), whereas no significant associations were observed between pCR and other clinicopathological characteristics.
Demographic and clinicopathological characteristics of all patients
| Variable | Total (n = 204) | Non-pCR (n = 145) | pCR (n = 59) | P-value |
| Sex | 0.073 | |||
| Male | 169 (82.8) | 125 (86.2) | 44 (74.6) | |
| Female | 35 (17.2) | 20 (13.8) | 15 (25.4) | |
| Age, years (Median, IQR) | 62.5 (56.0, 67.0) | 62.0 (56.0, 67.0) | 63.0 (57.0, 68.0) | 0.717 |
| ECOG-PS | 0.881 | |||
| 0 | 34 (16.7) | 23 (15.9) | 11 (18.6) | |
| 1 | 165 (80.9) | 118 (81.4) | 47 (79.7) | |
| 2 | 5 (2.5) | 4 (2.8) | 1 (1.7) | |
| Smoking history | 0.140 | |||
| Yes | 125 (61.3) | 94 (64.8) | 31 (52.5) | |
| No | 79 (38.7) | 51 (35.2) | 28 (47.5) | |
| BMI, kg/m2 (Mean ± SD) | 22.1 ± 3.0 | 22.2 ± 3.1 | 21.8 ± 2.8 | 0.327 |
| Differentiation | 0.003 | |||
| Well | 6 (2.9) | 2 (1.4) | 4 (6.8) | |
| Moderate | 122 (59.8) | 80 (55.2) | 42 (71.2) | |
| Poor | 76 (37.3) | 63 (43.4) | 13 (22.0) | |
| Tumor location | 0.493 | |||
| Upper thoracic | 26 (12.7) | 16 (11.0) | 10 (16.9) | |
| Middle thoracic | 123 (60.3) | 90 (62.1) | 33 (55.9) | |
| Lower thoracic | 55 (27.0) | 39 (26.9) | 16 (27.1) | |
| T stage | 0.041 | |||
| 1 | 3 (1.5) | 0 (0.0) | 3 (5.1) | |
| 2 | 34 (16.7) | 23(15.9) | 11 (18.6) | |
| 3 | 132 (64.7) | 95 (65.5) | 37 (62.7) | |
| 4 | 35 (17.2) | 27 (18.6) | 8 (13.6) | |
| N stage | 0.118 | |||
| 0 | 13 (6.4) | 7 (4.8) | 6 (10.2) | |
| 1 | 58 (28.4) | 41 (28.3) | 17 (28.8) | |
| 2 | 98 (48.0) | 67 (46.2) | 31 (52.5) | |
| 3 | 35 (17.2) | 30 (20.7) | 5 (8.5) | |
| cTNM stage | 0.006 | |||
| II | 29 (14.2) | 18 (12.4) | 11 (18.6) | |
| III | 115 (56.4) | 75 (51.7) | 40 (67.8) | |
| IVA | 60 (29.4) | 52 (35.9) | 8 (13.6) | |
| Chemotherapy regimen | 0.907 | |||
| Taxane/fluoropyrimidine | 118 (57.8) | 83 (57.2) | 35 (59.3) | |
| Taxane/platinum | 86 (42.2) | 62 (42.8) | 24 (40.7) | |
| PD-1 inhibitor | 0.378 | |||
| Camrelizumab | 127 (62.3) | 87 (60.0) | 40 (67.8) | |
| Others | 77 (37.7) | 58 (40.0) | 19 (32.2) | |
| nICT cycles | 0.453 | |||
| ≤ 2 | 45 (22.1) | 34 (23.4) | 11 (18.6) | |
| > 2 | 159 (77.9) | 111 (76.6) | 48 (81.4) | |
| Interval from last therapy to surgery, weeks | 0.850 | |||
| ≤ 6 | 112 (54.9) | 79 (54.5) | 33 (55.9) | |
| > 6 | 92 (45.1) | 66(45.5) | 26 (44.1) |
Pathological outcomes after nICT
Detailed pathological outcomes after nICT are summarized in Supplementary Table 2. The median number of lymph nodes examined per patient was 40 (IQR, 30-50.25). Overall, 59 patients (28.9%) achieved pCR. Among the remaining patients, residual disease was confined to the primary tumor in 81 (39.7%), to regional lymph nodes in 9 (4.4%), and to both sites in 55 (27.0%).
Hematologic parameters
Figure 2 illustrates the dynamic changes in hematologic parameters before and after nICT. The results showed that preoperative levels of NEUT, LYM, MONO, PLT, CRP, NLR, PLR, and CAR were significantly decreased compared with baseline values. No significant differences were observed in ALB and LMR between the pre- and post-treatment measurements. Furthermore, Table 2 summarizes the differences between the pCR and non-pCR groups. At baseline, the non-pCR group demonstrated higher NEUT
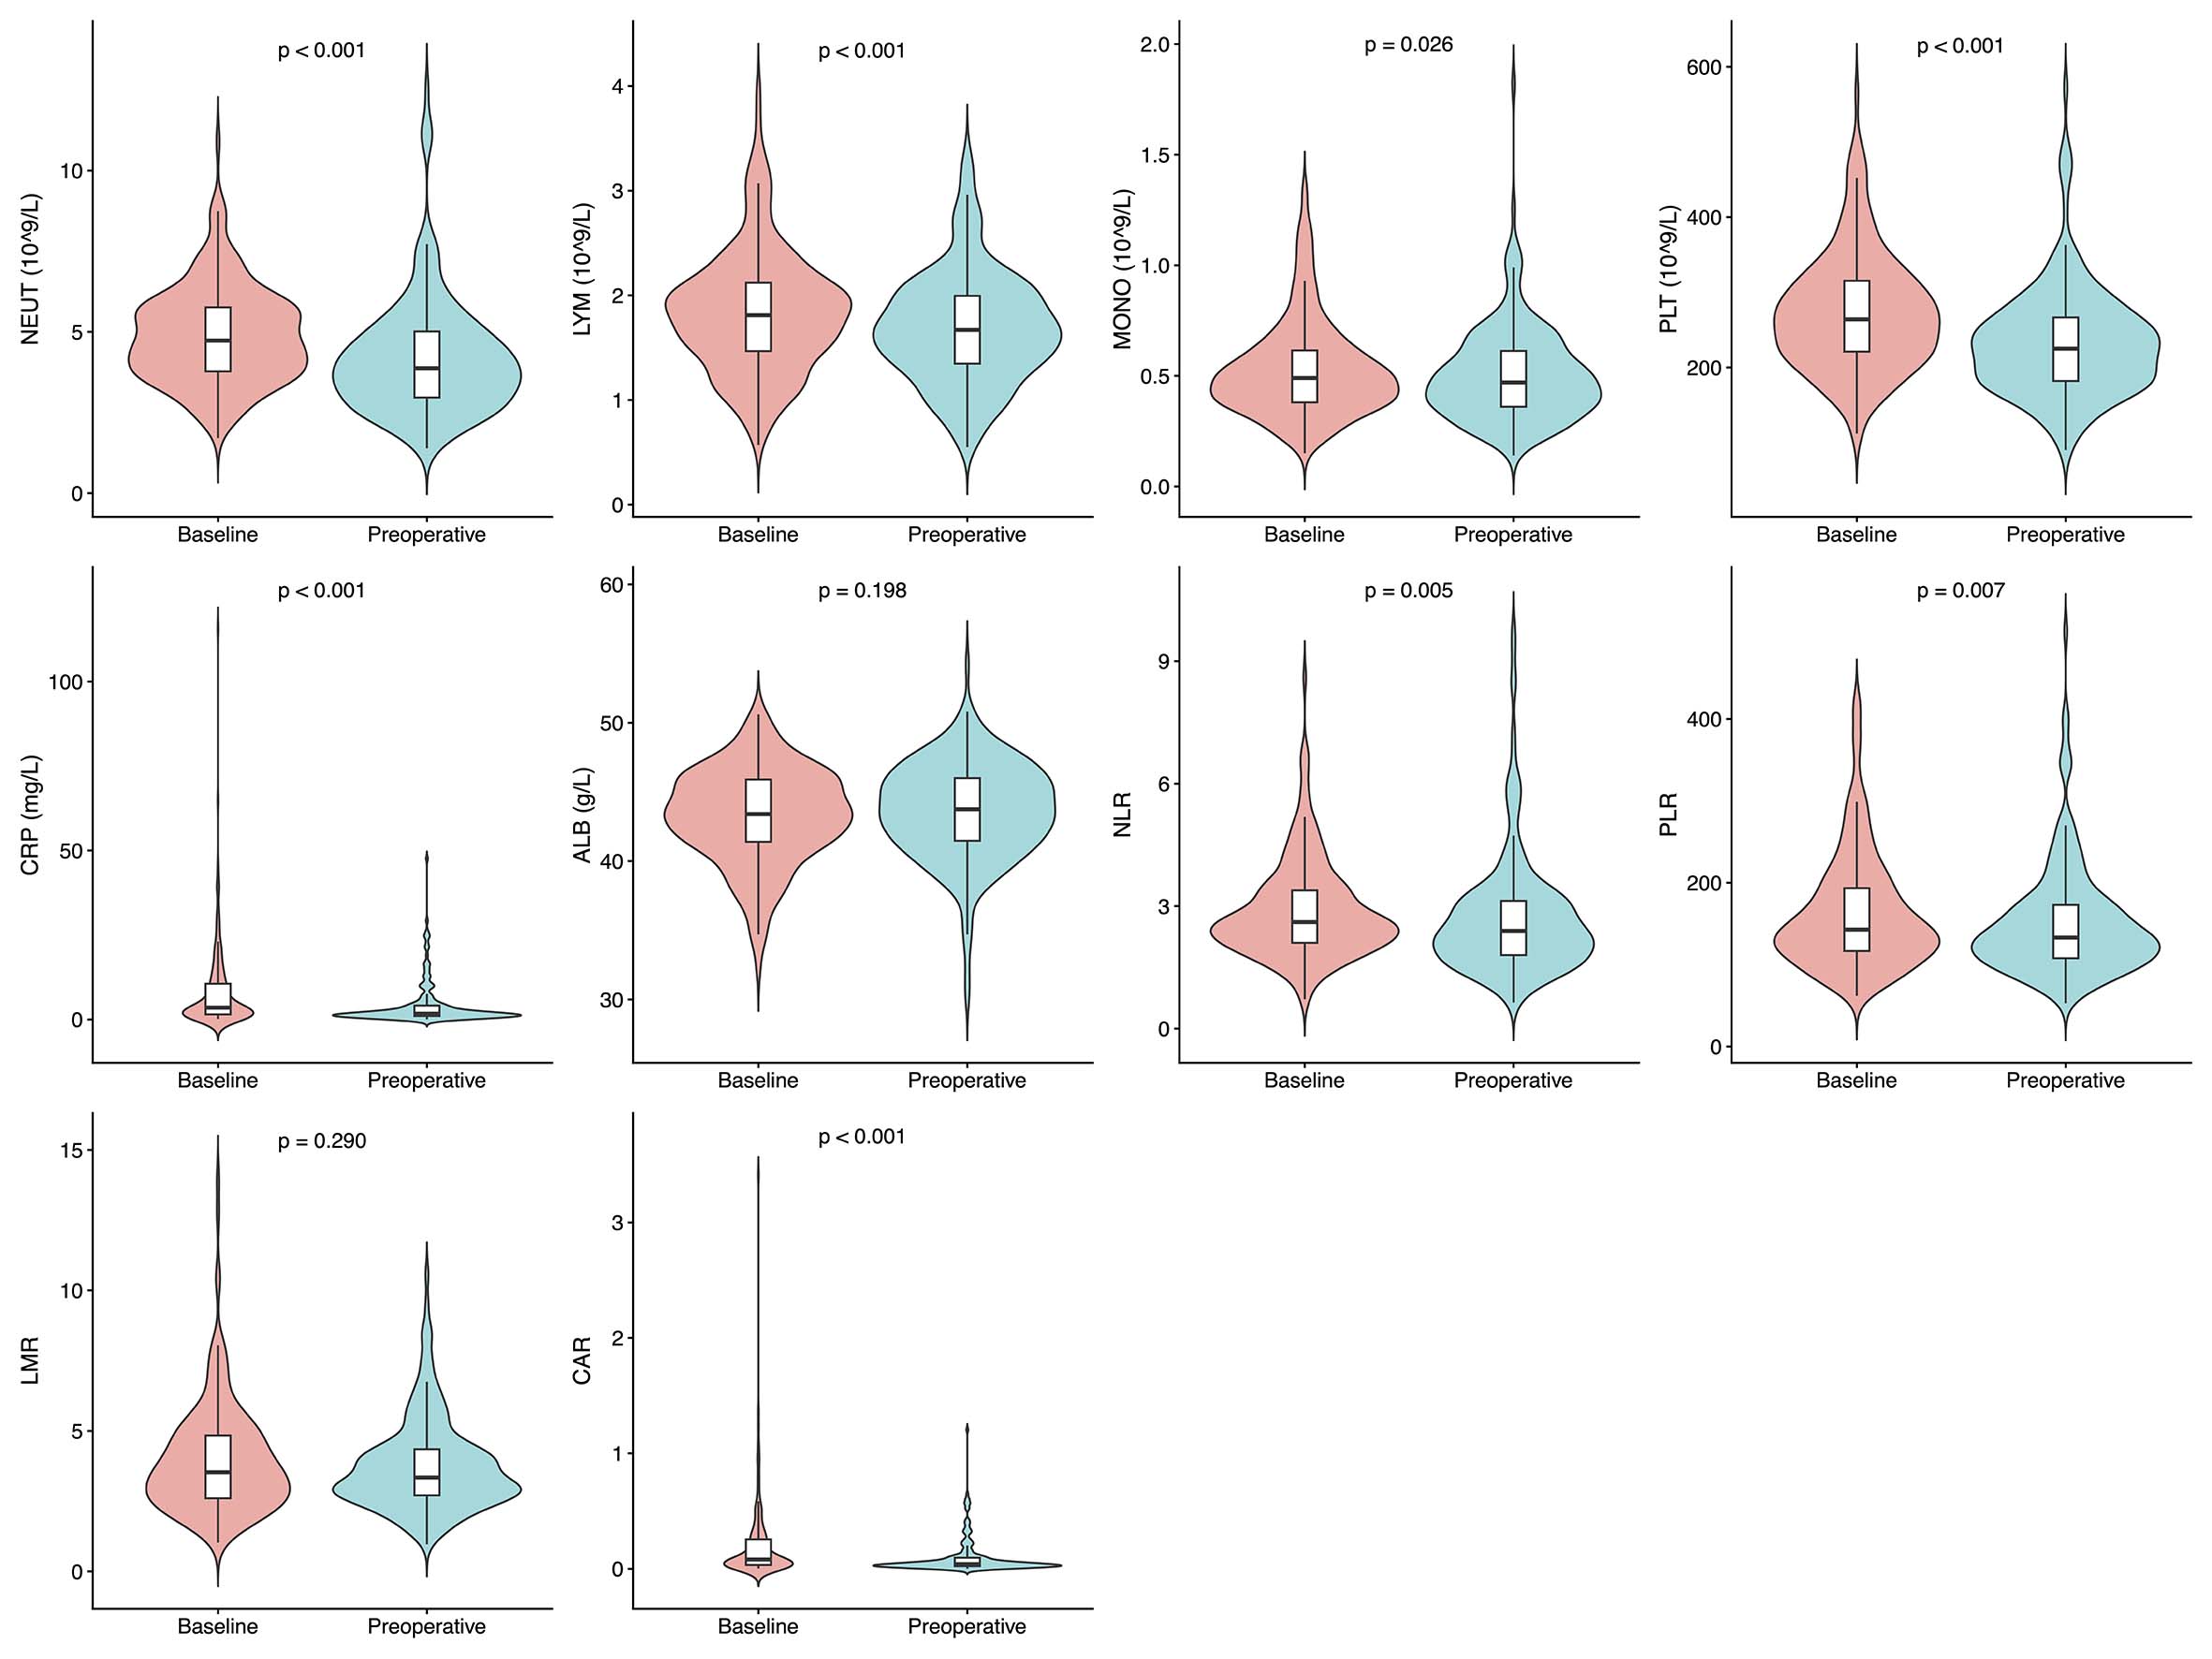
Figure 2. Dynamic changes in hematologic parameters before and after neoadjuvant immunochemotherapy (nICT). Violin plots with embedded boxplots show the distribution of baseline and preoperative hematologic parameters. P values were calculated using the paired Wilcoxon signed-rank test. NEUT: Neutrophil count; LYM: lymphocyte count; MONO: monocyte count; PLT: platelet count; CRP: C-reactive protein; ALB: albumin; NLR: neutrophil-to-lymphocyte ratio; PLR: platelet-to-lymphocyte ratio; LMR: lymphocyte-to-monocyte ratio; CAR: C-reactive protein-to-albumin ratio.
Comparison of baseline and preoperative hematologic indicators between pCR and non-pCR groups
| Variable | Total (n = 204) | Non-pCR (n = 145) | pCR (n = 59) | P-value |
| Baseline NEUT, 109/L | 4.730 (3.770, 5.765) | 4.930 (4.020, 5.880) | 4.060 (3.530, 5.290) | 0.002 |
| Baseline LYM, 109/L | 1.810 (1.465, 2.102) | 1.800 (1.410, 2.070) | 1.910 (1.580, 2.510) | 0.027 |
| Baseline MONO, 109/L | 0.490 (0.380, 0.620) | 0.500 (0.410, 0.650) | 0.420 (0.360, 0.580) | 0.035 |
| Baseline PLT, 109/L | 264.000 (221.000, 316.500) | 267.00 (221.000, 318.000) | 260.00 (222.000, 308.000) | 0.785 |
| Baseline CRP, mg/L | 3.500 (1.500, 10.710) | 3.660 (1.420, 11.320) | 3.070 (1.570, 9.160) | 0.579 |
| Baseline ALB, g/L | 43.400 (41.400, 45.900) | 43.400 (41.000, 45.900) | 43.500 (42.000, 45.800) | 0.397 |
| Baseline NLR | 2.609 (2.103, 3.387) | 2.727 (2.278, 3.652) | 2.180 (1.631, 2.780) | < 0.001 |
| Baseline PLR | 142.756 (116.491, 194.501) | 147.368 (122.424, 206.780) | 139.735 (100.000, 177.673) | 0.013 |
| Baseline LMR | 3.530 (2.597, 4.848) | 3.366 (2.525, 4.439) | 4.360 (3.000, 5.351) | < 0.001 |
| Baseline CAR | 0.080 (0.033, 0.257) | 0.084 (0.033, 0.289) | 0.068 (0.036, 0.195) | 0.535 |
| Preoperative NEUT, 109/L | 3.875 (2.960, 5.015) | 4.150 (3.210, 5.100) | 3.410 (2.560, 4.380) | < 0.001 |
| Preoperative LYM, 109/L | 1.670 (1.345, 2.000) | 1.670 (1.300, 1.960) | 1.620 (1.360, 2.140) | 0.313 |
| Preoperative MONO, 109/L | 0.470 (0.360, 0.615) | 0.480 (0.380, 0.630) | 0.450 (0.320, 0.600) | 0.198 |
| Preoperative PLT, 109/L | 225.000 (182.000, 267.000) | 222.000 (180.000, 266.000) | 234.000 (190.000, 268.000) | 0.595 |
| Preoperative CRP, mg/L | 1.685 (1.050, 4.130) | 1.930 (1.140, 4.370) | 1.470 (0.750, 2.710) | 0.079 |
| Preoperative ALB, g/L | 43.750 (41.450, 46.000) | 43.600 (41.600, 46.400) | 44.00 (41.400, 45.600) | 0.562 |
| Preoperative NLR | 2.393 (1.792, 3.133) | 2.559 (1.960, 3.327) | 2.016 (1.532, 2.487) | < 0.001 |
| Preoperative PLR | 133.028 (107.634, 172.945) | 132.778 (108.333, 172.917) | 134.559 (105.814, 172.973) | 0.511 |
| Preoperative LMR | 3.344 (2.707, 4.356) | 3.185 (2.698, 4.161) | 3.625 (2.774, 5.286) | 0.054 |
| Preoperative CAR | 0.040 (0.024, 0.096) | 0.045 (0.026, 0.102) | 0.033 (0.017, 0.061) | 0.078 |
Analysis of ROC curves
ROC curves were generated and the AUC values were calculated to evaluate the predictive performance of baseline and preoperative hematologic indices for pCR [Figure 3]. For clinical interpretability, risk stratification, and visualization, the optimal cut-off values were determined using the Youden index. The diagnostic performance of the Youden index-derived cut-off values, including sensitivity, specificity, positive predictive value, negative predictive value, and corresponding 95%CIs, is summarized in
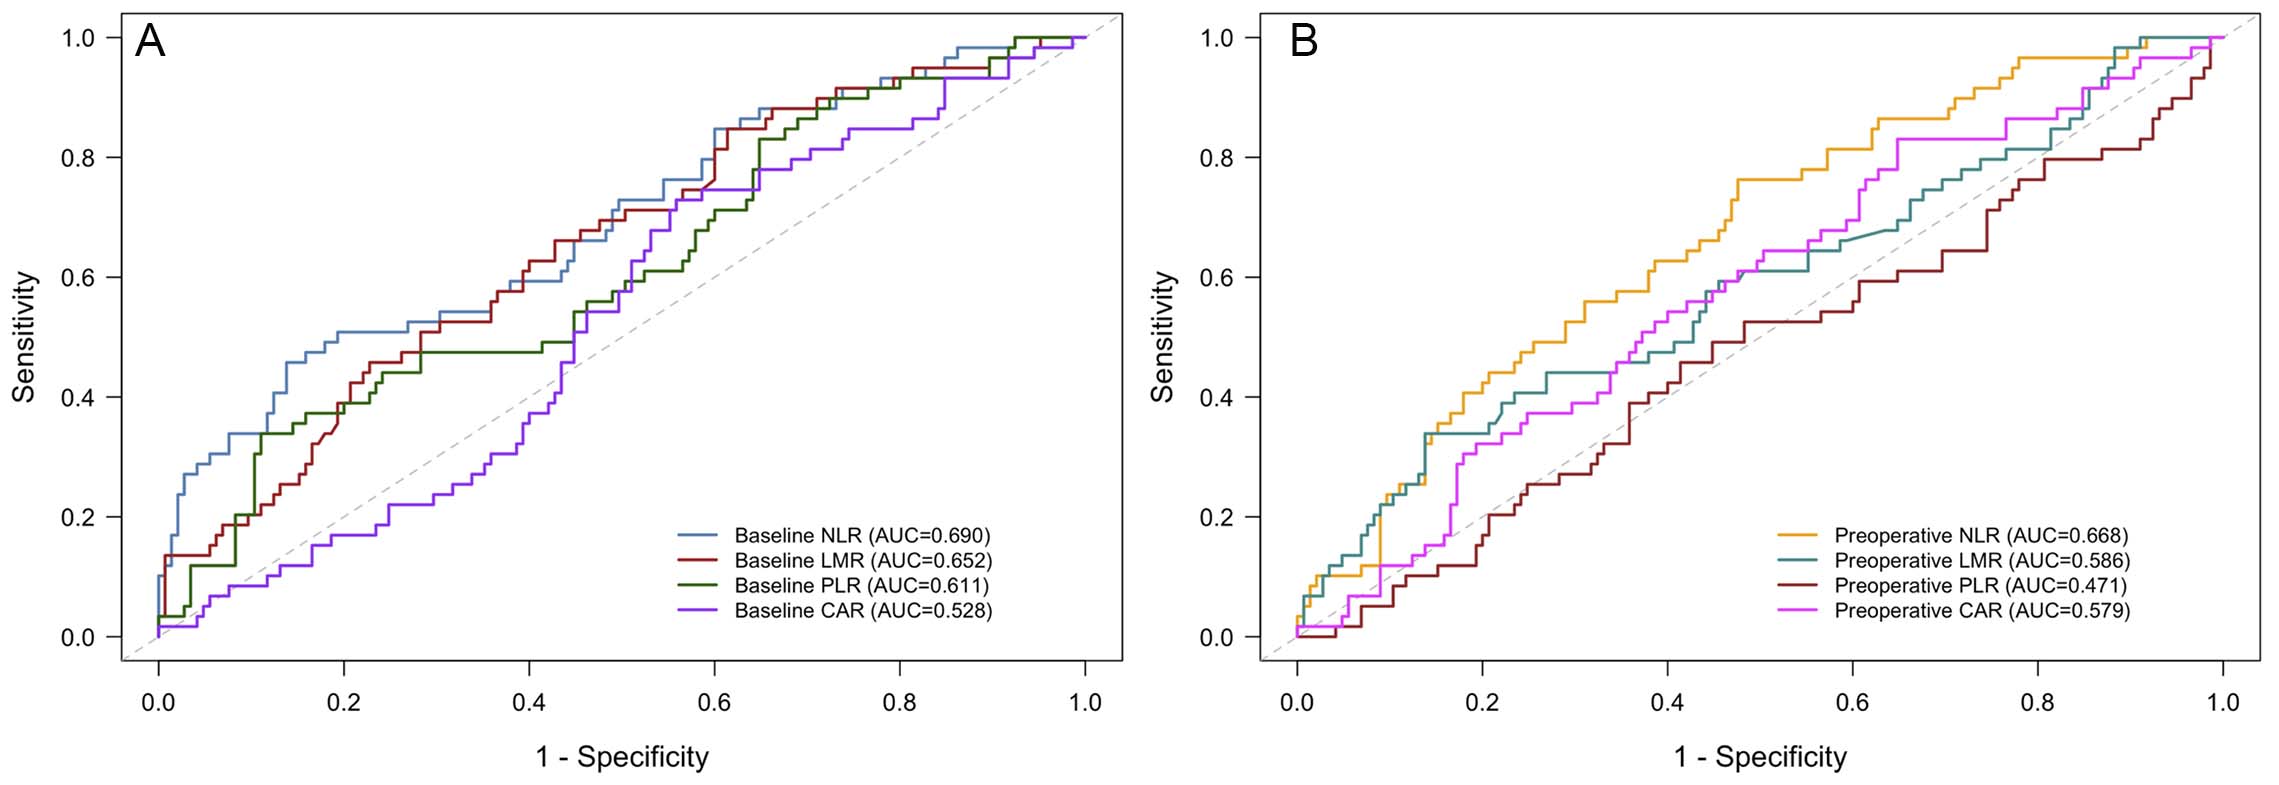
Figure 3. ROC curve analysis of baseline and preoperative hematologic indicators. (A) ROC curve analysis of baseline hematologic indicators. (B) ROC curve analysis of preoperative hematologic indicators. ROC: Receiver operating characteristic; NLR: neutrophil-to-lymphocyte ratio; PLR: platelet-to-lymphocyte ratio; LMR: lymphocyte-to-monocyte ratio; CAR: C-reactive protein-to-albumin ratio.
Factors associated with pCR
Clinicopathological and hematologic parameters associated with pCR were analyzed [Table 3]. In the univariate logistic regression analysis, sex (P = 0.049), tumor differentiation (P = 0.005), cTNM stage
UnIVAriate analysis and MultIVAriate analysis of pCR
| Variables | UnIVAriate analysis | MultIVAriate analysis | ||
| OR (95%CI) | P-value | OR (95%CI) | P-value | |
| Sex (female vs. male) | 2.131 (1.004-4.522) | 0.049 | 1.393 (0.521-3.652) | 0.504 |
| Age, years (≥ 60 vs. < 60) | 1.213 (0.638-2.305) | 0.556 | ||
| ECOG-PS (1/2 vs. 0) | 0.799 (0.368-1.821) | 0.579 | ||
| Smoking history (yes vs. no) | 0.601 (0.325-1.110) | 0.104 | ||
| BMI, kg/m2 | 0.622 | |||
| < 18.5 | reference | |||
| 18.5-24.9 | 1.253 (0.464-3.384) | 0.656 | ||
| ≥ 25 | 0.826 (0.236-2.899) | 0.766 | ||
| Differentiation (poor vs. well/moderate) | 0.368 (0.183-0.739) | 0.005 | 0.316 (0.134-0.700) | 0.006 |
| Tumor location | 0.508 | |||
| Upper thoracic | reference | |||
| Middle thoracic | 0.587 (0.242-1.422) | 0.238 | ||
| Lower thoracic | 0.656 (0.246-1.751) | 0.400 | ||
| T stage | 0.356 | |||
| 1/2 | reference | |||
| 3 | 0.640 (0.298-1.375) | 0.253 | ||
| 4 | 0.487 (0.174-1.365) | 0.171 | ||
| N stage | 0.100 | |||
| 0 | reference | |||
| 1 | 0.484 (0.142-1.652) | 0.247 | ||
| 2 | 0.540 (0.167-1.740) | 0.302 | ||
| 3 | 0.194 (0.046-0.824) | 0.026 | ||
| cTNM stage | 0.004 | 0.024 | ||
| II | reference | |||
| III | 0.873 (0.376-2.027) | 0.785 | 0.775 (0.277-2.220) | 0.627 |
| IVA | 0.252 (0.088-0.724) | 0.011 | 0.231 (0.062-0.818) | 0.025 |
| Chemotherapy regimen (taxane/platinum vs. taxane/fluoropyrimidine) | 0.918 (0.496-1.698) | 0.785 | ||
| PD-1 inhibitor (camrelizumab vs. others) | 1.404 (0.741-2.660) | 0.299 | ||
| nICT cycles (≤ 2 vs. > 2) | 2.121 (0.617-7.296) | 0.233 | ||
| Interval from last therapy to surgery, weeks (≤ 6 vs. > 6) | 0.943 (0.513-1.734) | 0.850 | ||
| Baseline NLR (low vs. high) | 5.273 (2.628-10.583) | < 0.001 | 2.888 (1.218-7.013) | 0.014 |
| Baseline PLR (low vs. high) | 4.135 (1.956-8.741) | < 0.001 | 2.488 (0.972-6.493) | 0.057 |
| Baseline LMR (low vs. high) | 0.286 (0.131-0.627) | 0.002 | 0.461 (0.167-1.193) | 0.119 |
| Baseline CAR (low vs. high) | 2.123 (1.096-4.112) | 0.026 | 0.965 (0.407-2.287) | 0.935 |
| Preoperative NLR (low vs. high) | 3.540 (1.789-7.007) | < 0.001 | 3.173 (1.415-7.536) | 0.006 |
| Preoperative PLR (low vs. high) | 0.837 (0.455-1.539) | 0.566 | ||
| Preoperative LMR (low vs. high) | 0.312 (0.152-0.639) | 0.001 | 0.700 (0.279-1.775) | 0.448 |
| Preoperative CAR (low vs. high) | 2.659 (1.242-5.689) | 0.012 | 2.778 (1.101-7.618) | 0.037 |
Nomogram development
Subsequently, a nomogram was developed based on the independent predictors of pCR identified in the multivariate logistic regression analysis [Figure 4A]. Among these variables, baseline NLR, preoperative NLR, and cTNM stage contributed most to the prediction of pCR [Figure 4B].
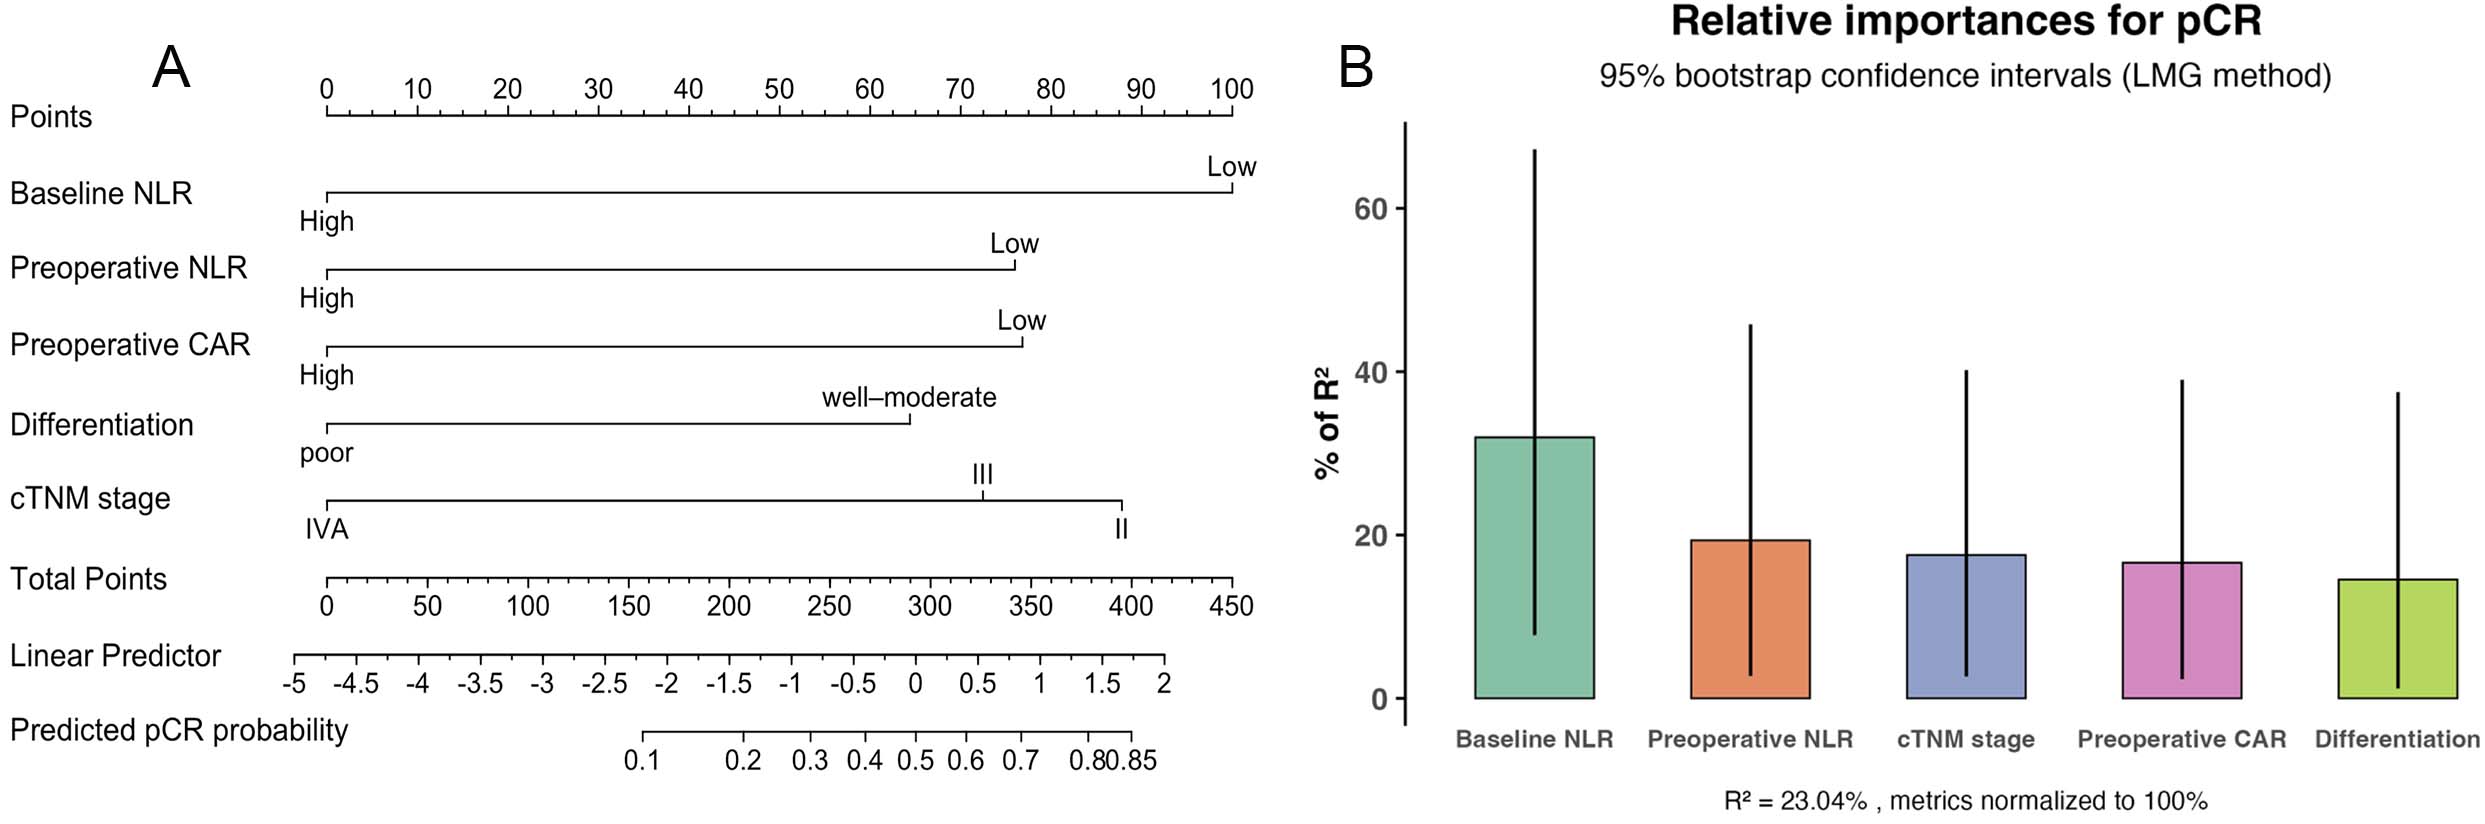
Figure 4. Nomogram and relative contributions of predictive variables for pathological complete response (pCR). (A) Nomogram predicting pCR in patients with locally advanced esophageal squamous cell carcinoma (LA-ESCC) treated with neoadjuvant immunochemotherapy (nICT). (B) Relative contribution of each predictive factor to the explanation of pCR. The vertical lines represent 95%CI derived from bootstrap resampling. cTNM: Clinical tumor-node-metastasis; NLR: neutrophil-to-lymphocyte ratio; CAR: C-reactive protein-to-albumin ratio.
To further evaluate the performance of the nomogram, ROC curve, calibration plot, and DCA were performed [Figure 5]. The model exhibited good discriminative ability with a C-index of 0.816
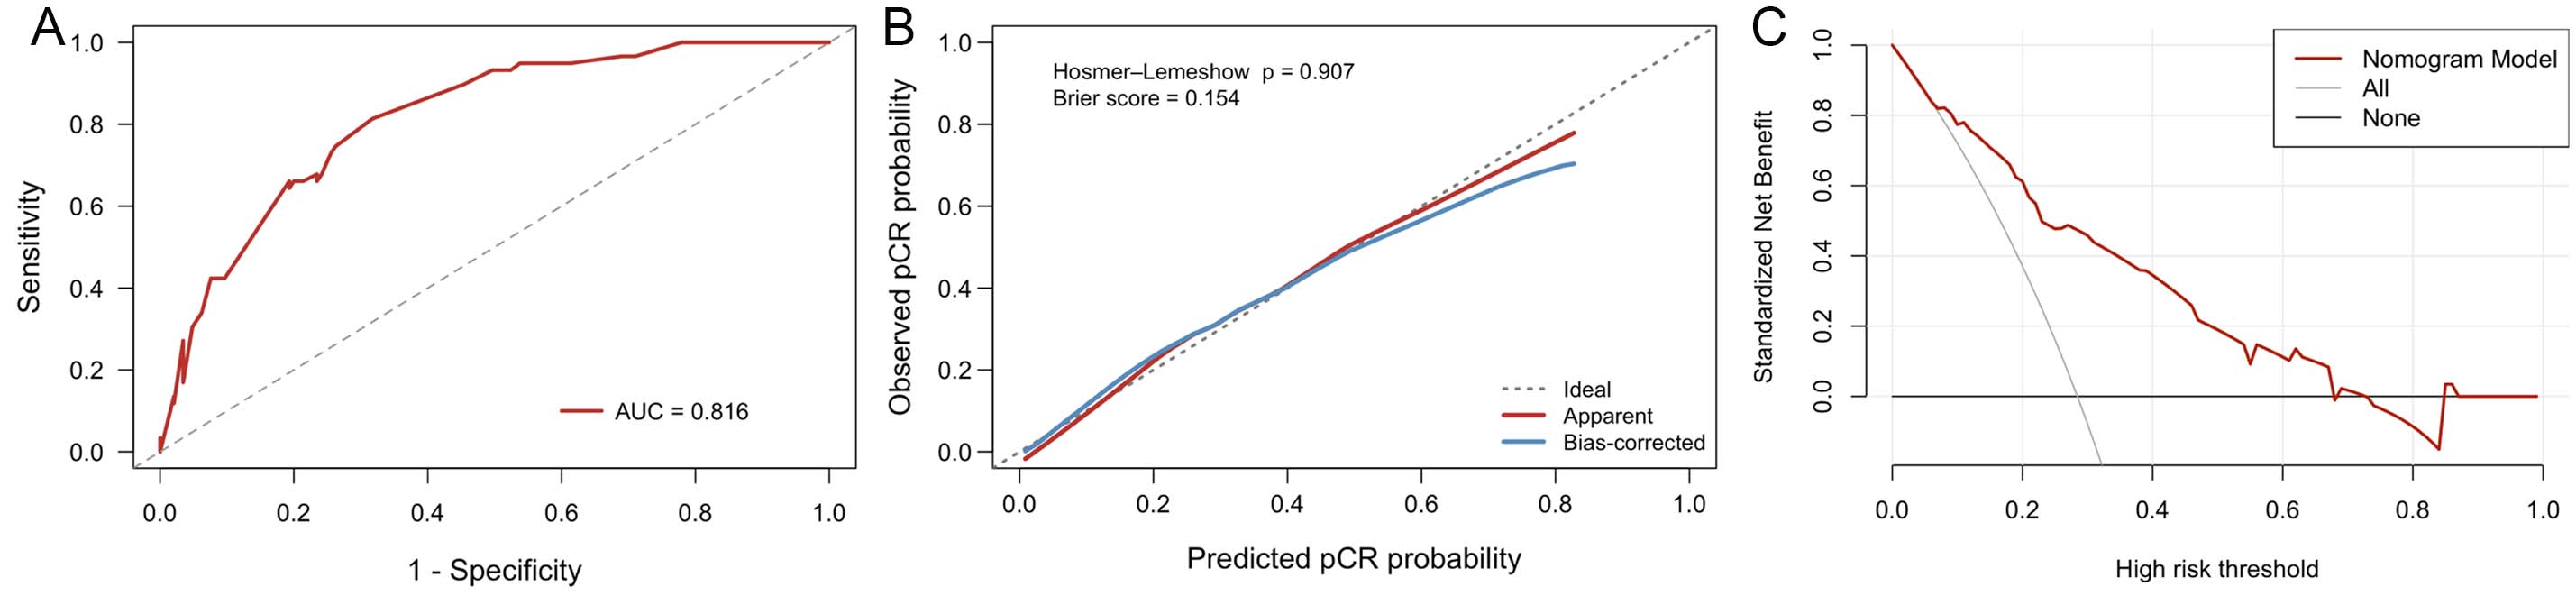
Figure 5. Validation of the nomogram model. (A) Receiver operating characteristic (ROC) curve of the nomogram. (B) Calibration curve of the nomogram. (C) Decision curve analysis (DCA) of the nomogram. AUC: Area under the curve.
Separated baseline and preoperative models
To address the potential redundancy between baseline and preoperative hematologic indicators, additional separated models were constructed. In the baseline model adjusted for tumor differentiation and cTNM stage, low baseline NLR was significantly associated with a higher probability of pCR (OR = 4.689, 95%CI: 2.246-10.033, P < 0.001). In the preoperative model, both low preoperative NLR (OR = 3.716, 95%CI: 1.815-8.039, P < 0.001) and low preoperative CAR (OR = 2.666, 95%CI: 1.197-6.409, P = 0.021) were significantly associated with pCR. These findings support the rationale that baseline and preoperative hematologic indicators may reflect distinct inflammatory states before and after nICT and provide complementary information for pCR prediction [Supplementary Table 6].
Sensitivity analysis for the pCR prediction model
Sensitivity analyses were conducted to evaluate the potential impact of treatment heterogeneity on the pCR prediction model. After additional adjustment for PD-1 inhibitor type, chemotherapy regimen, number of nICT cycles, and interval from nICT to surgery, the associations of baseline NLR, preoperative NLR, and preoperative CAR with pCR remained directionally consistent and statistically significant across all models. These results indicated that the main findings were relatively robust after accounting for major treatment-related factors [Supplementary Table 7].
Factors associated with DFS and OS
Kaplan-Meier survival analysis and log-rank tests were conducted to further evaluate the associations between hematologic markers and patient outcomes. The median follow-up time was 37.3 months (range, 6.8-71.3 months). During the follow-up, 54 patients (26.5%) experienced recurrence and 47 patients (23.0%) died. The median DFS and OS were not reached. Patients with low baseline NLR had significantly better DFS than those with high NLR (3-year DFS rate: 84.9% vs. 54.5%, P = 0.001) [Figure 6A]. Similarly, patients with low preoperative CAR achieved improved DFS (3-year DFS rate: 63.8% vs. 54.5%, P = 0.040) [Figure 6B]. Regarding OS, patients with low baseline NLR also demonstrated superior survival (3-year OS rate:
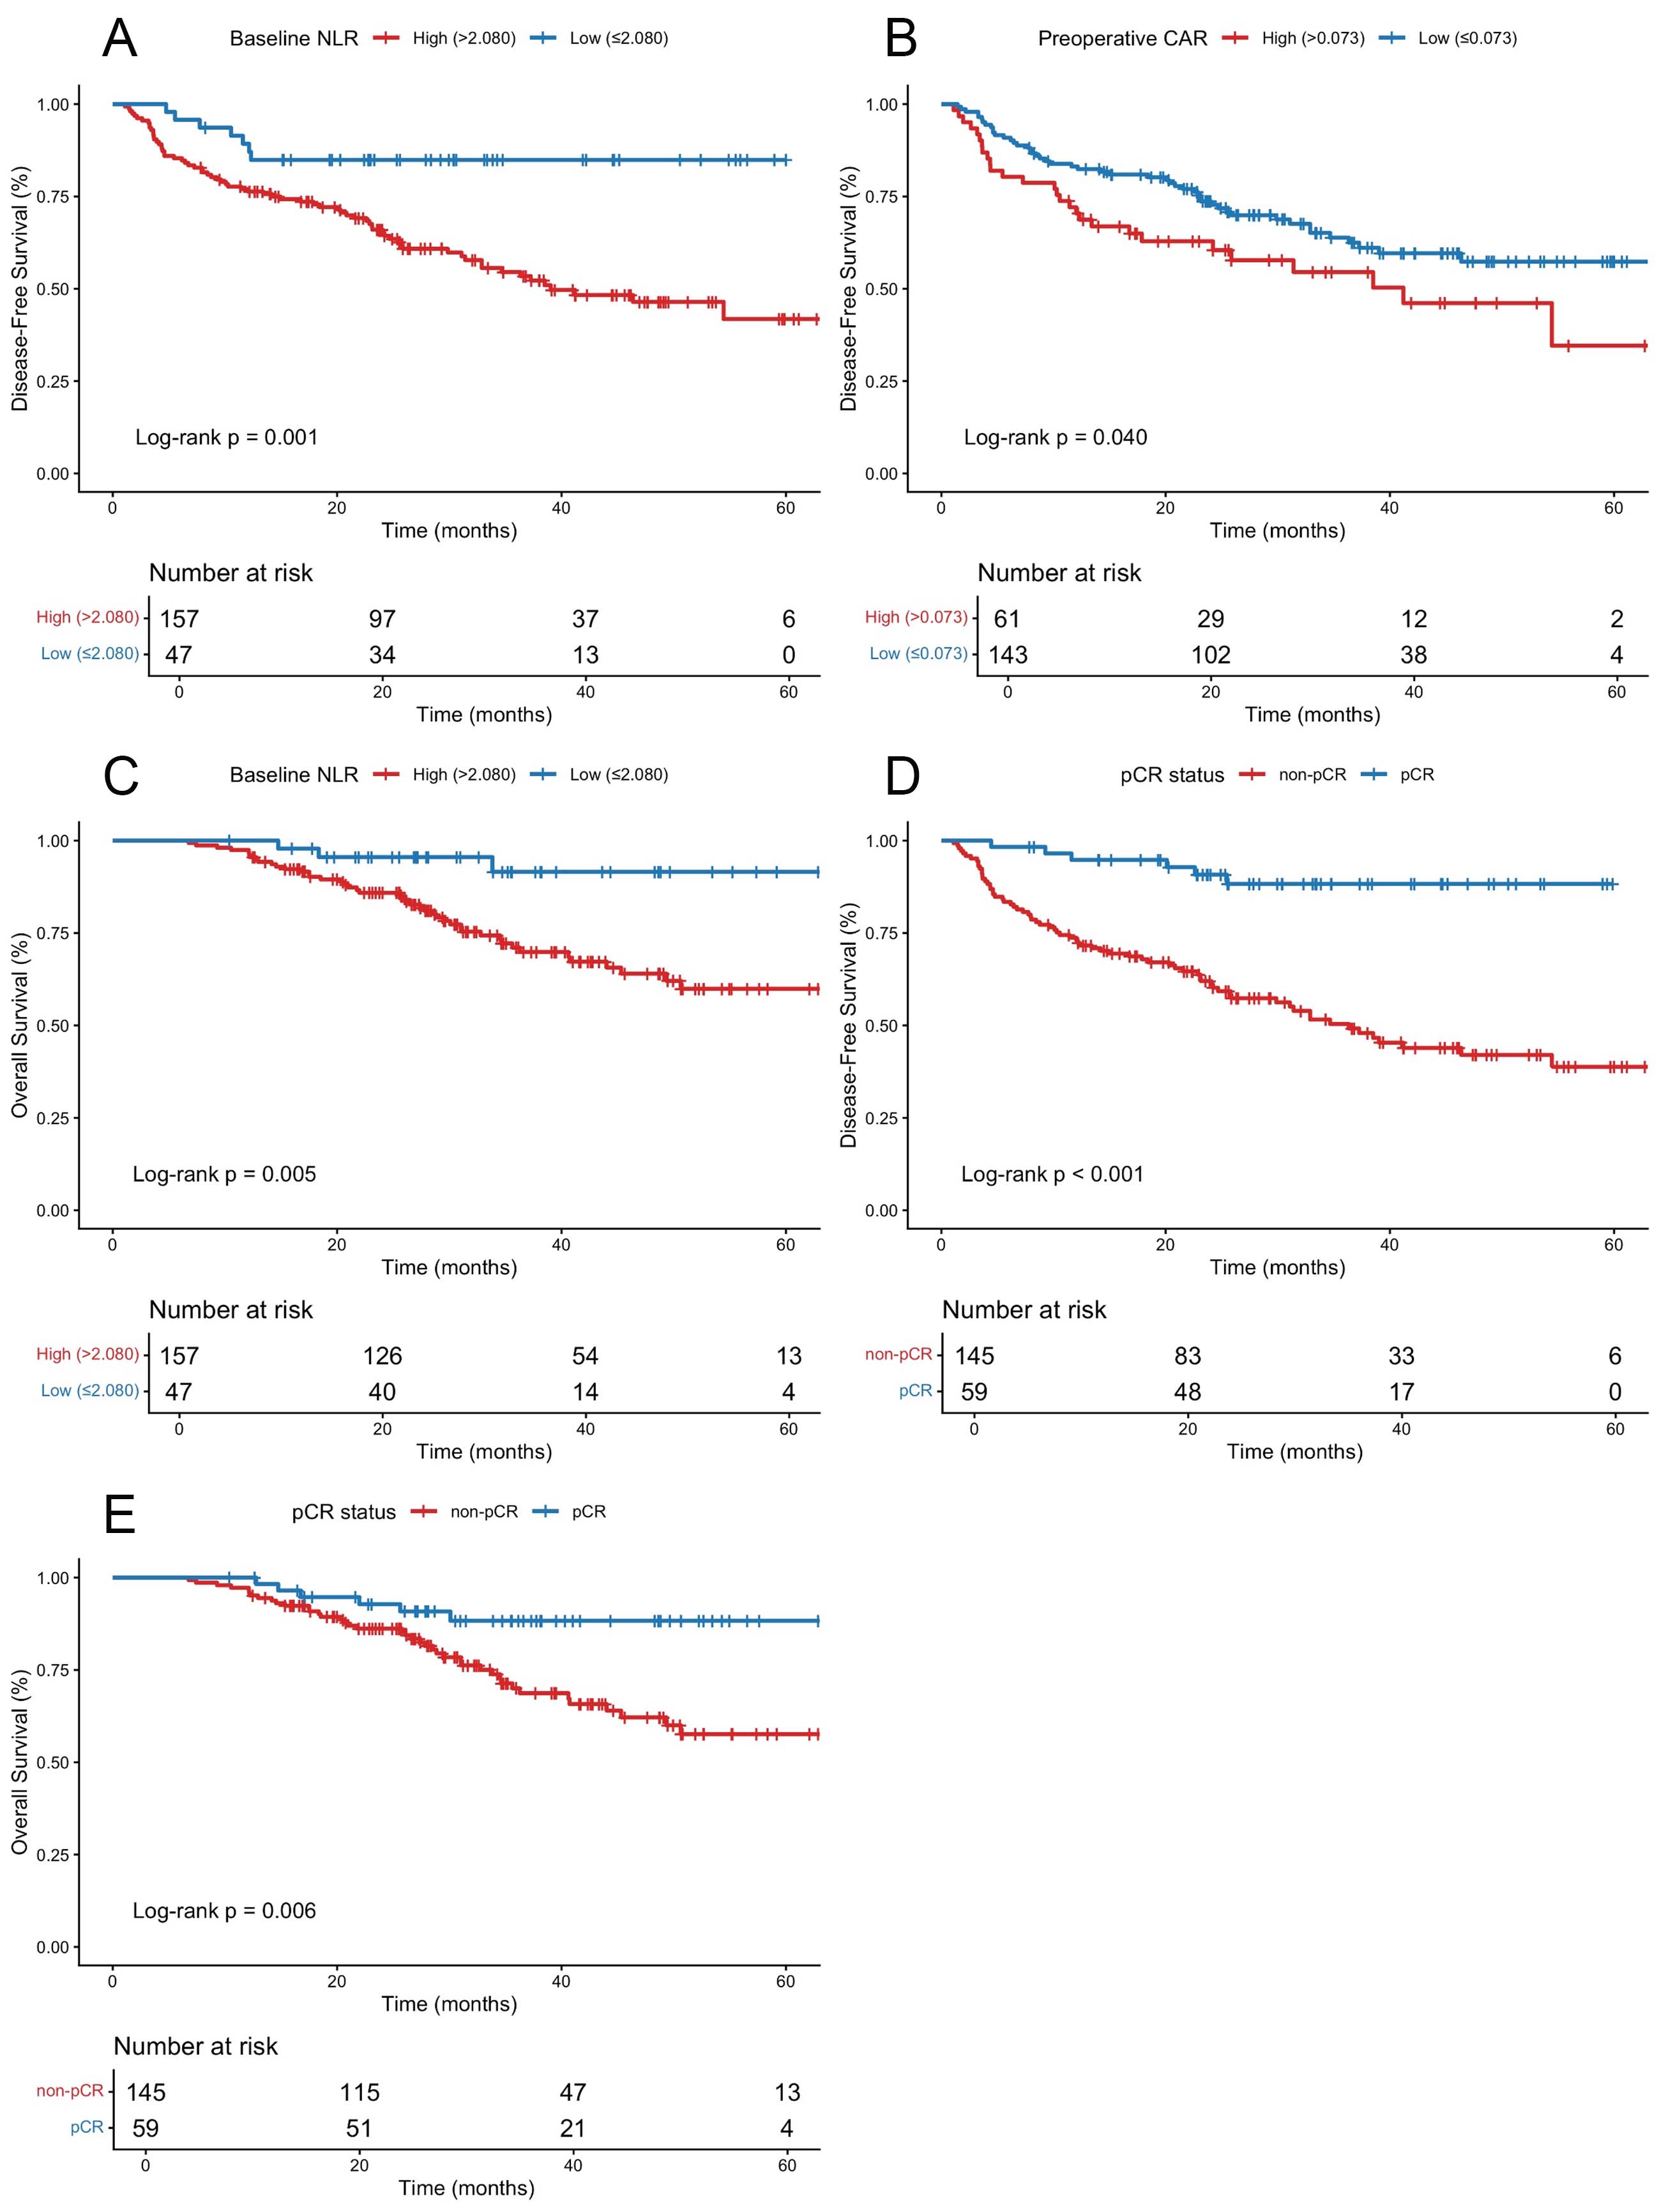
Figure 6. Kaplan-Meier survival curves for patients with locally advanced esophageal squamous cell carcinoma (LA-ESCC) stratified by hematologic markers and pathological complete response (pCR). (A) Disease-free survival (DFS) stratified by baseline neutrophil-to-lymphocyte ratio (NLR). (B) DFS stratified by preoperative C-reactive protein-to-albumin ratio (CAR). (C) Overall survival (OS) stratified by baseline NLR. DFS (D) and OS (E) stratified by pCR status.
In the univariate Cox proportional hazards analysis, female (P = 0.012), better tumor differentiation
UnIVAriate and multIVAriate analyses for DFS
| Variables | UnIVAriate analysis | UnIVAriate analyses | ||
| HR (95%CI) | P-value | HR (95%CI) | P-value | |
| Sex (female vs. male) | 0.344 (0.149-0.792) | 0.012 | 0.404 (0.174-0.934) | 0.034 |
| Age, years (≥ 60 vs. < 60) | 1.273 (0.807-2.009) | 0.300 | ||
| ECOG-PS (1/2 vs. 0) | 1.342 (0.707-2.546) | 0.368 | ||
| Smoking history (yes vs. no) | 1.611 (0.988-2.625) | 0.056 | ||
| BMI, kg/m2 | 0.792 | |||
| < 18.5 | reference | |||
| 18.5-24.9 | 0.793 (0.404-1.560) | 0.502 | ||
| ≥ 25 | 0.854 (0.372-1.953) | 0.708 | ||
| Differentiation (poor vs. well/moderate) | 1.618 (1.034-2.532) | 0.035 | 1.363 (0.867-2.144) | 0.180 |
| Tumor location | 0.143 | |||
| Upper thoracic | reference | |||
| Middle thoracic | 1.147 (0.558-2.369) | 0.708 | ||
| Lower thoracic | 1.791 (0.837-3.832) | 0.133 | ||
| T stage | 0.770 | |||
| 1/2 | reference | |||
| 3 | 1.248 (0.676-2.302) | 0.479 | ||
| 4 | 1.189 (0.559-2.529) | 0.654 | ||
| N stage | 0.053 | |||
| 0 | reference | |||
| 1 | 2.071 (0.617-6.952) | 0.239 | ||
| 2 | 2.124 (0.650-6.940) | 0.212 | ||
| 3 | 3.840 (1.139-12.950) | 0.030 | ||
| cTNM stage | 0.078 | |||
| II | reference | |||
| III | 1.324 (0.637-2.750) | 0.452 | ||
| IVA | 2.060 (0.980-4.331) | 0.057 | ||
| Chemotherapy regimen (taxane/fluoropyrimidine vs. taxane/platinum) | 1.516 (0.967-2.376) | 0.070 | ||
| PD-1 inhibitor (camrelizumab vs. others) | 0.673 (0.426-1.061) | 0.088 | ||
| nICT cycles (≤ 2 vs. > 2) | 0.849(0.531-1.359) | 0.496 | ||
| Interval from last therapy to surgery, weeks (≤ 6 vs. > 6) | 1.043 (0.662-1.643) | 0.856 | ||
| pCR (yes vs. no) | 0.169 (0.074-0.390) | < 0.001 | 0.245 (0.104-0.580) | 0.001 |
| Adjuvant treatment (yes vs. no) | 1.262 (0.741-2.149) | 0.395 | ||
| Baseline NLR (low vs. high) | 0.296 (0.136-0.643) | 0.002 | 0.448 (0.202-0.993) | 0.047 |
| Baseline PLR (low vs. high) | 0.627 (0.322-1.219) | 0.169 | ||
| Baseline LMR (low vs. high) | 1.550 (0.976-2.463) | 0.063 | ||
| Baseline CAR (low vs. high) | 0.760 (0.485-1.191) | 0.231 | ||
| Preoperative NLR (low vs. high) | 0.654 (0.418-1.024) | 0.063 | ||
| Preoperative PLR (low vs. high) | 0.961 (0.613-1.508) | 0.863 | ||
| Preoperative LMR (low vs. high) | 1.793 (0.923-3.485) | 0.085 | ||
| Preoperative CAR (low vs. high) | 0.617 (0.388-0.983) | 0.042 | 0.719 (0.449-1.151) | 0.169 |
When OS was analyzed as the endpoint, pCR (P = 0.009) and low baseline NLR (P = 0.011) were significantly associated with longer OS in univariate analysis. In multivariate analysis, pCR (HR = 0.413, 95%CI: 0.173-0.986, P = 0.046) and low baseline NLR (HR = 0.281, 95%CI: 0.086-0.920, P = 0.036) remained independently associated with longer OS [Table 5]. Schoenfeld residual testing also showed no significant violation of the proportional hazards assumption for the final OS model, with a global P-value of 0.392.
UnIVAriate and multIVAriate analyses for OS
| Variables | UnIVAriate analysis | MultIVAriate analyses | ||
| HR (95%CI) | P-value | HR (95%CI) | P-value | |
| Sex (female vs. male) | 0.511 (0.201-1.295) | 0.157 | ||
| Age, years (≥ 60 vs. < 60) | 1.232 (0.687-2.208) | 0.484 | ||
| ECOG-PS (1/2 vs. 0) | 1.279 (0.571-2.865) | 0.550 | ||
| Smoking history (yes vs. no) | 1.118 (0.617-2.027) | 0.714 | ||
| BMI, kg/m2 | 0.870 | |||
| < 18.5 | reference | |||
| 18.5-24.9 | 0.972 (0.379-2.492) | 0.953 | ||
| ≥ 25 | 1.190 (0.398-3.556) | 0.755 | ||
| Differentiation (poor vs. well/moderate) | 1.103 (0.616-1.976) | 0.742 | ||
| Tumor location | 0.085 | |||
| Upper thoracic | reference | |||
| Middle thoracic | 1.165 (0.444-3.057) | 0.756 | ||
| Lower thoracic | 2.244 (0.832-6.057) | 0.111 | ||
| T stage | 0.851 | |||
| 1/2 | reference | |||
| 3 | 0.849 (0.410-1.758) | 0.659 | ||
| 4 | 1.010 (0.420-2.428) | 0.981 | ||
| N stage | 0.473 | |||
| 0 | reference | |||
| 1 | 2.436 (0.559-10.607) | 0.236 | ||
| 2 | 1.865 (0.434-8.023) | 0.402 | ||
| 3 | 2.634 (0.576-12.042) | 0.212 | ||
| cTNM stage | 0.465 | |||
| II | reference | |||
| III | 1.261 (0.512-3.106) | 0.614 | ||
| IVA | 1.685 (0.669-4.248) | 0.268 | ||
| Chemotherapy regimen (taxane/fluoropyrimidine vs. taxane/platinum) | 0.874 (0.477-1.601) | 0.663 | ||
| PD-1 inhibitor (camrelizumab vs. others) | 1.014 (0.548-1.877) | 0.964 | ||
| nICT cycles (≤ 2 vs. > 2) | 1.515 (0.642-3.579) | 0.343 | ||
| Interval from last therapy to surgery, weeks (≤ 6 vs. > 6) | 1.081 (0.602-1.941) | 0.793 | ||
| pCR (yes vs. no) | 0.321 (0.136-0.757) | 0.009 | 0.413 (0.173-0.986) | 0.046 |
| Adjuvant treatment (yes vs. no) | 0.757 (0.338-1.699) | 0.500 | ||
| Baseline NLR (low vs. high) | 0.218 (0.068-0.703) | 0.011 | 0.281 (0.086-0.920) | 0.036 |
| Baseline PLR (low vs. high) | 0.874 (0.408-1.871) | 0.729 | ||
| Baseline LMR (low vs. high) | 1.120 (0.605-2.073) | 0.719 | ||
| Baseline CAR (low vs. high) | 0.844 (0.473-1.506) | 0.567 | ||
| Preoperative NLR (low vs. high) | 0.711 (0.401-1.262) | 0.244 | ||
| Preoperative PLR (low vs. high) | 1.095 (0.614-1.952) | 0.759 | ||
| Preoperative LMR (low vs. high) | 1.829 (0.776-4.310) | 0.168 | ||
| Preoperative CAR (low vs. high) | 0.601 (0.331-1.092) | 0.095 | ||
DISCUSSION
Preoperative nICT followed by radical esophagectomy has rapidly emerged as an important therapeutic strategy in the management of LA-ESCC. Although nICT has achieved encouraging pCR rates and survival outcomes, reliable and easily accessible biomarkers for predicting treatment response and long-term outcomes remain limited[40,41]. Cancer-related inflammation reflects complex interactions between local immune responses in the tumor microenvironment and systemic inflammatory responses in the host, both of which may influence tumor progression, treatment sensitivity, and clinical outcomes[28,42]. In this context, inflammation-related hematologic indices have gained increasing attention as potential prognostic and predictive tools in multiple malignancies. Compared with tissue-based, molecular, and imaging biomarkers, these indices are inexpensive, easily accessible, repeatable, and suitable for dynamic monitoring during treatment[31-37]. However, most previous studies have primarily focused on baseline hematologic indices, without assessing their dynamic changes during treatment or their associations with long-term clinical outcomes.
In this study, we analyzed hematologic indicators at two time points—baseline and preoperative—to investigate their associations with short-term response and long-term survival in LA-ESCC patients receiving nICT. To our knowledge, few studies have comprehensively assessed both baseline and preoperative hematologic indicators in this setting. Our findings reveal that low baseline NLR, low preoperative NLR, low preoperative CAR, early cTNM stage, and better tumor differentiation were independently associated with a higher probability of achieving pCR, whereas low baseline NLR, female, and pCR were independently associated with longer DFS. Furthermore, low baseline NLR and pCR were independently associated with longer OS.
At the peripheral blood level, NLR reflects the balance between neutrophil-mediated tumor-promoting inflammation and lymphocyte-mediated antitumor immunity. NEUTs promote angiogenesis, tumor proliferation, and metastasis through inflammatory mediators[43], while LYMs—especially tumor-infiltrating lymphocytes—play a pivotal role in antitumor immunity[44]. Therefore, a lower NLR may indicate a more favorable systemic immune status and a relatively preserved antitumor immune response. Previous studies have reported that elevated NLR is associated with poorer survival and inferior pathological response in esophageal cancer[31,36,45-48]. Consistent with these findings, our study showed that low baseline NLR was associated with both higher pCR probability and better long-term survival. Moreover, low preoperative NLR was also independently associated with pCR, suggesting that inflammatory status after nICT may provide additional information regarding treatment response beyond baseline inflammation alone.
CAR may represent a combined state of inflammation and nutritional condition. Elevated CRP levels, regulated primarily by interleukin-6, indicate systemic inflammation and are associated with poor prognosis[49-51], whereas hypoalbuminemia reflects nutritional impairment and chronic inflammation, both of which contribute to unfavorable clinical outcomes[52,53]. In this study, low preoperative CAR was independently associated with pCR, suggesting that the inflammatory-nutritional status after nICT may be closely related to pathological response. However, preoperative CAR was not an independent prognostic factor in multivariable Cox analysis, which may be partly explained by the stronger prognostic influence of pCR and baseline NLR, as well as the overlap among inflammatory and nutritional markers.
Although tissue-based and molecular biomarkers may provide more direct information on the tumor immune microenvironment, their predictive value in ESCC patients receiving nICT remains inconsistent. For example, exploratory analyses from previous neoadjuvant chemoimmunotherapy studies in LA-ESCC showed that PD-L1 expression status was not always significantly associated with pathological tumor regression, regardless of the method used to define PD-L1 positivity[14]. In addition, the clinical interpretation of PD-L1 expression may be affected by differences in detection platforms, scoring systems, cut-off values, sampling heterogeneity, and treatment settings[26]. These findings suggest that a single tumor-based biomarker may be insufficient to reliably predict response to chemoimmunotherapy. In this context, peripheral hematologic indicators such as NLR and CAR may provide complementary host-related information by reflecting systemic inflammation, immune status, and nutritional condition. However, these markers are indirect and nonspecific and should not be regarded as substitutes for tissue-based, imaging, or molecular biomarkers, such as PD-L1 expression, tumor-infiltrating lymphocytes, MSI status, TMB, or other immune-related genomic features.
Clinical stage and tumor differentiation were also important predictors of pCR. Neoadjuvant therapy aims to downstage tumors, increase the likelihood of R0 resection, and improve prognosis[54]. Previous studies have suggested that patients with earlier clinical stage and lower tumor burden are more likely to achieve pCR, whereas deeper tumor invasion or heavier nodal disease is associated with a lower pCR rate[55-57]. In the present study, cTNM stage, rather than cT or cN stage alone, was independently associated with pCR, suggesting that integrated staging may better reflect overall tumor burden and treatment sensitivity. Tumor differentiation was also independently associated with pCR, although previous studies have reported inconsistent findings regarding the direction of this association[55,58]. These discrepancies may be related to differences in study populations, treatment regimens, sample sizes, pathological grading criteria, and endpoint definitions. Nevertheless, our findings support the value of incorporating conventional clinicopathological factors into pCR prediction.
pCR is not only an important pathological endpoint for evaluating response to nICT but also a clinically relevant prognostic indicator. Previous prospective studies have reported pCR rates of approximately 25%-50% in LA-ESCC patients receiving nICT[13-15]. In our cohort, the pCR rate was 28.9%, which was broadly consistent with previous reports. Patients who achieved pCR had significantly better DFS and OS than those who did not, and pCR remained independently associated with improved survival in multivariable Cox analysis[7,59,60]. In addition, female was associated with improved DFS in this study, which is consistent with previous reports suggesting better outcomes among female patients with esophageal cancer[61,62]. Potential explanations include sex hormone-related protective effects, differences in tumor biology, and differences in exposure to risk factors such as smoking and alcohol consumption[63-65]. However, because the female subgroup was relatively small and residual confounding from smoking status, comorbidities, treatment selection, or tumor biological differences could not be completely excluded, this finding requires further validation.
Based on the independent predictors, we developed a nomogram incorporating tumor differentiation, cTNM stage, baseline NLR, preoperative NLR, and preoperative CAR to estimate the individualized probability of pCR after nICT. The model showed good discrimination, with an AUC of 0.816, and maintained acceptable performance after bootstrap internal validation. Compared with the clinical model including only tumor differentiation and cTNM stage, the full nomogram model demonstrated improved discrimination and prediction accuracy, as reflected by a higher bootstrap-corrected AUC and a lower Brier score. These findings suggest that baseline NLR, preoperative NLR, and preoperative CAR may provide incremental predictive information beyond conventional clinicopathological factors. In clinical practice, clinicians may use the nomogram to assign points for each predictor and calculate a total score to obtain the predicted probability of pCR. This individualized estimate may help identify patients with a relatively low probability of pCR, who may benefit from closer response assessment, more intensive perioperative monitoring, multidisciplinary discussion, consideration of postoperative adjuvant therapy, or enrollment in clinical trials. Given that these hematologic indicators are inexpensive, routinely available, and repeatable, the nomogram may serve as a practical adjunctive tool for individualized pCR prediction and perioperative risk stratification. However, it should be interpreted as an adjunct to, rather than a replacement for, clinical judgment, imaging evaluation, pathological assessment, and multidisciplinary decision-making.
Several limitations should be acknowledged. First, the retrospective design may have introduced selection bias. Because only patients who completed nICT and underwent curative R0 esophagectomy were included, the findings, particularly survival outcomes, should be interpreted within this selected surgical cohort and may not be generalizable to all patients who initiate nICT. Second, although internal validation demonstrated strong model performance, external validation using multicenter prospective cohorts is warranted to confirm its generalizability. Third, the Youden index-derived cut-off values were obtained from the same cohort, which may lead to overfitting and optimistic estimates, and dichotomization of continuous biomarkers may result in information loss. Fourth, hematologic indices may be affected by non-tumor-related factors, such as subclinical infection, medication use, treatment-related toxicity, nutritional status, or perioperative inflammation, and residual confounding could not be fully eliminated. Finally, this study did not include tissue-based or molecular biomarkers, such as PD-L1 expression, tumor-infiltrating lymphocytes, MSI status, or TMB; therefore, the relationship between peripheral inflammatory biomarkers and the tumor immune microenvironment could not be directly assessed. Future multicenter prospective studies integrating hematologic, pathological, molecular, and imaging biomarkers are warranted.
In summary, hematologic markers may provide a simple, cost-effective, and practical adjunctive approach to predict treatment response and prognosis in patients with LA-ESCC receiving nICT. Lower baseline NLR, lower preoperative NLR, lower preoperative CAR, earlier cTNM stage, and better tumor differentiation were independently associated with a higher probability of achieving pCR. Based on these factors, we developed and internally validated a hematologic indicator-based nomogram that may assist clinicians in individualized pCR prediction and perioperative risk stratification. Furthermore, low baseline NLR, female, and pCR were associated with longer DFS, whereas low baseline NLR and pCR were associated with longer OS, underscoring their importance in long-term outcome assessment among LA-ESCC patients undergoing nICT.
DECLARATION
Authors’ contributions
Writing - original draft: Xie Z
Methodology, data curation, visualization, formal analysis: Xie Z, Liu F
Investigation: Xie Z, Liu F, Tian J
Validation: Tian J, Yang J, Chi J
Project administration: Chen Y
Resource: Luo G
Conceptualization, Writing - review & editing, Supervision: Chen Y, Luo G
All authors have read and agreed to the published version of the manuscript.
Availability of data and materials
All data generated or analyzed during this study are included in this published article and its Supplementary Materials.
AI and AI-assisted tools statement
Not applicable.
Financial support and sponsorship
None.
Conflict of interest
All authors declared that there are no conflicts of interest.
Ethical approval and consent to participate
The study was carried out in compliance with the principles outlined in the Declaration of Helsinki and received approval from the Ethics Committee of Sun Yat-sen University Cancer Center (Approval No. B2025-776-01). The requirement for informed consent was waived by the institutional review board given the retrospective design and complete anonymization of all patient data.
Consent for publication
Not applicable.
Copyright
© The Author(s) 2026.
Supplementary Materials
REFERENCES
1. Bray F, Laversanne M, Sung H, et al. Global cancer statistics 2022: GLOBOCAN estimates of incidence and mortality worldwide for 36 cancers in 185 countries. CA Cancer J Clin. 2024;74:229-63.
2. Yang S, Lin S, Li N, et al. Burden, trends, and risk factors of esophageal cancer in China from 1990 to 2017: an up-to-date overview and comparison with those in Japan and South Korea. J Hematol Oncol. 2020;13:146.
3. Thrumurthy SG, Chaudry MA, Thrumurthy SSD, Mughal M. Oesophageal cancer: risks, prevention, and diagnosis. BMJ. ;2019:l4373.
5. Ajani JA, D’amico TA, Bentrem DJ, et al. Esophageal and esophagogastric junction cancers, version 2.2023, NCCN clinical practice guidelines in oncology. J Natl Compr Canc Netw. 2023;21:393-422.
6. Yang H, Liu H, Chen Y, et al. Long-term efficacy of neoadjuvant chemoradiotherapy plus surgery for the treatment of locally advanced esophageal squamous cell carcinoma: the NEOCRTEC5010 randomized clinical trial. JAMA Surg. 2021;156:721.
7. Eyck BM, Van Lanschot JJB, Hulshof MCCM, et al. Ten-year outcome of neoadjuvant chemoradiotherapy plus surgery for esophageal cancer: the randomized controlled CROSS trial. J Clin Oncol. 2021;39:1995-2004.
8. Doki Y, Ajani JA, Kato K, et al. Nivolumab combination therapy in advanced esophageal squamous-cell carcinoma. N Engl J Med. 2022;386:449-62.
9. Sun J, Shen L, Shah MA, et al. Pembrolizumab plus chemotherapy versus chemotherapy alone for first-line treatment of advanced oesophageal cancer (KEYNOTE-590): a randomised, placebo-controlled, phase 3 study. Lancet. 2021;398:759-71.
10. Luo H, Lu J, Bai Y, et al. Effect of camrelizumab vs placebo added to chemotherapy on survival and progression-free survival in patients with advanced or metastatic esophageal squamous cell carcinoma: the ESCORT-1st randomized clinical trial. JAMA. 2021;326:916.
11. Wang Z, Cui C, Yao J, et al. Toripalimab plus chemotherapy in treatment-naïve, advanced esophageal squamous cell carcinoma (JUPITER-06): a multi-center phase 3 trial. Cancer Cell. 2022;40:277-88.e3.
12. Lu Z, Wang J, Shu Y, et al. Sintilimab versus placebo in combination with chemotherapy as first line treatment for locally advanced or metastatic oesophageal squamous cell carcinoma (ORIENT-15): multicentre, randomised, double blind, phase 3 trial. BMJ. 2022;377:e068714.
13. Yan X, Duan H, Ni Y, et al. Tislelizumab combined with chemotherapy as neoadjuvant therapy for surgically resectable esophageal cancer: a prospective, single-arm, phase II study (TD-NICE). Int J Surg. 2022;103:106680.
14. Liu J, Yang Y, Liu Z, et al. Multicenter, single-arm, phase II trial of camrelizumab and chemotherapy as neoadjuvant treatment for locally advanced esophageal squamous cell carcinoma. J Immunother Cancer. 2022;10:e004291.
15. Yang W, Xing X, Yeung SJ, et al. Neoadjuvant programmed cell death 1 blockade combined with chemotherapy for resectable esophageal squamous cell carcinoma. J Immunother Cancer. 2022;10:e003497.
16. Shen J, Kong M, Yang H, et al. Pathological complete response after neoadjuvant treatment determines survival in esophageal squamous cell carcinoma patients (NEOCRTEC5010). Ann Transl Med. 2021;9:1516.
17. Meredith KL, Weber JM, Turaga KK, et al. Pathologic response after neoadjuvant therapy is the major determinant of survival in patients with esophageal cancer. Ann Surg Oncol. 2010;17:1159-67.
18. Lefler DS, Snook AE, Bashir B. Immune checkpoint inhibitors in luminal gastrointestinal malignancies: going beyond MSI-H/dMMR, TMB and PD-L1. Immunotherapy. 2022;14:885-902.
19. Borggreve AS, Goense L, Van Rossum PS, et al. Preoperative prediction of pathologic response to neoadjuvant chemoradiotherapy in patients with esophageal cancer using 18F-FDG PET/CT and DW-MRI: a prospective multicenter study. Int J Radiat Oncol Biol Phys. 2020;106:998-1009.
20. Vollenbrock SE, Voncken FEM, Van Dieren JM, et al. Diagnostic performance of MRI for assessment of response to neoadjuvant chemoradiotherapy in oesophageal cancer. Br J Surg. 2019;106:596-605.
21. Song X, Liu J, Li H, et al. Enhancing prediction for tumor pathologic response to neoadjuvant immunochemotherapy in locally advanced esophageal cancer by dynamic parameters from clinical assessments. Cancers. 2023;15:4377.
22. Zhang G, Yuan J, Pan C, et al. Multi-omics analysis uncovers tumor ecosystem dynamics during neoadjuvant toripalimab plus nab-paclitaxel and S-1 for esophageal squamous cell carcinoma: a single-center, open-label, single-arm phase 2 trial. eBioMedicine. 2023;90:104515.
23. Wang C, Xie G, Jia M, et al. Single-cell profiling identifies biomarkers for immunochemotherapy in esophageal squamous cell carcinoma. Cancer Lett. 2025;633:217988.
24. Yu C, Bian Y, Gao Y, et al. Machine learning-based lactate-related genes signature predicts clinical outcomes and unveils novel therapeutic targets in esophageal squamous cell carcinoma. Cancer Lett. 2025;613:217458.
25. Li S, Liang H, Li G. Predictive biomarkers for immunotherapy in gastric cancer. J Cancer Metastasis Treat. 2025;11:8.
26. Germanà E, Pepe L, Pizzimenti C, et al. Programmed cell death ligand 1 (PD-L1) immunohistochemical expression in advanced urothelial bladder carcinoma: an updated review with clinical and pathological implications. Int J Mol Sci. 2024;25:6750.
29. Xu S, Li X, Ma W. Redefining the tumor microenvironment with emerging therapeutic strategies. Oncol Res. 2024;32:1701-8.
30. Djaldetti M. Immunomodulatory and chemopreventive effects of resveratrol on the digestive system cancers. Oncol Res. 2024;32:1389-99.
31. Wu Y, Chen J, Zhao L, et al. Prediction of pathologic response to neoadjuvant chemoradiotherapy in patients with esophageal squamous cell carcinoma incorporating hematological biomarkers. Cancer Res Treat. 2021;53:172-83.
32. Cai G, Yu J, Meng X. Predicting prognosis and adverse events by hematologic markers in patients with locally advanced esophageal squamous cell carcinoma treated with neoadjuvant chemoradiotherapy. Cancer Manag Res. 2020;12:8497-507.
33. Zhao K, Wang C, Shi F, Li M, Yu J. Lymphocyte-monocyte ratio as a predictive marker for pathological complete response to neoadjuvant therapy in esophageal squamous cell carcinoma. Transl Cancer Res. 2020;9:3842-53.
34. Liu W, Ren S, Yang L, et al. The predictive role of hematologic markers in resectable NSCLC patients treated with neoadjuvant chemoimmunotherapy: a retrospective cohort study. Int J Surg. 2023;109:3519-26.
35. Zhang Y, Xiao G, Wang R. Clinical significance of systemic immune-inflammation index (SII) and C-reactive protein-to-albumin ratio (CAR) in patients with esophageal cancer: a meta-analysis. Cancer Manag Res. 2019;11:4185-200.
36. Li X, Dai D, Chen B, Tang H, Xie X, Wei W. The value of neutrophil-to-lymphocyte ratio for response and prognostic effect of neoadjuvant chemotherapy in solid tumors: a systematic review and meta-analysis. J Cancer. 2018;9:861-71.
37. Hu Y, Wang S, Ding N, Li N, Huang J, Xiao Z. Platelet/Lymphocyte ratio is superior to neutrophil/lymphocyte ratio as a predictor of chemotherapy response and disease-free survival in luminal B-like (HER2-) breast cancer. Clin Breast Cancer. 2020;20:e403-9.
38. Rice TW, Ishwaran H, Ferguson MK, Blackstone EH, Goldstraw P. Cancer of the esophagus and esophagogastric junction: an eighth edition staging primer. J Thorac Oncol. 2017;12:36-42.
39. Kelly RJ, Ajani JA, Kuzdzal J, et al. Adjuvant nivolumab in resected esophageal or gastroesophageal junction cancer. N Engl J Med. 2021;384:1191-203.
40. Wang Z, Shao C, Wang Y, et al. Efficacy and safety of neoadjuvant immunotherapy in surgically resectable esophageal cancer: a systematic review and meta-analysis. Int J Surg. 2022;104:106767.
41. Yu Y, Meng F, Wei X, et al. Neoadjuvant chemotherapy combined with immunotherapy versus neoadjuvant chemoradiotherapy in patients with locally advanced esophageal squamous cell carcinoma. J Thorac Cardiovasc Surg. 2024;168:417-28.e3.
42. Diakos CI, Charles KA, Mcmillan DC, Clarke SJ. Cancer-related inflammation and treatment effectiveness. Lancet Oncol. 2014;15:e493-503.
43. Hedrick CC, Malanchi I. Neutrophils in cancer: heterogeneous and multifaceted. Nat Rev Immunol. 2021;22:173-87.
44. Mohme M, Riethdorf S, Pantel K. Circulating and disseminated tumour cells - mechanisms of immune surveillance and escape. Nat Rev Clin Oncol. 2016;14:155-67.
45. Zhang X, Gari A, Li M, et al. Combining serum inflammation indexes at baseline and post treatment could predict pathological efficacy to anti‑PD‑1 combined with neoadjuvant chemotherapy in esophageal squamous cell carcinoma. J Transl Med. 2022;20:61.
46. Han F, Liu Y, Cheng S, et al. Diagnosis and survival values of neutrophil-lymphocyte ratio (NLR) and red blood cell distribution width (RDW) in esophageal cancer. Clin Chim Acta. 2019;488:150-8.
47. Chen Y, Huang S, Chen R, et al. Predicting prognosis of locally advanced esophageal squamous cell carcinoma through early changes in neutrophil-to-lymphocyte ratio following neoadjuvant immunochemotherapy. J Thorac Dis. 2024;16:8230-9.
48. Song P, Yao Z, Song S, et al. Predicting pathological response of resectable esophageal squamous cell carcinoma to neoadjuvant anti-PD-1 with chemotherapy using serum inflammation indexes. Sci Rep. 2025;15:27914.
49. Heikkilä K, Ebrahim S, Lawlor DA. A systematic review of the association between circulating concentrations of C reactive protein and cancer. J Epidemiol Community Health. 2007;61:824-33.
50. Guthrie GJ, Roxburgh CS, Horgan PG, Mcmillan DC. Does interleukin-6 link explain the link between tumour necrosis, local and systemic inflammatory responses and outcome in patients with colorectal cancer? Cancer Treat Rev. 2013;39:89-96.
51. Fujiwara H, Suchi K, Okamura S, et al. Elevated serum CRP levels after induction chemoradiotherapy reflect poor treatment response in association with IL‐6 in serum and local tumor site in patients with advanced esophageal cancer. J Surg Oncol. 2010;103:62-8.
52. Miura K, Hamanaka K, Koizumi T, et al. Clinical significance of preoperative serum albumin level for prognosis in surgically resected patients with non-small cell lung cancer: Comparative study of normal lung, emphysema, and pulmonary fibrosis. Lung Cancer. 2017;111:88-95.
53. Christina NM, Tjahyanto T, Lie JG, et al. Hypoalbuminemia and colorectal cancer patients: Any correlation? Medicine. 2023;102:e32938.
54. Leng XF, Daiko H, Han YT, Mao YS. Optimal preoperative neoadjuvant therapy for resectable locally advanced esophageal squamous cell carcinoma. Ann N Y Acad Sci. 2020;1482:213-24.
55. Feng J, Wang L, Yang X, Chen Q, Cheng X. Prediction of pathologic complete response prediction in patients with locally advanced esophageal squamous cell carcinoma treated with neoadjuvant immunochemotherapy: A real-world study. Biomol Biomed. 2023;23:153-60.
56. Feng J, Wang L, Yang X, Chen Q, Cheng X. A novel immune-nutritional score predicts response to neoadjuvant immunochemotherapy after minimally invasive esophagectomy for esophageal squamous cell carcinoma. Front Immunol. 2023;14:1217967.
57. Han W, Weng K, Zhang P, Hong Z. Predictive value of systemic immune-inflammation index for pathological complete response in patients receiving neoadjuvant immunochemotherapy for locally advanced esophageal cancer. Front Surg. 2023;9:1091601.
58. Toxopeus ELA, Nieboer D, Shapiro J, et al. Nomogram for predicting pathologically complete response after neoadjuvant chemoradiotherapy for oesophageal cancer. Radiother Oncol. 2015;115:392-8.
59. Zhao J, Hao S, Tian J, Li Y, Han D. Comparison of neoadjuvant immunotherapy plus chemotherapy versus neoadjuvant chemoradiotherapy for patients with esophageal squamous cell carcinoma: a propensity score matching study. J Inflamm Res. 2023;16:3351-63.
60. Cools-Lartigue J, Markar S, Mueller C, et al. An international cohort study of prognosis associated with pathologically complete response following neoadjuvant chemotherapy versus chemoradiotherapy of surgical treated esophageal adenocarcinoma. Ann Surg. 2022;276:799-805.
61. Kauppila JH, Wahlin K, Lagergren P, Lagergren J. Sex differences in the prognosis after surgery for esophageal squamous cell carcinoma and adenocarcinoma. Int J Cancer. 2018;144:1284-91.
62. Rowse PG, Jaroszewski DE, Thomas M, Harold K, Harmsen WS, Shen KR. Sex disparities after induction chemoradiotherapy and esophagogastrectomy for esophageal cancer. Ann Thorac Surg. 2017;104:1147-52.
63. Sukocheva OA. Androgens and esophageal cancer: what do we know? World J Gastroenterol. 2015;21:6146.
64. He Y, Liang D, Du L, et al. Clinical characteristics and survival of 5283 esophageal cancer patients: A multicenter study from eighteen hospitals across six regions in China. Cancer Commun. 2020;40:531-44.
Cite This Article
How to Cite
Download Citation
Export Citation File:
Type of Import
Tips on Downloading Citation
Citation Manager File Format
Type of Import
Direct Import: When the Direct Import option is selected (the default state), a dialogue box will give you the option to Save or Open the downloaded citation data. Choosing Open will either launch your citation manager or give you a choice of applications with which to use the metadata. The Save option saves the file locally for later use.
Indirect Import: When the Indirect Import option is selected, the metadata is displayed and may be copied and pasted as needed.
About This Article
Copyright

Data & Comments
Data
0


Comments
Comments must be written in English. Spam, offensive content, impersonation, and private information will not be permitted. If any comment is reported and identified as inappropriate content by OAE staff, the comment will be removed without notice. If you have any queries or need any help, please contact us at [email protected].