


FAM gene expression predicts prognosis and immune microenvironment in microsatellite-stable colorectal cancer
 0
0 Abstract
Aim: The FAM (family with sequence similarity) gene family, implicated in various malignancies, remains underexplored in microsatellite-stable (MSS) colorectal cancer (CRC). MSS CRC represents the majority of CRC cases and lacks reliable prognostic biomarkers as well as effective immunotherapeutic strategies.
Methods: Transcriptome profiles and matched clinical data from The Cancer Genome Atlas-COADREAD cohort were used as a training set, while GSE29623 and GSE39582 served as independent validation cohorts. A prognostic signature (FAM gene Family-associated expression scoring (FAMscore)) was constructed based on FAM family genes using Multivariate-Cox regression. Associations between FAMscore, survival outcomes, tumor immune microenvironment features, and predicted drug sensitivity were explored through computational analyses.
Results: The FAMscore stratified MSS CRC patients into high- and low-risk groups with significantly different (P ≤ 0.05) overall survival (OS) in the training cohort and consistent trends in validation datasets. A high FAMscore was associated with an immunosuppressive tumor immune microenvironment, characterized by increased regulatory T cells and M2 macrophages. Exploratory analyses suggested differential predicted sensitivity to selected targeted agents.
Conclusions: FAMscore is associated with prognosis and immune landscape features in MSS CRC. These findings are exploratory and hypothesis-generating, and further experimental and prospective validation is required.
Keywords
INTRODUCTION
Colorectal cancer (CRC) remains one of the leading causes of cancer-related morbidity and mortality worldwide[1]. In addition to true primary CRC, recent molecular profiling studies have identified favorable subsets of cancers of unknown primary (CUP). Among them, a CRC-like CUP subtype has been recognized and is typically managed according to standard CRC treatment algorithms. This emerging entity may partially contribute to observed increases in CRC incidence reported in population-based registries[2]. Despite substantial advances in early screening, surgical techniques, and systemic therapies, the long-term survival of patients with advanced-stage disease remains unsatisfactory[3,4]. Molecular classification has revealed remarkable heterogeneity in CRC, among which microsatellite stability (MSS) accounts for the majority of cases. In contrast to microsatellite instability-high (MSI-H) tumors, which frequently exhibit favorable responses to immune checkpoint blockade, microsatellite-stable CRC (MSS CRC) generally demonstrates limited sensitivity to immunotherapeutic interventions[5,6]. MSS CRC exhibits a distinct tumor immune microenvironment (TME) that differs markedly from microsatellite instability-high tumors. MSS CRC is typically characterized by immune exclusion and limited cytotoxic T-cell infiltration. It is also enriched with immunosuppressive cell populations, including regulatory T cells (Tregs) and M2-polarized macrophages. These features collectively contribute to resistance to immune checkpoint blockade. Understanding transcriptomic features associated with these immune states may provide insight into prognostic heterogeneity within MSS CRC. Accumulating evidence suggests that the poor immunotherapeutic efficacy observed in MSS CRC is primarily attributable to its immunologically “cold” tumor microenvironment, characterized by low immune cell infiltration and impaired antitumor immune activation[7]. Therefore, identifying robust biomarkers capable of stratifying patient prognosis and reflecting immune landscape heterogeneity is of critical importance. Such biomarkers may facilitate individualized risk assessment and inform the development of more effective therapeutic strategies[8]. Importantly, discordant immunohistochemistry (IHC) results have been reported even in tumors harboring identical germline Mismatch Repair (MMR) mutations, potentially due to secondary somatic alterations affecting MMR protein expression[9,10].
The family with sequence similarity (FAM) genes represent a heterogeneous group involved in multiple cancers, including tumor progression[11], metabolic regulation[12], and immune modulation[13]. However, despite these emerging observations, the collective prognostic relevance of FAM family genes in MSS CRC has not been systematically investigated. We therefore conducted a data-driven evaluation of FAM gene expression patterns and their association with clinical outcomes in MSS CRC. Members of the FAM family have been linked to regulation of cell proliferation, migration and invasion, epithelial-mesenchymal transition (EMT), and therapy resistance, suggesting they act as modulators of tumor aggressiveness[11]. In CRC specifically, several FAM members show altered expression and functional effects: for example, FAM172A and FAM72A have been reported to influence CRC cell growth and survival pathways, with recent work implicating FAM72A in the suppression of pyroptosis via reactive oxygen species regulation and consequent promotion of proliferation and invasion[13]. Beyond cell-intrinsic effects, FAM genes are increasingly associated with the TME - correlating with patterns of immune cell infiltration, immune checkpoint expression and indices of immune responsiveness - which raises the possibility that FAM dysregulation may shape both tumor-intrinsic aggressiveness and anti-tumor immunity[12]. Pan-cancer and tumor-specific analyses further indicate that different FAM family members can have context-dependent (even opposing) roles across cancer types, underscoring the need for cancer-type-specific characterization before clinical translation[11].
The present study aims to systematically characterize the prognostic significance of FAM family genes in MSS CRC and to explore their associations with the TME using publicly available transcriptomic datasets.
MATERIALS AND METHODS
Data sources
A total of 432 MSS CRC tumor samples were initially identified in the TCGA (The Cancer Genome Atlas) COADREAD cohort. Among these, 24 samples were excluded from survival analyses due to incomplete OS information or missing follow-up data, resulting in 408 patients included in the final survival analysis. For analysis, the HTSeq (High-throughput sequence)-Fragments per Kilobase Million (FPKM) method was applied, and values were Log2-transformed for the TCGA-COADREAD dataset. The GSE29623 (mRNA and microRNA profile in colon cancer, GPL570, GPL1162) and GSE39582 (Gene expression Classification of Colon Cancer defines six molecular subtypes with distinct clinical, molecular and survival characteristics, GPL570) datasets were used as validation sets, with their expression data and clinical information downloaded from the official National Center for Biotechnology Information (NCBI) website (https://www.ncbi.nlm.nih.gov/) [Figure 1A].
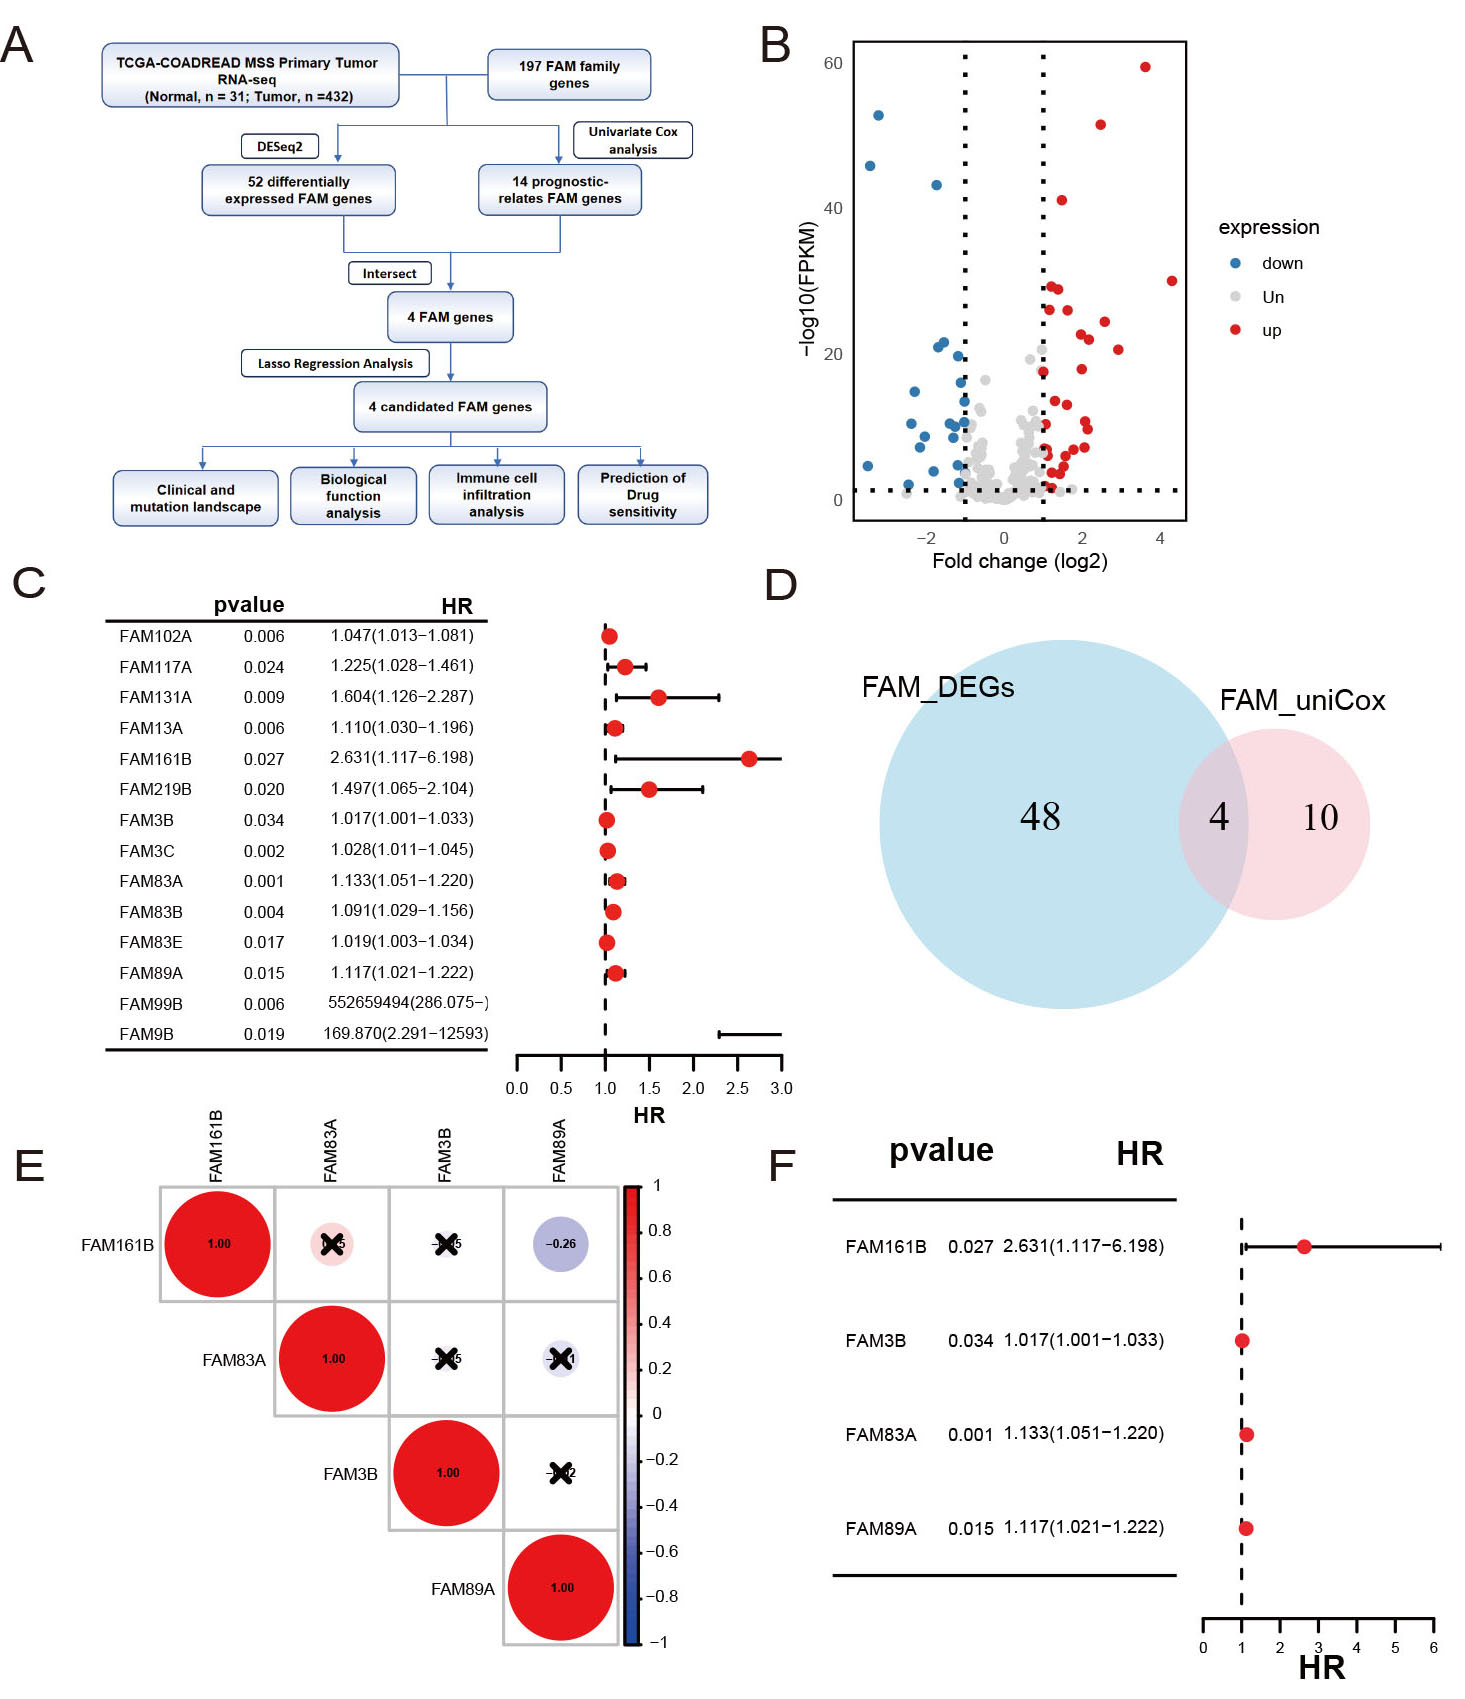
Figure 1. (A) Workflow of the study. (B) Volcano plot of differentially expressed FAM gene family members between tumor and normal tissues. (C) Forest plot of prognosis-related FAM genes. (D) Venn diagram showing the intersection between differentially expressed genes and prognosis-related FAM genes. (E) Heatmap of correlations among the four FAM genes. (F) Forest plot of the intersection FAM genes.
Model construction
To identify FAM family genes influencing CRC prognosis, univariate Cox regression was performed. Subsequently, Multivariate-Cox regression analysis, utilizing the "glmnet" R package (version 4.1-8), was conducted to identify key FAM family genes and their respective regression coefficients. This approach, which has been successfully applied in recent studies[14], revealed significant associations between these genes and the prognosis of CRC, with a stringent threshold of P ≤ 0.05[15].
Model formulae
The FAM gene family-associated expression scoring (FAMscore) for each patient was calculated using model equations derived from this analysis. Based on the median FAMscore, patients were categorized into high-risk and low-risk groups, and corresponding survival curves were plotted. To evaluate the model's predictive performance, principal component analysis (PCA) was performed using R software, and the concordance index (C-index) was calculated using the “pec” R package[16].
Independent prognostic analysis and nomogram construction
Univariate Cox regression analyses were performed to assess the independent prognostic value of the FAMscore[17-20]. Based on these findings, a nomogram was generated using the Regression Modeling Strategies R package (version 6.8-2), incorporating variables such as age, tumor stage, sex, and the FAMscore. These plots were designed to predict OS rates at 1, 3, and 5-year intervals for patients with CRC in the TCGA dataset.
Immunity analysis of the risk signature
Immune cell infiltration levels were estimated using CIBERSORT (Cell-type Identification by Estimating Relative Subsets of RNA Transcripts)[16,21]. This computational method quantifies the relative proportions of 22 immune cell types based on gene expression data. The algorithm was applied to compare immune infiltration patterns between the high-risk and low-risk groups. Additionally, single-sample Gene Set Enrichment Analysis (ssGSEA) was used to calculate enrichment scores for immune functions in patients with CRC. For each MSS CRC sample, we applied ESTIMATE (Estimation of STromal and Immune cells in MAlignant Tumor tissues using Expression data) to assess TME composition, generating immune and stromal scores and quantifying cellular infiltration[22].
This study compiled 29 cancer-immune-related gene sets from previously published research and we used Gene Set Variation Analysis (GSVA) to calculate enrichment scores and examine their association with high-risk and low-risk groups[23]. To forecast responses to immune checkpoint inhibitors (ICIs), we applied the Tumor Immune Dysfunction and Exclusion (TIDE) algorithm[24].
Somatic mutation analysis
We employed Maftools (v2.10.05), an R package for the analysis, visualization, and exploration of somatic mutation data in cancer research[25], Mutation Annotation Format (MAF) files were imported from multiple sources, including TCGA. The package was then used for mutation spectrum analysis and oncoplot visualization. The package also provides functions to extract detailed mutation information, including mutation frequency, type, and functional consequences[26].
Drug sensitivity
To explore variations in therapeutic responsiveness, patients with CRC were categorized into high- and low-risk subgroups according to the estimated half-maximal inhibitory concentration (IC50) values derived from the Genomics of Cancer Drug Sensitivity (GDSC) database (https://www.cancerrxgene.org/). The pRRophetic R package[27] was used to predict clinical chemotherapeutic responses based on tumor gene expression levels, employing statistical models developed from gene expression and drug sensitivity data across numerous cancer cell lines.
Statistical analysis
Statistical analyses were conducted using R software, version 4.4.1. Kaplan-Meier (KM) survival curves and the log-rank test were used to assess OS disparities between high-risk and low-risk groups. The FAM signature was constructed via Multivariate-Cox modeling. Based on the random forest model, the ROC (receiver operating characteristic) curve was constructed using 10-fold cross-validation. Moreover, the Wilcoxon test was used to compare tumor-infiltrating immune cell proportions, immune checkpoint levels, and immune functions between the two groups, providing a robust method for assessing statistical differences. All analyses in this study were conducted using retrospective public datasets, and no experimental or prospective validation was performed.
RESULTS
Differentially expressed keratin genes in CRC
We analyzed 197 FAM family genes in the TCGA-COADREAD dataset by comparing expression levels between tumor and normal colorectal tissues, identifying 52 differentially expressed genes (DEGs) comprising 30 upregulated and 22 downregulated genes [Figure 1B]. Additionally, 14 FAM genes were found to be associated with prognosis [Figure 1C]. Among these, four genes - FAM161B, FAM3B, FAM83A, and FAM89A - were identified as DEGs [Figure 1D]. No significant correlation was observed among these four genes [Figure 1E]. The hazard ratios (HRs) for all four genes exceeded 1 [Figure 1F], indicating that high expression of these genes correlates with poor prognosis.
Construction of the FAM gene prognosis signature
Multivariate-Cox analysis was performed on four potential FAM genes using MSS CRC data from TCGA [Figure 2A and B]. All four genes - FAM161B, FAM3B, FAM83A, and FAM89A - were included in the Cox risk model, with corresponding regression coefficients of 1.08, 0.02, 0.13, and 0.16, respectively. KM survival analysis indicated that high-risk patients exhibited worse prognoses compared to low-risk patients (P < 0.05) [Figure 2C]. The risk score for each patient was calculated using the formula: FAMscore = (1.08 × FAM161B expression level) + (0.02 × FAM3B expression level) + (0.13 × FAM83A expression level) + (0.16 × FAM89A expression level) for the entire cohort. Based on the median cut-off point, patients were divided into high-risk and low-risk groups, with higher risk scores correlating with an increased mortality rate
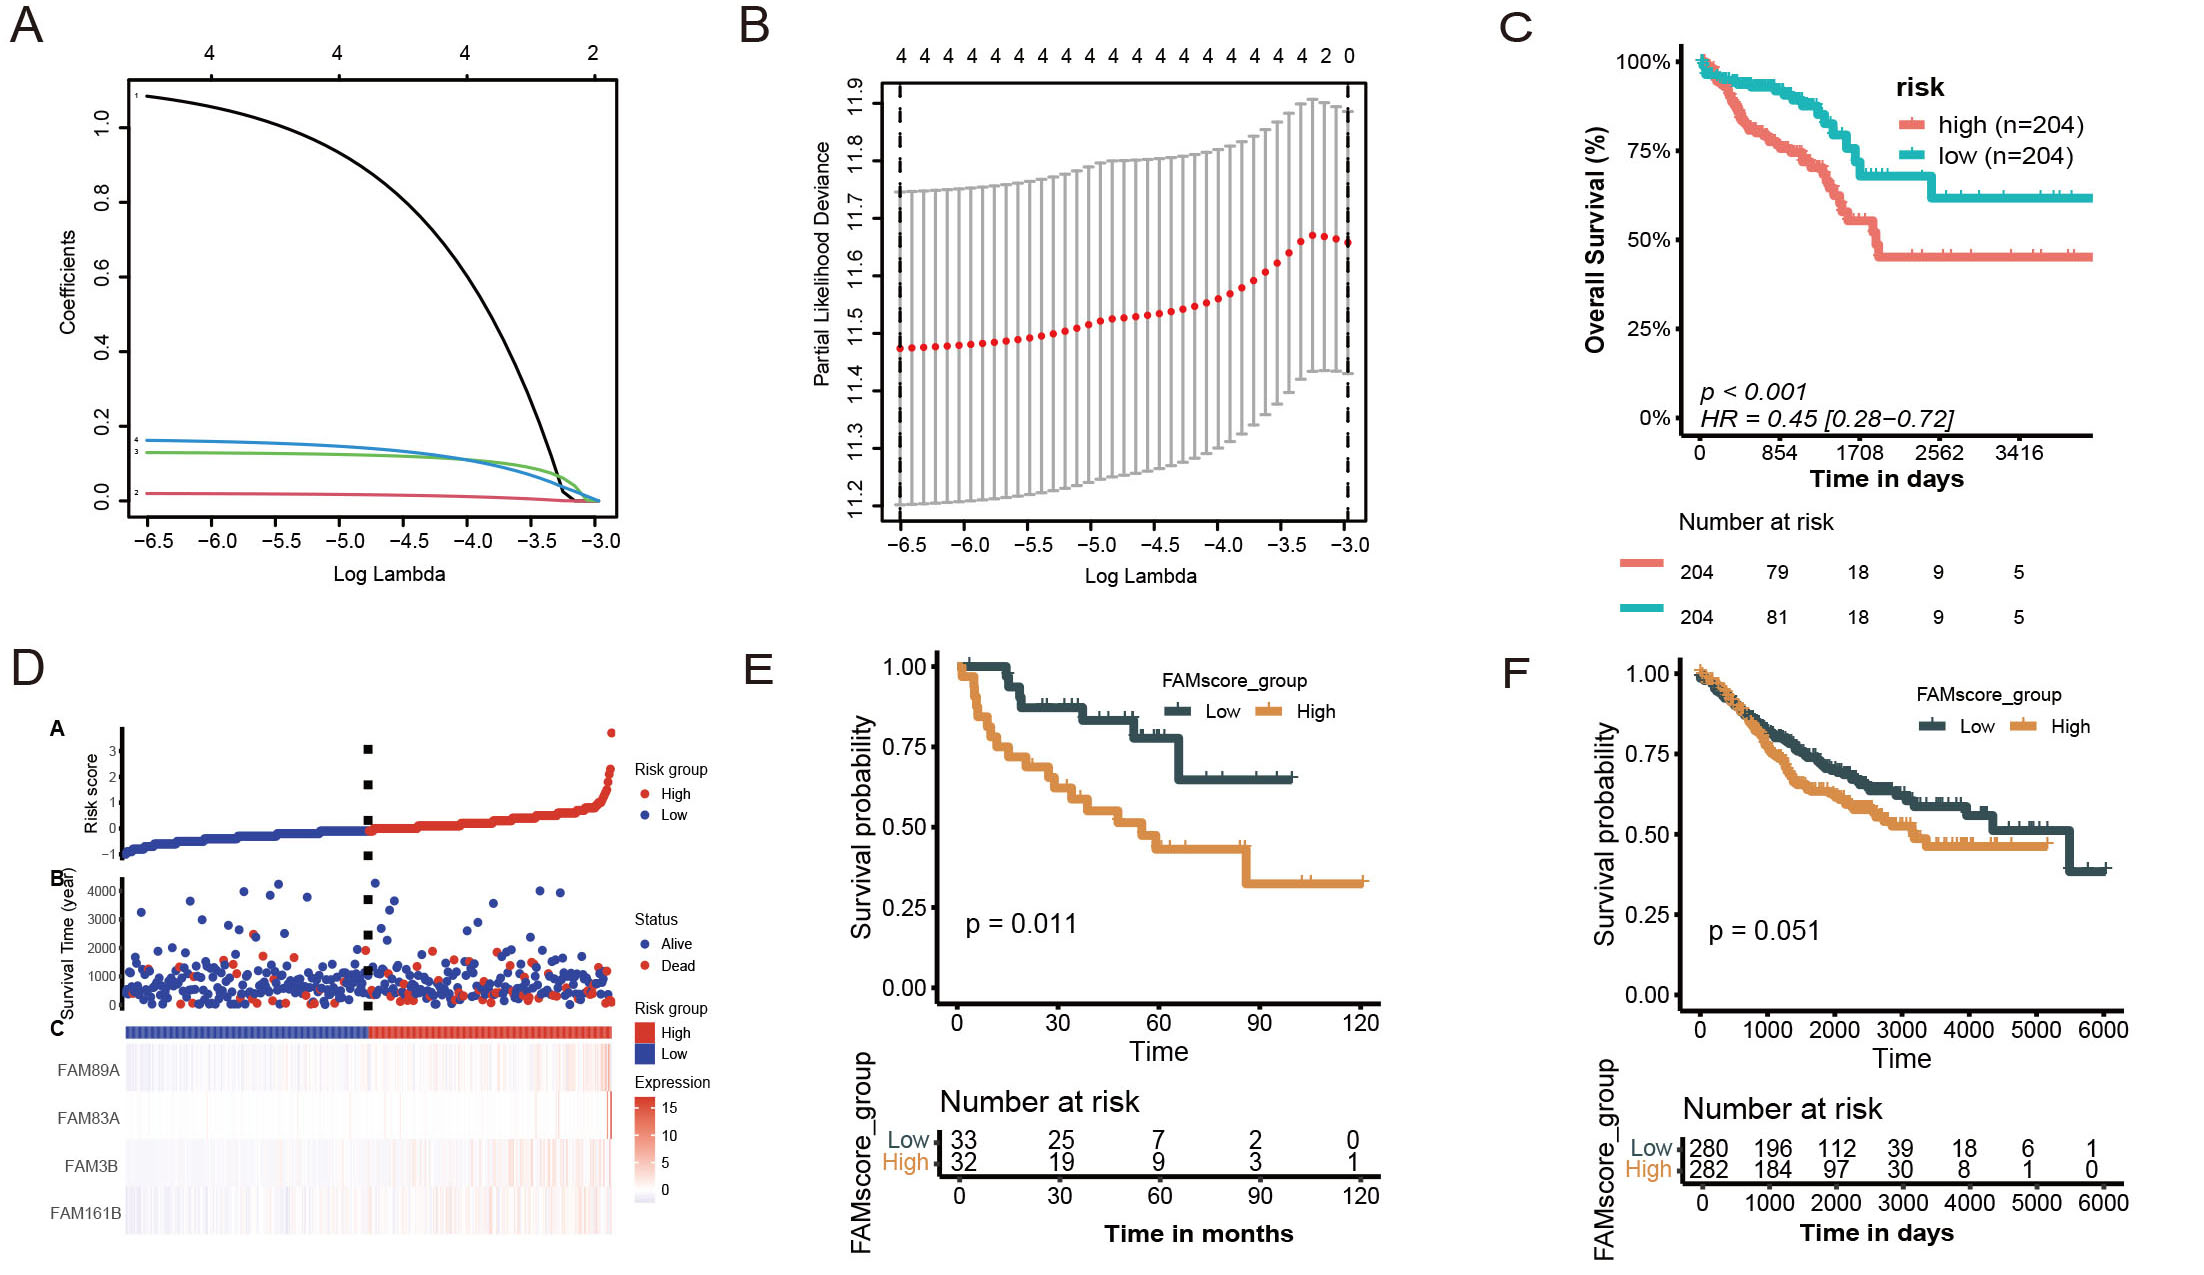
Figure 2. (A and B) Multivariate-Cox plots; (C and D) Training set results; (C) Kaplan-Meier curve of the TCGA dataset; (D) Risk factor plot; (E and F) Validation set results; (E) Kaplan-Meier curve of the GSE29623 dataset; (F) Kaplan-Meier curve of the GSE39582 dataset.
Validation of the FAMs prognostic model
In the GSE29623 training set, KM analysis validated our model, demonstrating that high-risk patients exhibited significantly worse prognoses than low-risk patients (P = 0.011), as depicted in Figure 2E. Consistently, similar trends were observed in the validation cohorts, although statistical significance in GSE39582 was borderline (P = 0.051), as presented in Figure 2F.
Establishing forest and nomograms in combination with clinical characteristics
Multivariate Cox analyses were performed to further assess the clinical applicability of our prognostic risk model, determining if the FAM gene-based signature could independently predict CRC prognosis. The results indicated that age, stage, and FAMscore were significantly correlated with CRC prognosis (P < 0.001), as depicted in Figure 3A.
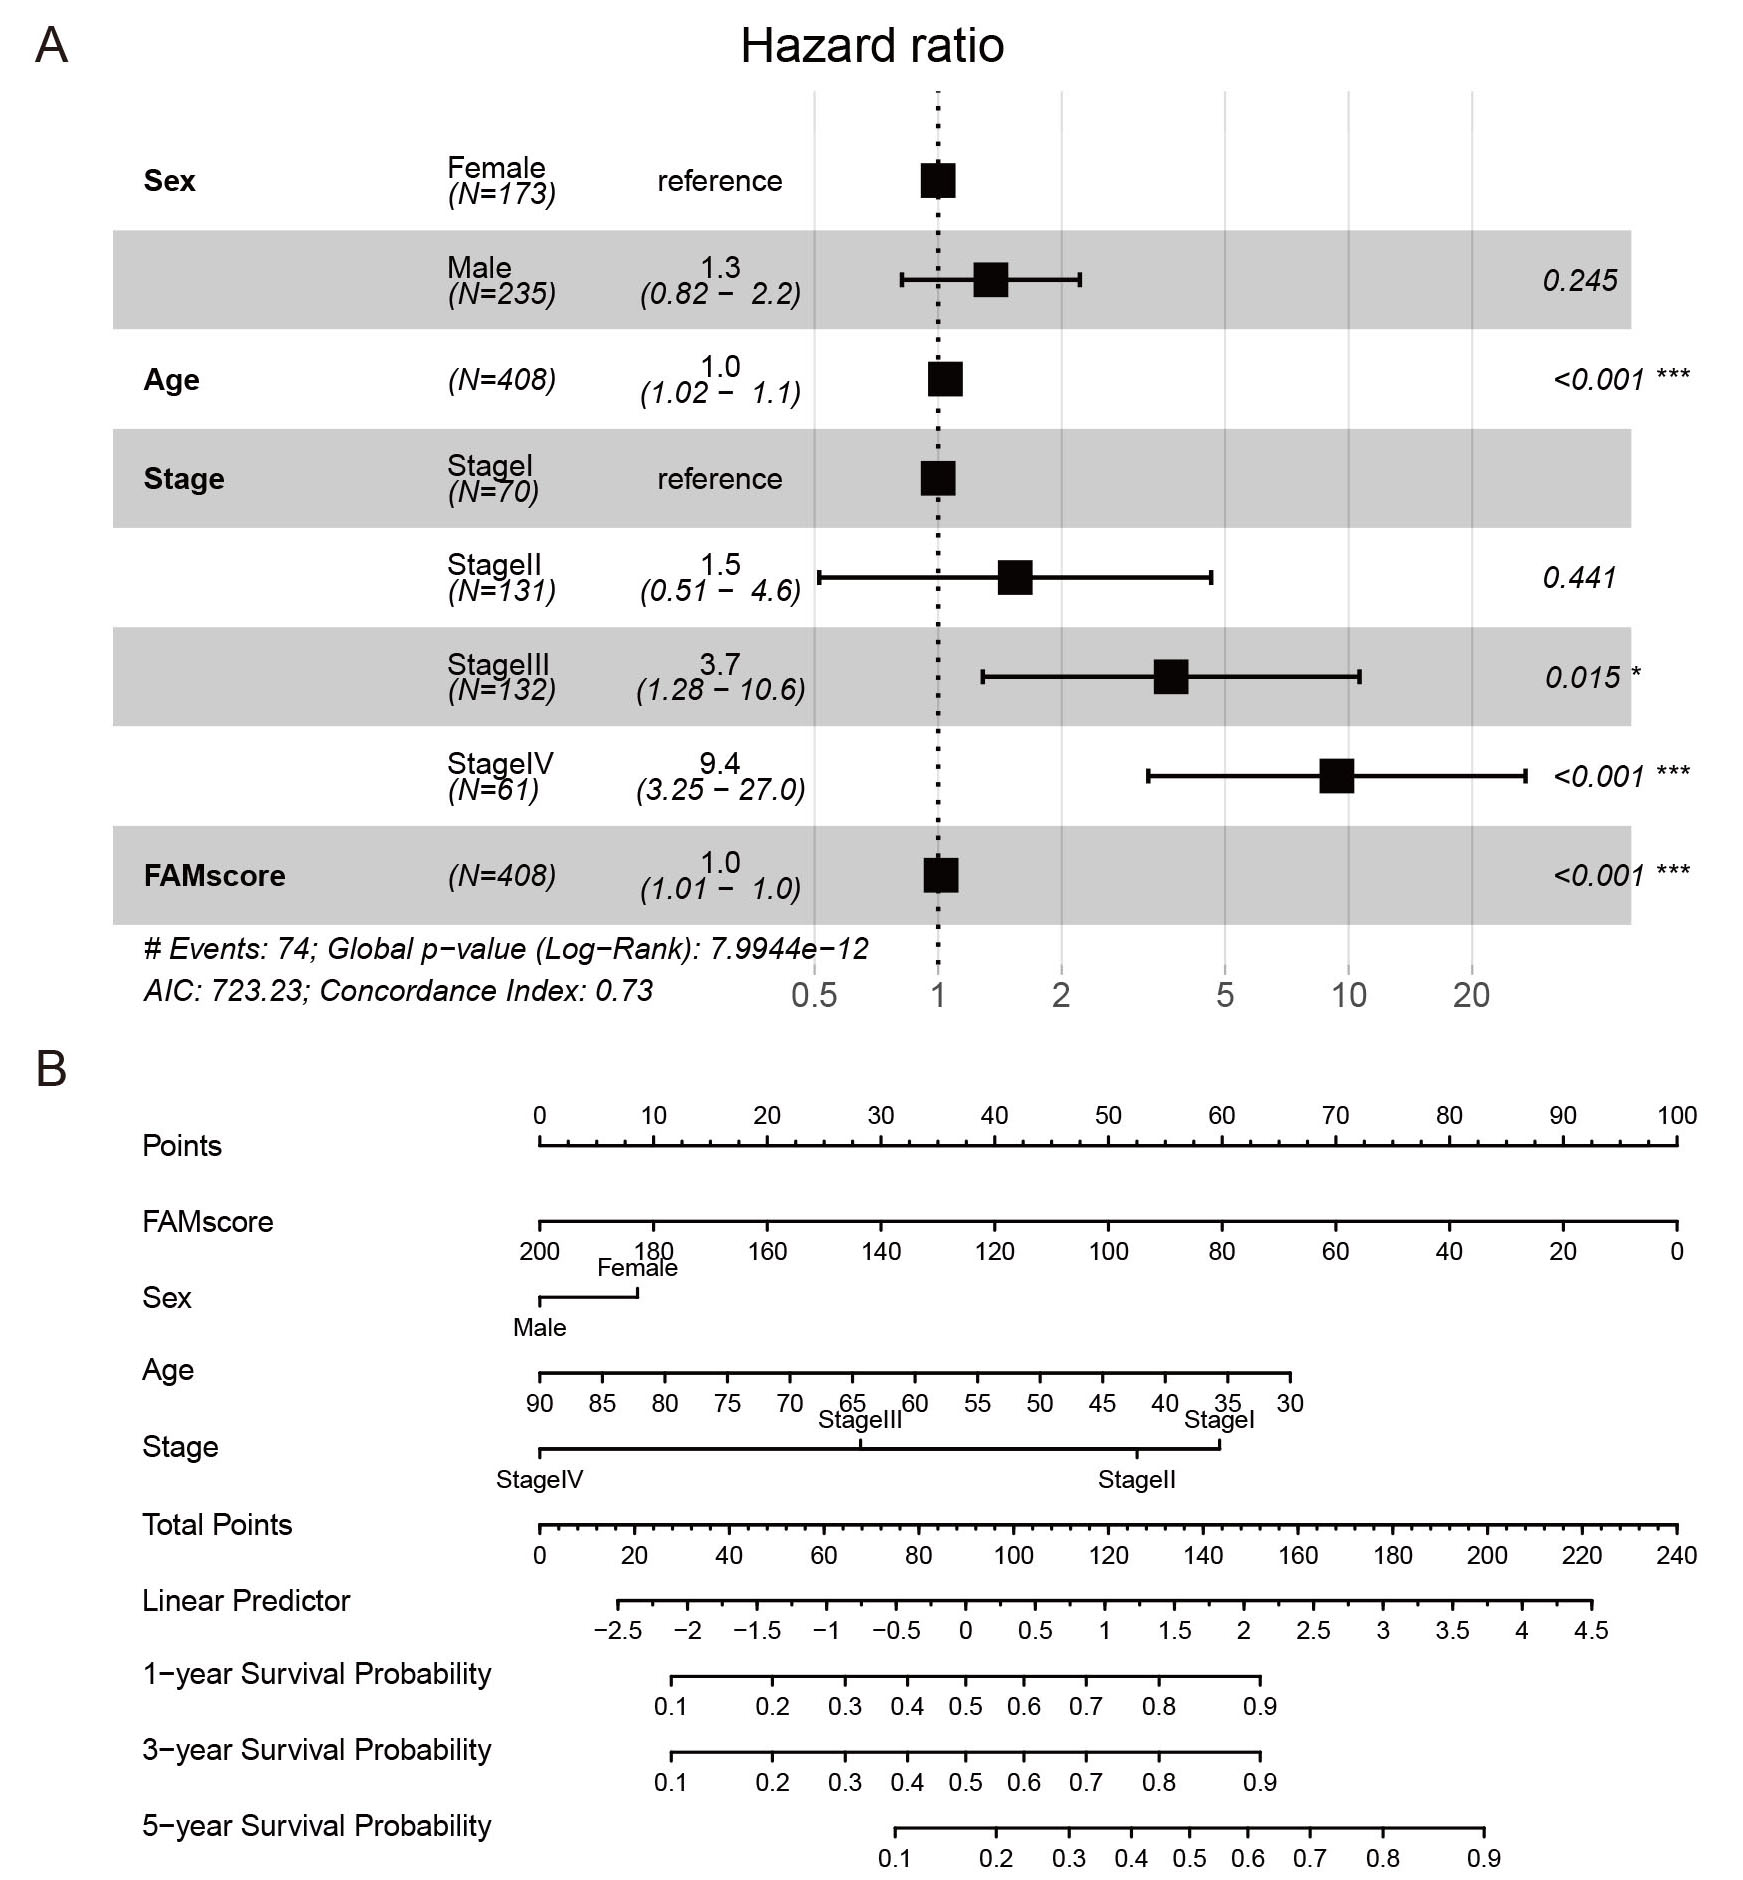
Figure 3. (A) Forest plot of multivariate Cox analysis for sex, age, stage, and FAMscore. (B) Nomogram incorporating FAMscore and clinical factors.
To enhance the clinical utility of the model, a nomogram was developed, incorporating sex, age, stage, and FAMscore, to predict 1-year, 3-year, and 5-year survival probabilities for patients with CRC. FAMscore demonstrated the greatest predictive capability for OS, indicating that the four-gene FAM signature provided a robust prognostic tool for CRC [Figure 3B].
Comparison of somatic mutation between FAMscore-high and FAMscore-low
Somatic mutation analysis of patients with CRC was conducted to differentiate between high-risk and low-risk groups. The most frequently mutated genes were APC (adenomatous polyposis coli) (80%), TP53 (Tumor Protein P53) (64%), KRAS (KRAS Proto-Oncogene, GTPase) (45%), and TTN (Titin) (38%) [Figure 4A]. Significant differences in the detection rates of genes, including APC, KRAS, MUC16 (Mucin 16, Cell Surface Associated), FBXW7 (F-Box and WD Repeat Domain Containing 7), and OBSCN (Obscurin, Cytoskeletal Calmodulin and Titin-Interacting RhoGEF), were observed between the high-risk and low-risk groups. Specifically, these genes exhibited consistently higher detection rates in the FAMscore-low group compared to the FAMscore-high group [Figure 4B].
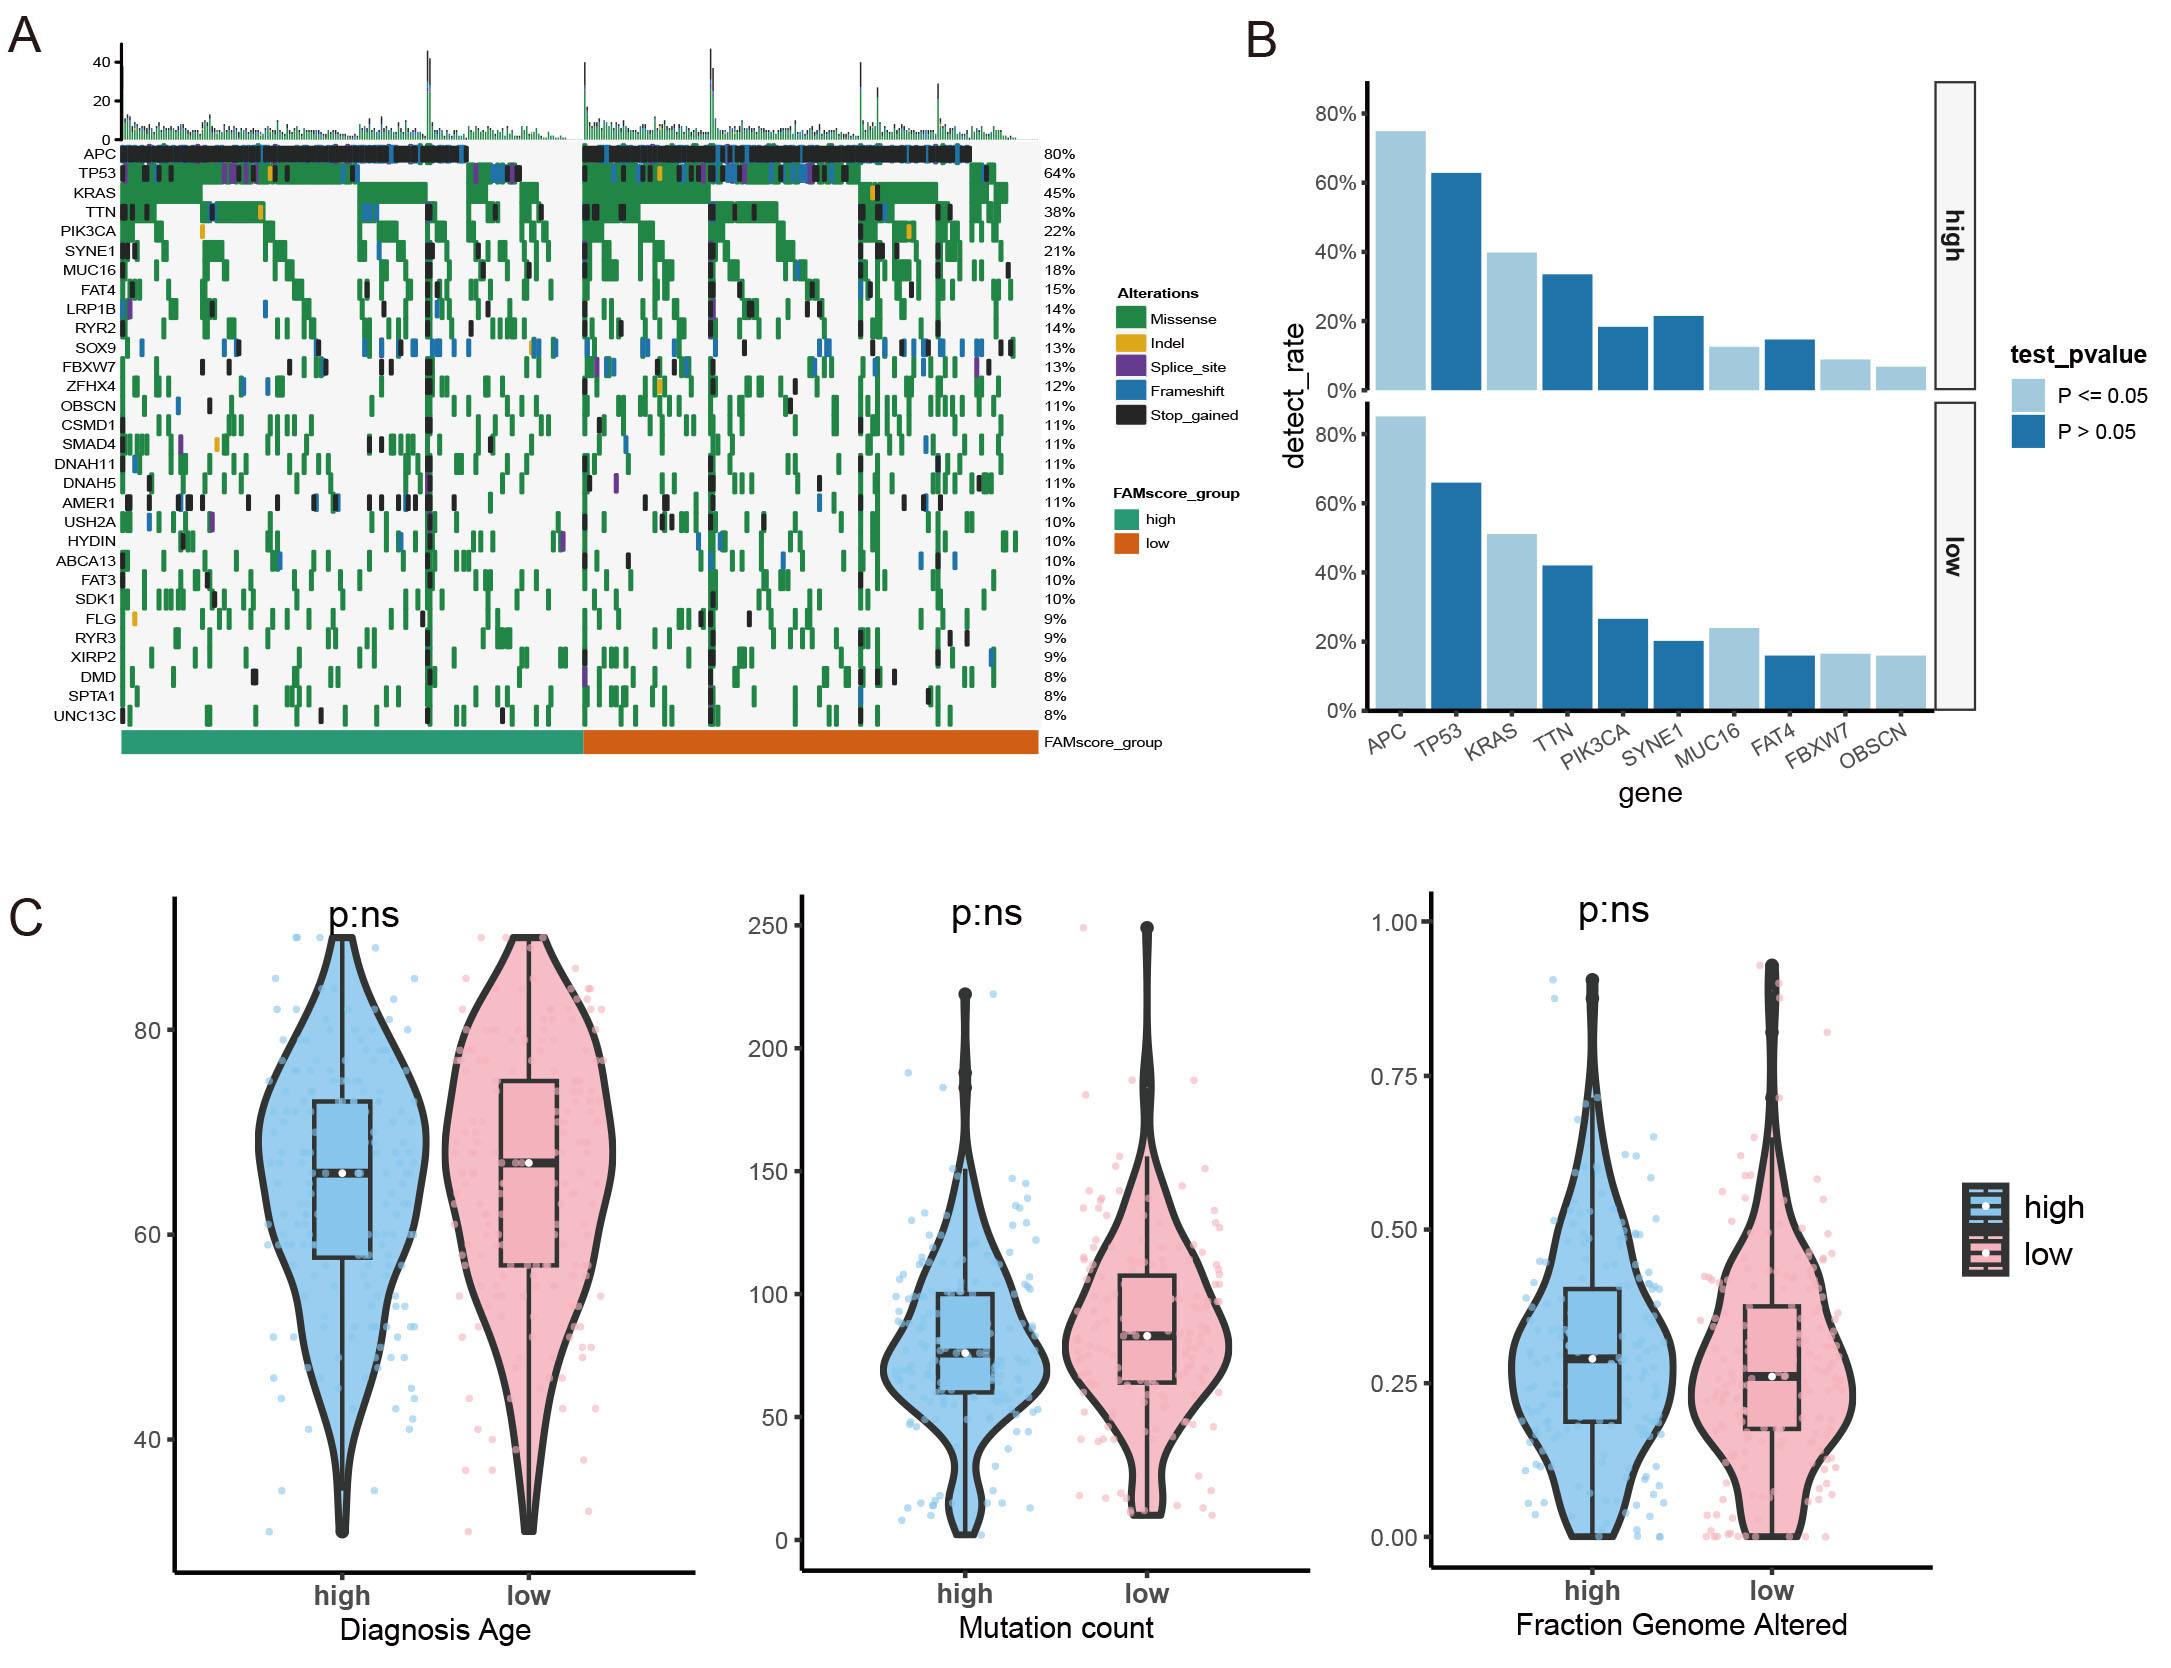
Figure 4. (A) Landscape of gene mutations. (B) Comparison of gene detection rates between different FAMscore groups. (C) Comparison of diagnosis age, mutation count, and fraction genome altered between different FAMscore groups.
Patients with higher tumor mutation burdens (TMB) may benefit from immunotherapy due to their increased neoantigen load[28]. Mutation count and Fraction Genome Altered (FGA) were also compared between the high-risk and low-risk groups [Figure 4C], revealing no significant differences, suggesting comparable immunogenicity between the two groups. Additionally, no significant differences were observed in diagnosis age distribution between the groups [Figure 4C].
Functional annotation of the FAMs prognosis model
To explore the pathways activated or suppressed in the high FAMscore group compared to the low FAMscore group, a Kyoto Encyclopedia of Genes and Genomes (KEGG) pathway analysis was performed. Differential genes between the two groups of TCGA dataset were identified using Differential gene expression analysis based on the negative binomial distribution, with criteria for defining differential genes set at |log2FC (fold change)| > 1 and padj (p-adjust) < 0.05. A total of 1,334 differential genes were screened, including 1,296 upregulated genes and 38 downregulated genes [Figure 5A].
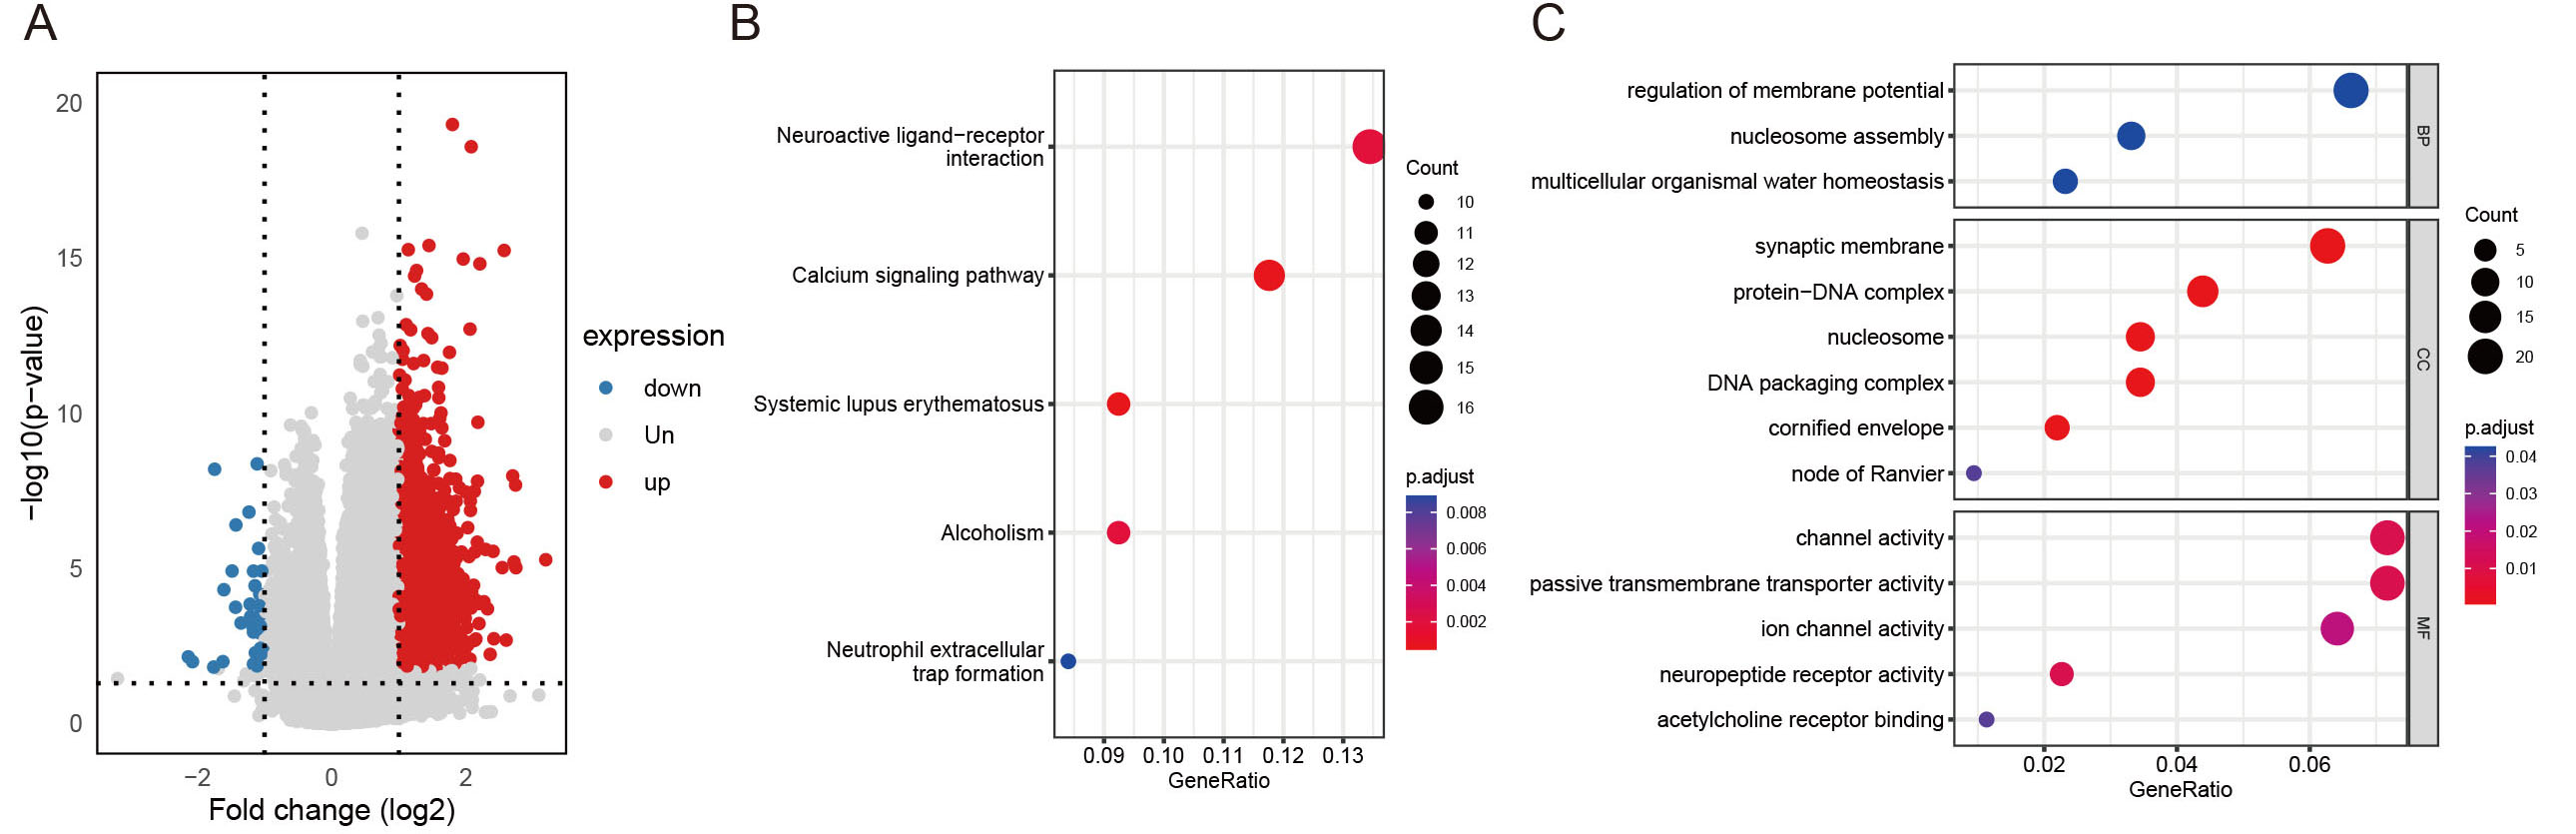
Figure 5. (A) Volcano plot of differentially expressed genes between the FAMscore-high and FAMscore-low groups of TCGA database. (B) KEGG bubble plot. (C) GO bubble plot.
The analysis revealed that the DEGs were primarily enriched in pathways related to Neuroactive ligand-receptor interaction, Calcium signaling pathway, Systemic lupus erythematosus, Alcoholism, and Neutrophil extracellular trap formation [Figure 5B].
Additionally, Gene Ontology (GO) term enrichment analysis indicated that the top biological processes (BP), cellular components (CC), and molecular functions (MF) in the DEGs between the high and low FAMscore groups were associated with regulation of membrane potential, synaptic membrane, and channel activity [Figure 5C].
Immune microenvironment in the FAMscore high group
To further explore the mechanisms underlying the prognostic divergence between the two FAMscore-defined subgroups, we performed a comprehensive evaluation of the TME[29]. Tumor immune evasion is widely recognized to involve both intrinsic factors, such as antigen presentation defects, and extrinsic components, including immune cell dysfunction and immunosuppressive cell enrichment[29].
In our analysis, no significant differences were observed in intrinsic immunogenic indicators, including TMB and FGA, suggesting comparable baseline immunogenicity between the two groups [Figure 4C].
However, pronounced alterations in immune cell composition were detected. Specifically, high-FAMscore tumors exhibited markedly decreased infiltration of macrophage M1 (P = 0.022), CD8+ T cells (P = 0.0081), activated CD4+ memory T cells (P = 0.009) and follicular helper T cells (P = 0.029), whereas macrophage M2 (P = 0.036) and Tregs (P = 0.024) were significantly enriched [Figure 6A]. These results suggest that the low-risk group exhibits better immune infiltration. This immune profile reflects a suppressive microenvironment characterized by diminished cytotoxic and helper immune responses alongside enhanced immunoregulatory activity. Given the critical roles of CD8+ T cells and M1 macrophages in mediating antitumor immunity, their reduction likely compromises immune surveillance, thereby facilitating tumor progression. Meanwhile, the expansion of M2 macrophages and Tregs further reinforces immune tolerance and promotes immune escape.
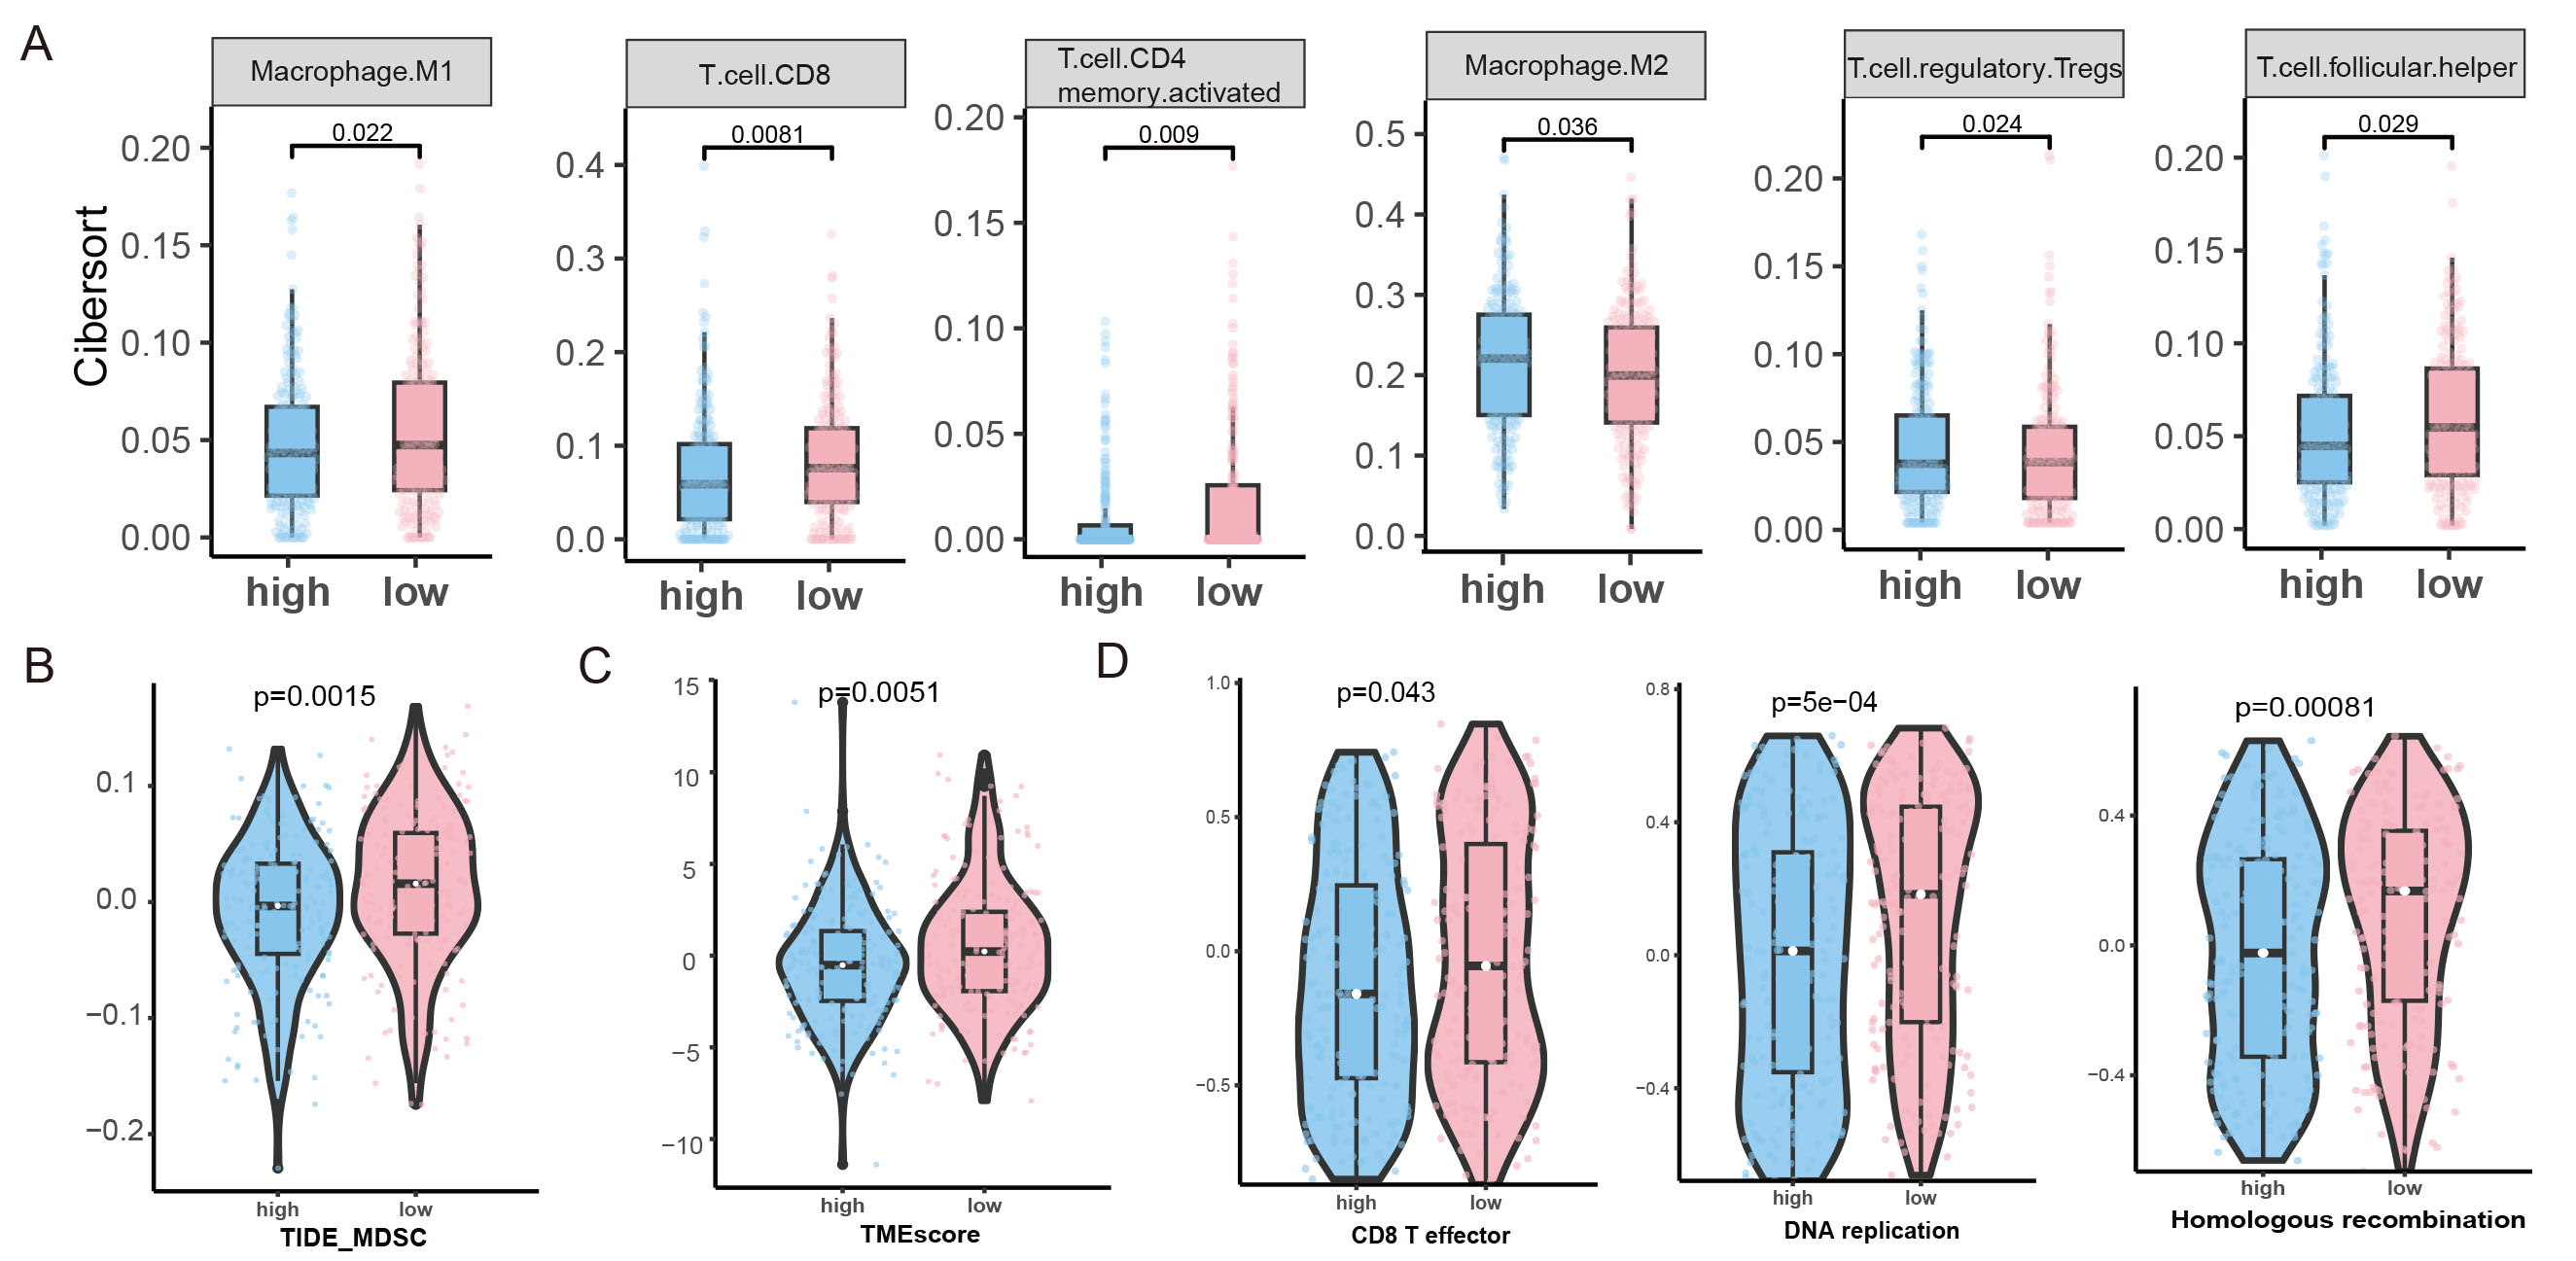
Figure 6. (A) Immune cell scores for Macrophage M1, CD8 T cells, activated CD4 memory T cells, Macrophage M2, Tregs (T cell regulatory), and follicular helper T cells by CIBERSORT. (B) The score for immune features of MDSC predicted by TIDE. (C) The score for immune features of TMEscore. (D) GSVA analysis of CD8 T effector, DNA replication, and homologous recombination enrichment in both groups.
Additionally, the TIDE score was assessed, revealing higher levels of MDSCs in the high FAMscore group
Moreover, the scores of 29 immune-related pathways were evaluated using GSVA. The results indicated that CD8 T effector, DNA replication, and homologous recombination pathways [Figure 6D] were significantly higher in the low-risk group. Collectively, these findings indicate that FAMscore is closely associated with the establishment of an immunosuppressive TME in MSS CRC.
The sensitivity of patients in the FAMscore high and low groups to targeted agents
Targeted therapies have become the standard first-line treatment for patients with advanced, unresectable MSS CRC with therapeutically targetable alterations. In this study, FAMscore-high tumors exhibited higher sensitivities, as evidenced by lower IC50 values, to both nilotinib (Figure 7A, P = 0.0024) and gefitinib
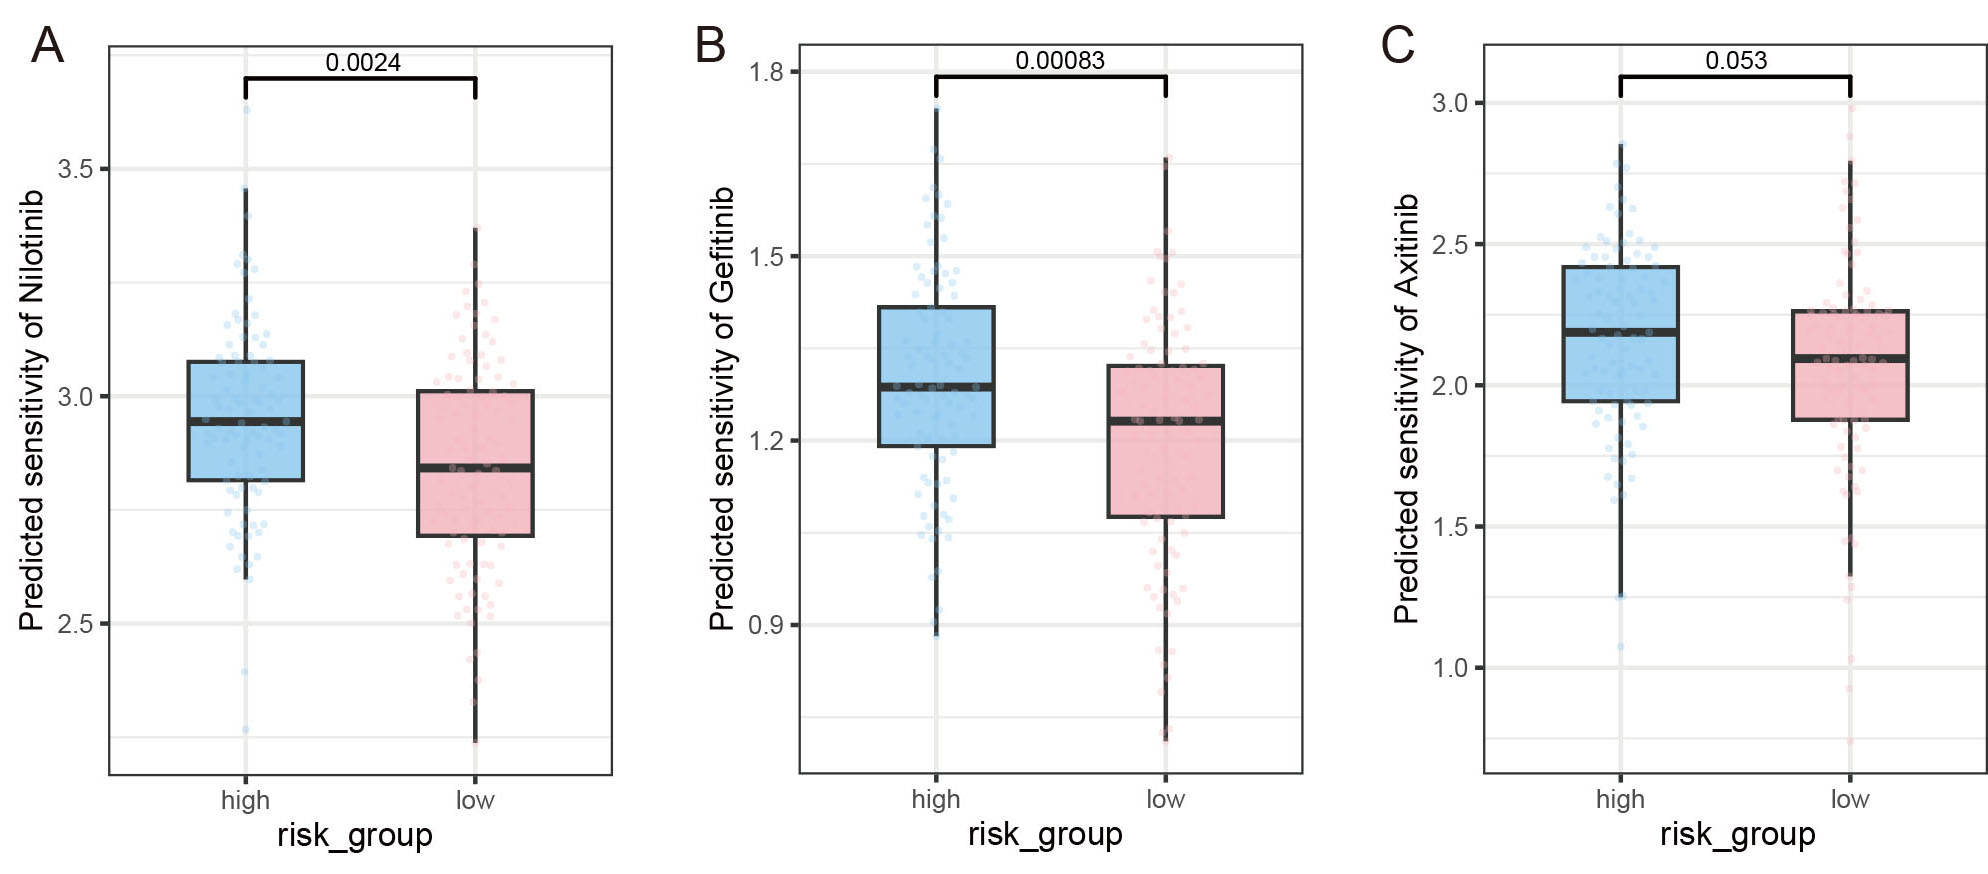
Figure 7. Sensitivities of patients in the FAMscore high and low groups to targeted agents. (A-C) Sensitivities to Nilotinib, Gefitinib, and Axitinib. The x-axis represents the grouping information, and the y-axis represents the IC50 value.
Information on the IC50 values of the three drugs among different groups
| Overall (n = 196) | high_group (n = 93) | low_group (n = 103) | P | |
| Nilotinib | 0.002 (wilcox.test) | |||
| Mean (SD) | 2.9 (0.23) | 2.95 (0.22) | 2.84 (0.23) | |
| Median [IQR] | 2.91 [2.73, 3.04] | 2.94 [2.81, 3.08] | 2.84 [2.69, 3.01] | |
| Gefitinib | < 0.001 (wilcox.test) | |||
| Mean (SD) | 1.25 (0.20) | 1.3 (0.18) | 1.2 (0.20) | |
| Median [IQR] | 1.27 [1.11, 1.36] | 1.29 [1.19, 1.42] | 1.23 [1.08, 1.32] | |
| Axitinib | 0.053 (wilcox.test) | |||
| Mean (SD) | 2.11 (0.37) | 2.16 (0.34) | 2.06 (0.39) | |
| Median [IQR] | 2.14 [1.92, 2.34] | 2.19 [1.94, 2.42] | 2.09 [1.88, 2.26] |
DISCUSSION
The identification of reliable biomarkers for accurate tumor prognosis is essential for the development of personalized therapeutic strategies and understanding the molecular mechanisms underlying tumor progression and metastasis. Although tumor-agnostic biomarkers show substantial potential for enabling precision management of CRC, their translation into routine clinical practice remains challenging. Variability in molecular testing methodologies, including differences in gene panel design, sequencing technologies, and bioinformatic workflows, results in inconsistent biomarker identification and interpretation. In addition, intratumoral heterogeneity and dynamic resistance mechanisms, such as compensatory signaling pathways observed in BRAF (B-Raf Proto-Oncogene, Serine/Threonine Kinase)-mutated CRC, further hinder the establishment of sustained therapeutic benefit. Moreover, the considerable cost of testing and limited accessibility to comprehensive genomic profiling restrict the widespread clinical adoption of agnostic biomarkers, particularly across heterogeneous patient populations[30]. This study highlights the prognostic significance and functional implications of four FAM gene family members (FAM161B, FAM3B, FAM83A, FAM89A) in patients with MSS CRC.
Emerging evidence has underscored the prognostic significance of various FAM genes as independent biomarkers across multiple malignancies. Immunohistochemical profiling of 12,400 prostate cancer specimens in tissue microarrays revealed significant associations between FAM13C (Family With Sequence Similarity 13 Member C) expression levels and both biochemical recurrence rates and molecular subtypes of the disease[31]. In contrast, FAM110B exhibits primary centrosomal localization, where it facilitates microtubule nucleation and organization. Experimental evidence indicates that FAM110B plays context-dependent roles in carcinogenesis: while its overexpression appears to inhibit non-small cell lung cancer progression through Wnt/β-catenin pathway inhibition and G1 phase prolongation, its role in other cancers may differ, reflecting tumor-specific functions[32,33]. These findings have been validated through therapeutic applications in diverse malignancies, including pancreatic, colorectal, and prostate cancers[34,35]. The recently characterized FAM72A (Ugene) represents a neuronal protein with emerging oncogenic properties across multiple tumor types[36]. Clinically, FAM72A overexpression has been identified as an independent prognostic indicator in hepatocellular carcinoma[37,38]. Despite these advances in understanding individual FAM gene functions, the cooperative regulatory network involving FAM family genes in MSS CRC remains poorly characterized, highlighting a critical gap in current research.
The detection rates of APC, KRAS [Supplementary Figure 2], MUC16, FBXW7, and OBSCN were consistently higher in the FAMscore-low group compared to the FAMscore-high group. Previous studies have linked wild-type APC to poor prognosis in MSS proximal colon cancer[39]. In our findings, the higher detection rate of APC mutations in the low-risk group aligns with these earlier reports.
In our analysis, no significant differences were detected in FGA or total mutation burden between the high- and low-FAMscore subgroups, indicating comparable baseline tumor immunogenicity. Nevertheless, elevated FAMscore was closely associated with features of extrinsic immune evasion. Specifically, tumors in the high-FAMscore group exhibited markedly reduced infiltration of macrophage M1, CD8+ T cells, activated CD4+ memory T cells, and follicular helper T cells, accompanied by a significant enrichment of macrophage M2 cells and Tregs. This finding is consistent with previous studies suggesting that tumor immunogenicity is not solely influenced by genomic alterations but is also shaped by the TME and immune cell composition[40-42]. Despite similar levels of immunogenicity, the high FAMscore group exhibited a distinct immune profile characterized by extrinsic immune escape mechanisms. Notably, there was a significant reduction in the abundance of immune effector cells, including Macrophage M1, CD8+ T cells, CD4+ memory-activated T cells, and follicular helper T cells, in the high FAMscore group. In contrast, immunosuppressive cell populations, such as Macrophage M2 and Tregs, were notably increased. The reduction in Macrophage M1 and CD8+ T cells - critical for antitumor immunity - suggests a diminished cytotoxic immune response in this group. Macrophage M1 cells are known to promote inflammation and tumor cell killing, while CD8+ T cells are essential for direct tumor cell lysis[43-45]. Their reduction likely contributes to immune evasion and tumor progression. Moreover, the decline in CD4+ memory-activated T cells and follicular helper T cells, which are vital for sustaining adaptive immune responses, further underscores the compromised immune surveillance in the high FAMscore group[46-48]. On the other hand, the increased infiltration of Macrophage M2 and Tregs emphasizes the role of immunosuppressive mechanisms in promoting immune escape. Macrophage M2 cells, associated with tissue repair and immune suppression, often facilitate tumor growth and metastasis[48,49]. Tregs, which suppress effector T cell responses and maintain immune tolerance, help create an immunosuppressive TME that supports tumor survival[50]. These findings align with previous studies highlighting that an imbalance between immune effector and suppressor cells is a hallmark of immune evasion in various cancers[51]. The immune profile observed in the high FAMscore group suggests that FAMscore may serve as a potential biomarker for identifying tumors with an immunosuppressive TME, with significant implications for immunotherapy strategies. For example, patients with high FAMscore tumors might benefit from therapies targeting immunosuppressive cells, such as Treg depletion or Macrophage M2 reprogramming, to restore antitumor immunity[52,53]. Furthermore, combining ICIs with strategies aimed at enhancing effector cell infiltration could present a promising approach to overcoming immune escape in these patients[54]. In conclusion, our findings emphasize the critical role of the immune microenvironment in tumor progression and therapy response, independent of genomic instability. The link between high FAMscore and an immunosuppressive TME underscores the necessity for further research into the mechanisms of immune escape and the development of targeted immunotherapies for patients with high FAMscore tumors.
The clinical relevance of FAM gene family members extends to their potential impact on the response to targeted cancer therapies. For example, FAM83H-AS1 (Family with Sequence Similarity 83 Member H antisense RNA 1), a long non-coding RNA, has been identified as a driver gene in lung adenocarcinoma (LUAD), where its overexpression correlates with poor prognosis and promotes tumor progression by enhancing the translation of anti-apoptotic oncogenes such as RAB8B (Member RAS Oncogene Family) and RAB14 (Member RAS Oncogene Family). Similarly, FAM64A acts as an androgen receptor-regulated feedback promoter in prostate cancer, driving cell proliferation and metastasis through cyclin B1/D-mediated cell cycle acceleration. These findings suggest that FAM genes, predominantly expressed in epithelial tissues, play critical roles in regulating cancer cell proliferation, migration, and invasion. Exploring their relationship with targeted therapies, such as gefitinib and nilotinib, holds clinical promise, especially with emerging strategies such as CRISPR (Clustered Regularly Interspaced Short Palindromic Repeats) interference (CRISPRi) to suppress oncogenic FAM members, including FAM83H-AS1, in preclinical models. These efforts could lead to the development of predictive biomarkers for personalized treatments and improved therapeutic outcomes. However, mechanistic insights into FAM gene-drug interactions remain limited, requiring further studies to validate their clinical applicability.
This study has notable limitations. First, the FAMscore prognostic model was developed using retrospective datasets, following similar approaches seen in TCGA-based analyses of FAM171B in bladder cancer. While bioinformatics tools offer valuable insights, prospective validation in independent cohorts - akin to the multi-center validation of FAM171A2 (Family with Sequence Similarity 171 Member A2) in Parkinson’s disease - is crucial for confirming generalizability. Second, pathway analyses are based on computational predictions, which necessitate experimental validation. Finally, all immune and drug-related analyses are exploratory and hypothesis-generating. To address these limitations and build upon our current findings, our future research will prioritize multi-modal studies that integrate complementary data types (e.g., genomic, proteomic, and imaging data, flow cytometry, IHC, drug assays) to more comprehensively capture the disease landscape. Ultimately, this work is designed to provide a solid foundation for future translational studies, with the explicit goal of informing the design of prospective clinical trials to rigorously evaluate the clinical utility of our discoveries.
Herein, we acknowledge several limitations of the present study. A primary constraint is the lack of prospective and experimental validation of our findings, which is inherent to its discovery-stage, hypothesis-generating nature. Consequently, the results should be interpreted as revealing potential biological mechanisms rather than offering immediate clinical applicability.
Notably, the considerable tumor heterogeneity observed underscores the complexity of the disease and highlights the possibility that key molecular features may vary spatially and temporally within tumors[55,56]. This variability reinforces the need for cautious interpretation of data derived from a single time point or a limited biopsy sample.
Additional knowledge and novelties compared with Chi et al., 2023[26]
Chi et al. established a prognostic prediction model based on FAM family genes in uterine corpus endometrial carcinoma (UCEC), highlighting the role of selected FAM genes in tumor heterogeneity, stemness features, and immunotherapy responsiveness[26]. While this work represents an important contribution to understanding the clinical utility of FAM genes in gynecologic malignancies, the present study provides distinct and complementary advances in several critical aspects.
First, the cancer type and biological context fundamentally differ. Chi et al. focused on UCEC, a hormonally driven gynecologic cancer with unique molecular subtypes and immune characteristics[26]. In contrast, our study systematically investigates the role of FAM family genes in CRC, a malignancy characterized by pronounced genomic instability, mismatch repair deficiency, and complex immune heterogeneity. By doing so, our work extends the relevance of the FAM gene family into a distinct tumor ecosystem, demonstrating that their biological significance is not restricted to UCEC but may represent a broader oncogenic and immunological paradigm.
Second, the research objectives and analytical strategies are conceptually different. Chi et al. aimed to construct and validate a risk prediction model based on a small subset of prognostically significant FAM genes to stratify UCEC patients for survival and immunotherapy benefit[26]. In contrast, our study does not primarily focus on model construction. Instead, we emphasize a comprehensive characterization of FAM gene expression patterns, immune associations, and biological functions in CRC, with particular attention to TME features and molecular heterogeneity. This approach allows us to move beyond risk stratification toward biological interpretation and mechanistic hypothesis generation.
Third, our study provides cancer-specific insights into immune regulation that are not addressed by
Finally, by positioning FAM genes within the unique molecular and immunological landscape of CRC, our study broadens the current understanding of the FAM gene family beyond prognostic modeling. Together with the work by Chi et al., our findings support the concept that FAM genes represent a context-dependent regulatory gene family, whose functional and clinical implications vary across cancer types[26]. Thus, our study provides novel, CRC-specific biological and immunological insights that complement, rather than duplicate, the previously reported findings in UCEC.
DECLARATIONS
Acknowledgements
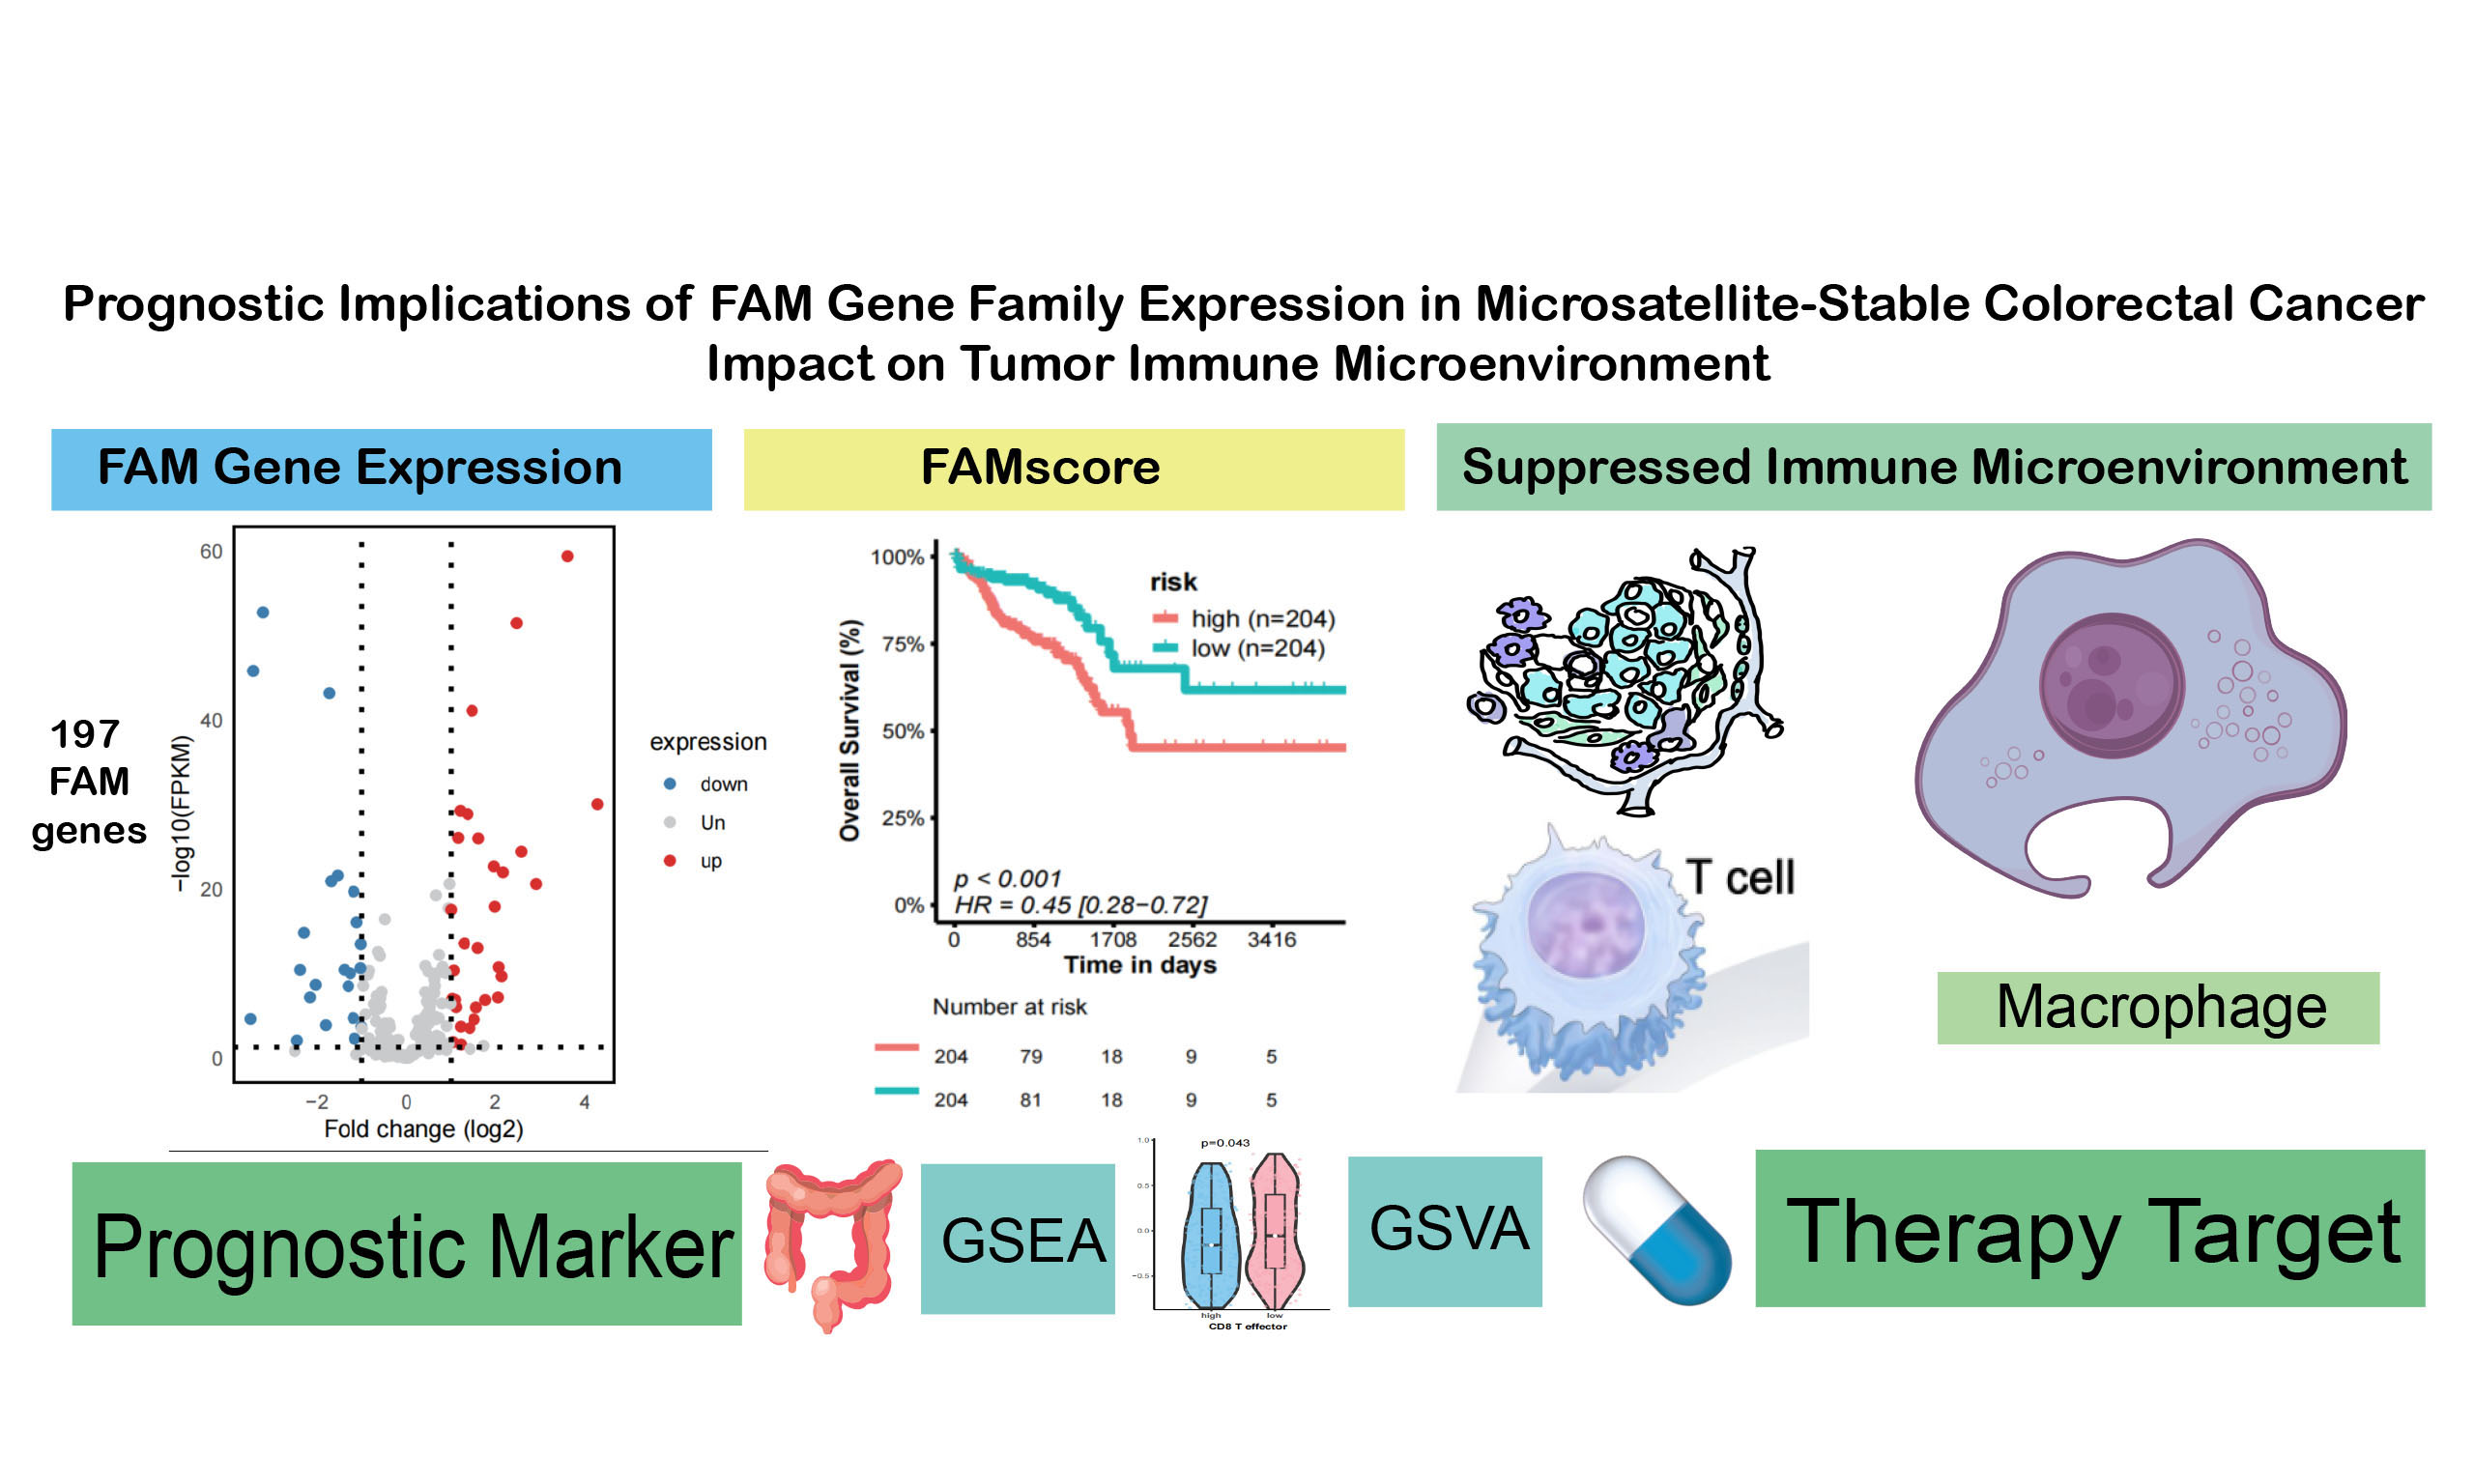
The authors acknowledge the SciDraw platform (https://scidraw.io/?page=22) for providing image materials for Graphical Abstract.
Authors’ contributions
Provided technical support for bioinformatics and contributed to data interpretation: Weng S
Performed data analysis, drafted the manuscript, and revised it:Wang D, Zhang L
Supervised the project and reviewed and edited the manuscript: Wu S
Availability of data and materials
Publicly available datasets were analyzed in this study. The data can be found here: MSS CRC data were collected from The Cancer Genome Atlas (TCGA) database (https://portal.gdc.cancer.gov/); GSE29623 and GSE39582 datasets were acquired from the GEO database (http://www.ncbi.nlm.nih.gov/geo/).
AI and AI-assisted tools Statement
Not applicable.
Financial support and sponsorship
This work was supported by the Medical Health Science and Technology Project of the Zhejiang Provincial Health Commission (Grant No. 2025KY1505) and the Medical Health Science and Technology Project of the Zhejiang Provincial Health Commission (Grant No. 2024KY392).
Conflicts of interest
All authors declared that there are no conflicts of interest.
Ethical approval and consent to participate
Not applicable.
Consent for publication
Not applicable.
Copyright
© The Author(s) 2026.
Supplementary Materials
REFERENCES
1. Sung H, Ferlay J, Siegel RL, et al. Global cancer statistics 2020: GLOBOCAN estimates of incidence and mortality worldwide for 36 cancers in 185 countries. CA Cancer J Clin. 2021;71:209-49.
2. Genome Atlas Network. Comprehensive molecular characterization of human colon and rectal cancer. Nature. 2012;487:330-7.
3. Ciardiello F, Ciardiello D, Martini G, Napolitano S, Tabernero J, Cervantes A. Clinical management of metastatic colorectal cancer in the era of precision medicine. CA Cancer J Clin. 2022;72:372-401.
4. Siegel RL, Wagle NS, Cercek A, Smith RA, Jemal A. Colorectal cancer statistics, 2023. CA Cancer J Clin. 2023;73:233-54.
5. Hou S, Guo T, Chang X, et al. Impact of aging on colon cancer burden: a cross-sectional analysis of nationally representative data. Medicine. 2025;104:e46650.
6. Gefen R, Emile SH, Horesh N, Garoufalia Z, Wexner SD. Age-related variations in colon and rectal cancer: an analysis of the national cancer database. Surgery. 2023;174:1315-22.
7. Llosa NJ, Cruise M, Tam A, et al. The vigorous immune microenvironment of microsatellite instable colon cancer is balanced by multiple counter-inhibitory checkpoints. Cancer Discov. 2015;5:43-51.
8. Shia J. Immunohistochemistry versus microsatellite instability testing for screening colorectal cancer patients at risk for hereditary nonpolyposis colorectal cancer syndrome. Part I. The utility of immunohistochemistry. J Mol Diagn. 2008;10:293-300.
9. McCarthy AJ, Capo-Chichi JM, Spence T, et al. Heterogenous loss of mismatch repair (MMR) protein expression: a challenge for immunohistochemical interpretation and microsatellite instability (MSI) evaluation. J Pathol Clin Res. 2019;5:115-29.
10. Guyot D'Asnières De Salins A, Tachon G, Cohen R, et al. Discordance between immunochemistry of mismatch repair proteins and molecular testing of microsatellite instability in colorectal cancer. ESMO Open. 2021;6:100120.
11. Deng H, Xu X, Zhang Y, Li Y. The complex role and molecular mechanism of family with sequence similarity genes in cancer: a comprehensive review. Discov Oncol. 2025;16:1443.
12. Huang X, Sun Y, Song J, et al. Prognostic value of fatty acid metabolism-related genes in colorectal cancer and their potential implications for immunotherapy. Front Immunol. 2023;14:1301452.
13. Liu W, Wang S, Qian K, Zhang J, Zhang Z, Liu H. Expression of family with sequence similarity 172 member A and nucleotide-binding protein 1 is associated with the poor prognosis of colorectal carcinoma. Oncol Lett. 2017;14:3587-93.
14. Huang X, Chi H, Gou S, et al. An Aggrephagy-Related LncRNA Signature for the Prognosis of Pancreatic Adenocarcinoma. Genes. 2023;14:124.
15. Friedman J, Hastie T, Tibshirani R. Regularization paths for generalized linear models via coordinate descent. J. Stat. Soft. 2010;33:1-22.
16. Zhang H, Li R, Cao Y, et al. Poor clinical outcomes and immunoevasive contexture in intratumoral IL-10-producing macrophages enriched gastric cancer patients. Ann Surg. 2022;275:e626-35.
17. Pei S, Zhang P, Chen H, et al. Integrating single-cell RNA-seq and bulk RNA-seq to construct prognostic signatures to explore the role of glutamine metabolism in breast cancer. Front Endocrinol. 2023;14:1135297.
18. Pei S, Zhang P, Yang L, et al. Exploring the role of sphingolipid-related genes in clinical outcomes of breast cancer. Front Immunol. 2023;14:1116839.
19. Liu J, Zhang P, Yang F, et al. Integrating single-cell analysis and machine learning to create glycosylation-based gene signature for prognostic prediction of uveal melanoma. Front Endocrinol. 2023;14:1163046.
20. Su C, Xue J, Liu N. Cox regression analysis of prognostic factors of intensity-modulated radiotherapy in patients with bladder cancer. Arch Esp Urol. 2023;76:411-7.
21. Chen B, Khodadoust MS, Liu CL, Newman AM, Alizadeh AA. Profiling tumor infiltrating immune cells with CIBERSORT. Methods Mol Biol. 2018;1711:243-59.
22. Yoshihara K, Shahmoradgoli M, Martínez E, et al. Inferring tumour purity and stromal and immune cell admixture from expression data. Nat Commun. 2013;4:2612.
23. Hänzelmann S, Castelo R, Guinney J. GSVA: gene set variation analysis for microarray and RNA-seq data. BMC Bioinf. 2013;14:7.
24. Jiang P, Gu S, Pan D, et al. Signatures of T cell dysfunction and exclusion predict cancer immunotherapy response. Nat Med. 2018;24:1550-8.
25. Mayakonda A, Lin DC, Assenov Y, Plass C, Koeffler HP. Maftools: efficient and comprehensive analysis of somatic variants in cancer. Genome Res. 2018;28:1747-56.
26. Chi H, Gao X, Xia Z, et al. FAM family gene prediction model reveals heterogeneity, stemness and immune microenvironment of UCEC. Front Mol Biosci. 2023;10:1200335.
27. Geeleher P, Cox NJ, Huang RS. Clinical drug response can be predicted using baseline gene expression levels and in vitro drug sensitivity in cell lines. Genome Biol. 2014;15:R47.
28. Chan TA, Wolchok JD, Snyder A. Genetic basis for clinical response to CTLA-4 blockade in melanoma. N Engl J Med. 2015;373:1984.
29. Schreiber RD, Old LJ, Smyth MJ. Cancer immunoediting: integrating immunity's roles in cancer suppression and promotion. Science. 2011;331:1565-70.
30. Kyrochristou I, Anagnostopoulos G, Giannakodimos I, Psalla K, Rogdakis A. Inflammation biomarkers as predictors of nodal metastases in colorectal cancer. Folia Med. 2025:67.
31. Burdelski C, Borcherding L, Kluth M, et al. Family with sequence similarity 13C (FAM13C) overexpression is an independent prognostic marker in prostate cancer. Oncotarget. 2017;8:31494-508.
32. Hauge H, Patzke S, Aasheim HC. Characterization of the FAM110 gene family. Genomics. 2007;90:14-27.
33. Xie M, Cai L, Li J, et al. FAM110B inhibits non-small cell lung cancer cell proliferation and invasion through inactivating Wnt/β-catenin signaling. Onco Targets Ther. 2020;13:4373-84.
34. Xi T, Zhang G. Integrated analysis of tumor differentiation genes in pancreatic adenocarcinoma. PLoS ONE. 2018;13:e0193427.
35. Wang X, Duanmu J, Fu X, Li T, Jiang Q. Analyzing and validating the prognostic value and mechanism of colon cancer immune microenvironment. J Transl Med. 2020;18:324.
36. Pramanik S, Kutzner A, Heese K. Lead discovery and in silico 3D structure modeling of tumorigenic FAM72A (p17). Tumour Biol. 2015;36:239-49.
37. Zhang T, Nie Y, Gu J, et al. Identification of mitochondrial-related prognostic biomarkers associated with primary bile acid biosynthesis and tumor microenvironment of hepatocellular carcinoma. Front Oncol. 2021;11:587479.
38. Gao Y, Liu J, Zhao D, Diao G. A novel prognostic model for identifying the risk of hepatocellular carcinoma based on angiogenesis factors. Front Genet. 2022;13:857215.
39. Jorissen RN, Christie M, Mouradov D, et al. Wild-type APC predicts poor prognosis in microsatellite-stable proximal colon cancer. Br J Cancer. 2015;113:979-88.
41. McGranahan N, Furness AJ, Rosenthal R, et al. Clonal neoantigens elicit T cell immunoreactivity and sensitivity to immune checkpoint blockade. Science. 2016;351:1463-9.
42. Zhang Z, Wu Y. Research progress on mechanisms of tumor immune microenvironment and gastrointestinal resistance to immunotherapy: mini review. Front Immunol. 2025;16:1641518.
43. Mantovani A, Sozzani S, Locati M, Allavena P, Sica A. Macrophage polarization: tumor-associated macrophages as a paradigm for polarized M2 mononuclear phagocytes. Trends Immunol. 2002;23:549-55.
44. Gajewski TF, Schreiber H, Fu YX. Innate and adaptive immune cells in the tumor microenvironment. Nat Immunol. 2013;14:1014-22.
45. Meyiah A, Khan FI, Alfaki DA, Murshed K, Raza A, Elkord E. The colorectal cancer microenvironment: Preclinical progress in identifying targets for cancer therapy. Transl Oncol. 2025;53:102307.
47. Sharpe AH, Pauken KE. The diverse functions of the PD1 inhibitory pathway. Nat Rev Immunol. 2018;18:153-67.
48. Murray PJ, Allen JE, Biswas SK, et al. Macrophage activation and polarization: nomenclature and experimental guidelines. Immunity. 2014;41:14-20.
49. Sorino J, Della Mura M, Ingravallo G, et al. Fusobacterium nucleatum and gastric cancer: an emerging connection. Int J Mol Sci. 2025:26.
51. Fridman WH, Zitvogel L, Sautès-Fridman C, Kroemer G. The immune contexture in cancer prognosis and treatment. Nat Rev Clin Oncol. 2017;14:717-34.
52. Wei SC, Levine JH, Cogdill AP, et al. Distinct cellular mechanisms underlie anti-CTLA-4 and anti-PD-1 checkpoint blockade. Cell. 2017;170:1120-33.e17.
53. DeNardo DG, Ruffell B. Macrophages as regulators of tumour immunity and immunotherapy. Nat Rev Immunol. 2019;19:369-82.
54. Sharma P, Allison JP. Immune checkpoint targeting in cancer therapy: toward combination strategies with curative potential. Cell. 2015;161:205-14.
55. Zhang L, Zhao L, Lin X, et al. Comparison of tumor non-specific and PD-L1 specific imaging by near-infrared fluorescence/cerenkov luminescence dual-modality in-situ imaging. Mol Imaging. 2024;23:15353508241261473.
Cite This Article
How to Cite
Download Citation
Export Citation File:
Type of Import
Tips on Downloading Citation
Citation Manager File Format
Type of Import
Direct Import: When the Direct Import option is selected (the default state), a dialogue box will give you the option to Save or Open the downloaded citation data. Choosing Open will either launch your citation manager or give you a choice of applications with which to use the metadata. The Save option saves the file locally for later use.
Indirect Import: When the Indirect Import option is selected, the metadata is displayed and may be copied and pasted as needed.
About This Article
Copyright

Data & Comments
Data
0


Comments
Comments must be written in English. Spam, offensive content, impersonation, and private information will not be permitted. If any comment is reported and identified as inappropriate content by OAE staff, the comment will be removed without notice. If you have any queries or need any help, please contact us at [email protected].