


Machine learning-based integration of omics and clinical data reveals an N-glycan biosynthesis signature predictive of the outcome in low-grade glioma: an in silico study
 0
0 
Abstract
Aim: This study explored the prognostic value of N-glycan biosynthesis (NGB) in lower-grade glioma (LGG) and aimed to develop a machine learning model for enhanced prognostic accuracy.
Method: LGG patient transcriptome data were analyzed to identify NGB-related genes. Consensus clustering identified subgroups based on NGB expression. A prognostic NGB signature (pNGB) was developed using machine learning. The pNGB score's association with cell proliferation, inflammation, treatment response, tumor recurrence, and the immune microenvironment was also explored.
Results: A 22-gene pNGB signature was identified, with MGAT1 and TUSC3 having the highest and lowest hazard ratios, respectively. Two distinct clusters (C1 and C2) with differential pNGB expression and survival outcomes were revealed. NGB pathway analysis indicated an overall poor prognosis, except for MGAT4C and TUSC3. The Enet-based survival model showed superior discriminatory power and reliability. The NGB risk score correlated with increased cell proliferation, inflammation, and altered immune landscape. Additionally, the score is linked to treatment response and tumor recurrence.
Conclusion: This study highlights the critical role of NGB in LGG progression and proposes a pNGB-based model for prognosis. The NGB risk score shows promise as a prognostic biomarker and potential therapeutic target in LGG.
Keywords
INTRODUCTION
Lower-grade gliomas (LGGs), comprising grade I and II gliomas according to the World Health Organization (WHO) classification, constitute approximately 7.6% of all brain tumors and 31.8% of gliomas[1]. Within five years, recurrence occurs in about 52%-62% of patients[2-4]. Among these recurrences, a subset progresses to high-grade gliomas (HGGs, WHO III-IV), estimated at 17%-32%[5-7]. The poorer prognosis of recurrent LGGs primarily stems from their malignant transformation. The primary treatment modality for LGG entails surgical resection, followed by radiation and chemotherapy; nevertheless, the prognosis remains unfavorable, with an average survival of seven years[8,9]. A significant disparity exists between clinical intervention and molecular pathological understanding. Therefore, investigating the intricate molecular pathology of LGG patients is imperative to impede or halt progression to HGG, deter recurrence, and enhance clinical outcomes. With the advancement of bioinformatics and machine learning, there is promising potential to comprehensively decipher molecular pathology and predict prognosis in oncological research[10,11].
Glycosylation stands as the most prevalent and well-recognized post-translational modification reaction, likely surpassing phosphorylation in frequency, the latter being involved in numerous cellular processes[12]. Within cancer, aberrant glycosylation is a common occurrence, representing not only a hallmark of cancer cells but also a feature of the tumor microenvironment[13]. Among glycosylation types, asparagine-linked (N-linked) protein glycosylation holds paramount importance. The N-glycan biosynthesis (NGB) entails multiple steps spanning different cellular compartments. After transcription and translation, proteins translocate to the endoplasmic reticulum (ER) lumen to acquire specific glycan chains, typically a tetradecasaccharide. Subsequent modifications occur in the ER lumen and Golgi apparatus before proteins reach their intended destinations[13]. Dysregulated NGB has been associated with various facets of cancer progression, including cell adhesion, migration, and immune evasion[14-16]. However, the precise involvement of N-glycan biosynthesis in LGG pathogenesis and its clinical ramifications remain inadequately elucidated.
In this study, we explore the prognostic significance of NGB signature in LGG using integrative bioinformatics approaches. By analyzing large-scale transcriptomic data from The Cancer Genome Atlas (TCGA), we identify a prognostic NGB signature (pNGB) comprising genes associated with patient survival. Leveraging machine learning algorithms, we construct and validate pNGB-based survival models to improve prognostic prediction in LGG. Patients with a higher risk score according to NGB-based survival model were characterized by enhanced proliferation and inflammation. Additionally, we investigate the association between NGB and clinical parameters, including treatment response, tumor recurrence, and the immune microenvironment. By integrating multi-omics data from TCGA and Chinese Glioma Genome Atlas (CGGA), we delineate the relationship between NGB dysregulation and LGG progression, providing insights into potential prognostic biomarkers and therapeutic targets. Thus, our study unraveled the intricate interplay between NGB and LGG biology, offering novel avenues for prognostic assessment and therapeutic intervention in this challenging disease context.
MATERIALS AND METHODS
LGG transcriptome data acquisition and processing
The RNA sequencing data of the TCGA LGG study was obtained through the use of the R package TCGABiolinks[17]. Additional clinical information, such as survival statistics and tumor stage, was obtained from the Genomic Data Commons (GDC) Data Portal (https://gdc.cancer.gov/about-data/publications/pancanatlas). The transcriptome datasets of the Chinese Glioma Genome Atlas (CGGA) study were acquired from the CGGA website (http://www.cgga.org.cn) using the dataset IDs mRNA_seq325 and mRNAseq_693. To harmonize the three LGG datasets, all of them were log2(x + 1) transformed, checking missing values and quartile normalized. Hierarchical clustering was employed to detect outliers, and no obvious outliers were identified. We used common genomic annotations and platforms to align the datasets, ensuring that the same genes are consistently labeled across both datasets. Batch correlation was applied by the R package limma normalizeBetweenArrays function. The R package biomaRt was utilized to convert ENSEMBLE IDs to gene symbols[18].
Single sample gene set enrichment analysis
R package GSVA was employed to perform Single sample gene set enrichment analysis (ssGSEA) analysis with parameters of method = “ssgsea”,
Survival analysis
The Cox hazard analysis and Kaplan-Meier (KM) survival analysis were carried out using the R package survival. The high and low groups in the KM analysis were determined by the median value as well as surv_cutpoint suggested optimal cutpoint of relative condition. The surv_cutpoint function from R package survminer is an outcome-oriented method providing a value of a cutpoint that corresponds to the most significant relation with survival. The results were comparable and the median value was selected as the final optimal cutpoint. The KM survival plot was then visualized using the “ggsurvplot” function in the
Cells infiltration estimation
The immune cell relative infiltration in LGG transcriptome, including TCGA and CGGA datasets, was quantified by R package xCell[20].
Consensus clustering
The 22 significant survival genes of NGB were utilized in uncovering sub-clusters within the TCGA LGG cohort through the use of a resampling method known as consensus clustering. The optimal number of clusters was determined through a synthesis of the consensus score matrix, CDF curve, PAC score, and Nbclust. The R package ConsensusClusterPlus was employed for this analysis[21]. The differential expression genes (DEGs) were determined by R package limma[22].
NGB-based machine learning survival model construction and validation
The concept originated from a previous study[23]. We integrated 10 machine learning algorithms and 22 algorithm combinations, including random survival forest (RSF), elastic network (Enet), Lasso, Ridge, stepwise Cox, CoxBoost, partial least squares regression for Cox (plsRcox), supervised principal components (SuperPC), generalized boosted regression modeling (GBM), and survival support vector machine (survival-SVM). The survival model construction and validation procedure was as follows: (1) 22 NGB genes identified in the TCGA LGG cohort by survival analysis were selected as features in machine learning survival model; (2) 22 algorithm combinations were applied to build survival models within the TCGA LGG cohort; (3) All models were tested in TCGA LGG training set and two CGGA validation sets; and (4) The Harrell's Concordance Index (C-index) and Area Under the Curve (AUC) for 1, 3, and 5 years were calculated for each model across both training and validation datasets. Based on the top values of
Statistical analyses
R (Version 4.1.2) was used for all statistical tests. Spearman correlation analyses were conducted using R. The statistical analysis of ssGSEA scores between different conditions was performed using the Wilcoxon test. P-values of multiple testing were adjusted by false discovery rate (FDR). All P-values or FDR were considered significant if less than 0.05.
RESULTS
Identify prognostic NGB signature in the TCGA LGG cohort
The study's overall design is illustrated in Figure 1. Initially, we established a prognostic NGB signature through survival analysis of the TCGA LGG transcriptome. Among 50 NGB genes examined, 22 exhibited significance in both Kaplan-Meier (KM) and Cox tests, constituting the prognostic NGB (pNGB) signature [Figure 2A and B]. Notably, MGAT1 and TUSC3 displayed the highest and lowest hazard ratios (HR), respectively [Figure 2B]. Utilizing the pNGB genes, we conducted a consensus cluster analysis, categorizing TCGA LGG tumor subjects into k clusters, with a value of k = 2 being optimal based on the proportion of ambiguous clustering (PAC) statistic [Figure 2C and D]. The resulting two consensus clusters

Figure 1. The Workflow of the study.

Figure 2. Prognostic Impact of N-Glycan Biosynthesis Gene Signature in LGG. (A) Venn plot displaying the overlap among N-Glycan Biosynthesis (NGB) pathway genes, Kaplan-Meier (KM)-significant genes, and univariate-COX-significant genes. (B) Dot plot illustrating cluster number and the proportion of ambiguous clustering. (C) Consensus score matrix for all samples at k = 2. A lower consensus score indicates a higher likelihood of samples being grouped into the same cluster in different iterations. (D) Forest plot presenting prognostic NGB signatures. HR > 1 indicates a poor prognosis, while HR < 1 signifies the opposite. (E) Heatmap depicting prognostic NGB genes in the two clusters identified by ConsensusClusterPlus. Relative sample information is annotated on the top. (F) Kaplan-Meier curves for overall survival between the two sub-clusters. (G) NGB pathway representation for the two clusters. HR values are color-annotated, with red indicating poor prognosis and blue indicating the opposite.
Construct and validate the NGB-based intergraded machine learning survival models
Subsequently, we aimed to develop a pNGB-based survival model to enhance LGG outcomes. Twenty-two pNGBs underwent a machine learning-based integrative procedure to construct 22 candidate survival models. The initial application of the procedure in the TCGA LGG dataset involved training via the leave-one-out cross-validation (LOOCV) framework, followed by calculation of the C-index for each model in the TCGA LGG training set and two CGGA validation datasets [Figure 3A]. Intriguingly, 15 out of 22 candidate models demonstrated good discriminatory power (C-index > 0.7), predominantly Enet-related models [Figure 3A]. Further evaluation through ROC analysis revealed favorable performance of the Enet (α = 0.4) model, with higher ranks in both C-index and AUCs across training and validation datasets [Figure 3B]. Since the parsimonious nature of the Enet model aligns with Occam's razor principle, Enet can perform variable selection by driving some coefficients to exactly zero. This helps to identify the most relevant features in the model. Therefore, Enet (α= 0.4) survival model was picked up for further analysis for its simplicity and predictive accuracy. Within this model, optimal λ was determined via LOOCV, with seven pNGBs employed, notably ALG6 showing the highest coefficient, indicating its importance as a feature
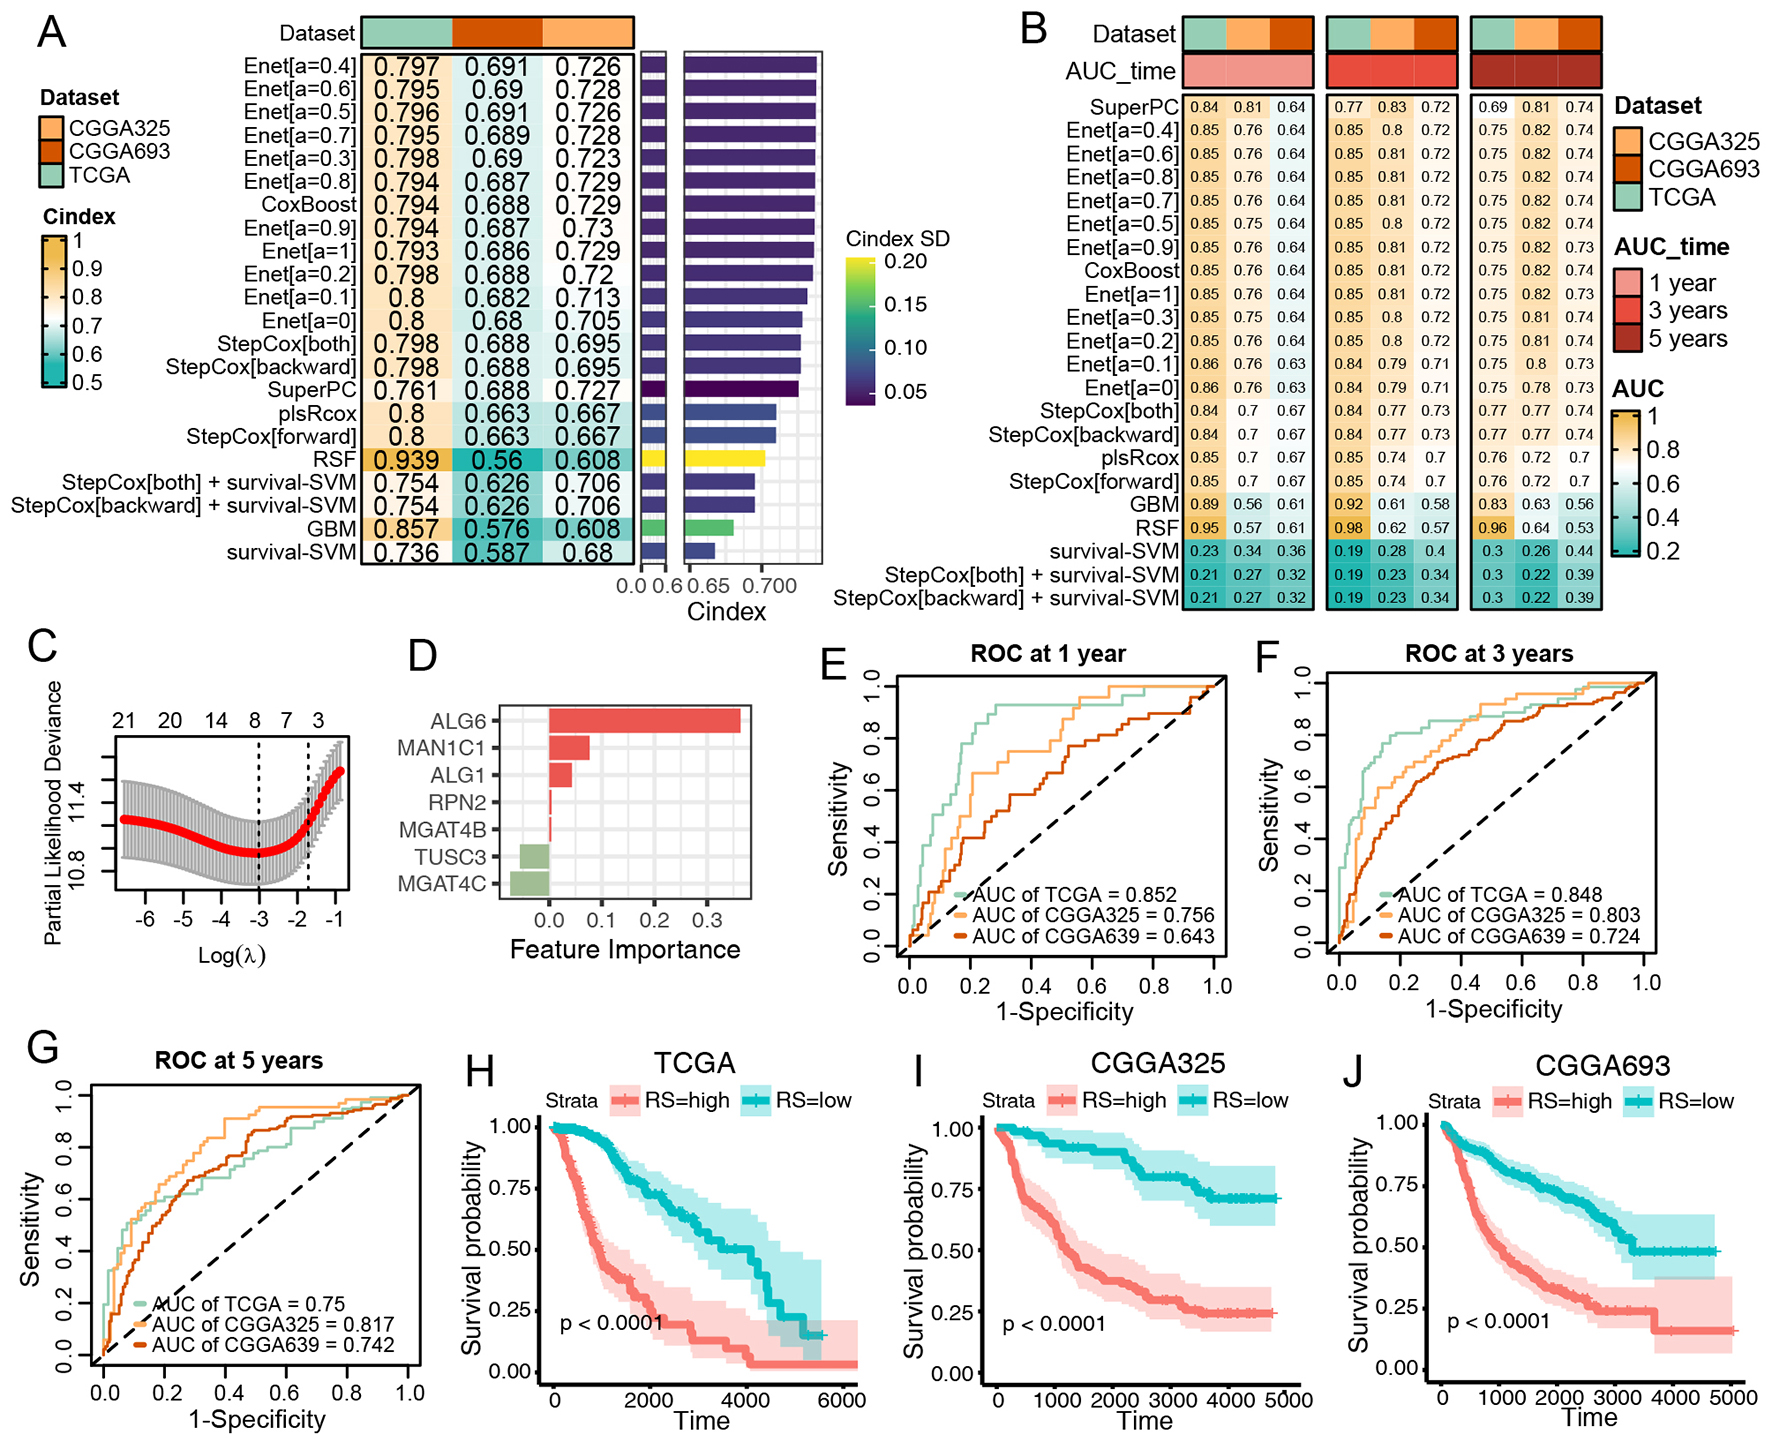
Figure 3. Construction and Validation of N-Glycan Biosynthesis (NGB)-Based Integrated Machine Learning Survival Models. (A) Heatmap displaying the Concordance Index (C-index) of 33 prediction models using Leave-One-Out Cross-Validation (LOOCV) in the TCGA training dataset and two CGGA validation datasets. Mean C-index is presented on the right. (B) Heatmap illustrating the Area Under the Curve (AUC) of 33 prediction models via LOOCV in the TCGA training dataset and two CGGA validation datasets. (C) Plot of Partial Likelihood Deviance against log(lambda) in the Lasso model. Vertical dotted lines indicate lambda values with the minimum error and one standard error (SE) of the minimum. (D) Coefficients of the Lasso model. (E-G) ROC curves at 1, 3, and 5 years for the Lasso model in TCGA (E), CGGA325 (F), and CGGA693 (G). Colors represent the relative time. (H-J) Kaplan-Meier curves for the risk score predicted by the Lasso model in TCGA (H), CGGA325 (I), and CGGA693 (J).
NGB high-risk patients were enriched in cell proliferation and inflammation
To further elucidate the NGB-related molecular signature, DEG analysis was conducted between high- and low-risk LGG patients across three datasets. A total of 349 and 399 DEGs were identified as enriched and suppressed in high-risk patients, respectively [Figure 4A and B]. Upregulated DEGs in high-risk patients were enriched in immune response pathways, such as Th1, Th2, and Th17 cell differentiation, antigen processing and presentation, and ECM-receptor interaction, whereas downregulated DEGs were primarily associated with normal neuroactive processes [Figure 4C and D]. Subsequent evaluation of hallmark signaling heterogeneity between high- and low-risk groups revealed higher levels of proliferation, inflammatory response, and epithelial-mesenchymal transition in high-risk patients [Figure 4E]. These results underscored the significant association between NGB and cancer cell proliferation, as well as the inflammatory tumor microenvironment.

Figure 4. The elevated NGB risk score was linked to increased levels of both cell proliferation and inflammation. (A and B) The Venn plot of enriched (A) and suppressed (B) DEGs in high-risk patients among the TCGA and CGGA cohorts. (C and D) The dot plot of shared enriched (C) and suppressed (D) DEGs KEGG enrichment analysis. (E) The heatmap illustrates the statistical differences in ssGSEA scores between the high- and low-risk groups across both the TCGA and CGGA cohorts.
NGB risk score is associated with first treatment response, tumor recurrence and immune microenvironment remodeling
We further investigated the NGB risk score with other clinical and immune signatures of LGG. Interestingly, compared to the progressive disease, the response and stable disease state had a significantly lower risk score (P < 0.0001, Figure 5A), highlighting that NGB might play an important role in first-treatment outcomes. Moreover, in TCGA and CGGA datasets, the NGB risk score was all higher in recurrent tumors compared to primary tumors [Figure 5B-D]. Last but not least, we applied the co-analysis of the NGB risk score with the immune microenvironment. It was worth noting that the NGB risk score was consistently positively correlated with macrophages, DC, monocytes, mast cells, CD4+ memory T cells,

Figure 5. Association of Lasso Model-Predicted Risk Score with Treatment Response, Tumor Recurrence, and Immune Infiltration. (A) Boxplot illustrating the distribution of risk scores in differential responses to the first treatment. (B-D) Boxplots presenting the distribution of risk scores in primary and recurrent tumors in TCGA (B), CGGA325 (C), and CGGA693 (D) datasets. (E) Heatmap showing Spearman correlation of risk scores with immune infiltration in TCGA and CGGA datasets. Significance levels: *P < 0.05,
DISCUSSION
Our study offers a comprehensive investigation into the prognostic significance and functional implications of NGB in LGG, a topic not previously explored. N-glycosylation significantly impacts cancer by initiating oncogenic signaling pathways, including Wnt/β-catenin, Hippo, PI3K/Akt, JAK/STAT, TGF-β/Smad, and Notch. Evidence suggests that abnormal modifications of cell surface proteins, such as transmembrane proteins and growth factor receptors, promote tumor growth, invasion, and metastasis through the activation of these signaling cascades[24]. Through integrated analyses utilizing three transcriptomic datasets from the TCGA and CGGA LGG cohorts, we have delineated the prognostic role of NGB in LGG, established an NGB-based prognostic model, and characterized the molecular and tumor microenvironment heterogeneity between high- and low-risk groups. The prognostic relevance of NGB in LGG is highlighted by the identification of a 22-gene signature (pNGB), demonstrating significant associations with patient survival outcomes. Notably, among the pNGB genes, MGAT1, the most malignant, has been reported to be enriched in glioblastoma and promote glioma cell proliferation through the upregulation of glucose transportation[25]. In contrast, TUSC3 sensitizes glioblastoma to temozolomide by epigenetic reprogramming, and reverses the effects of miR-UL112-3p on GBM progression via the AKT signaling pathway[26,27]. Importantly, our study also revealed that patients at higher risk exhibited enhanced glycolysis, further supporting the role of NGB in metabolic alterations associated with LGG pathogenesis. Furthermore, other pNGB genes, such as MGAT4B, ALG3, and DDOST, have been identified as playing significant roles in shaping the immunosuppressive microenvironment[28-30]. Our study also revealed a correlation between the NGB risk score and tumor microenvironment remodeling, specifically highlighting associations with inflammatory phenotypes (M1 macrophages, cDCs) and immune regulatory phenotypes (Th2 cells and Tregs). Notably, Tregs showed a negative correlation with the NGB risk score, indicating their potential role as immune inhibitory components in the tumor microenvironment, warranting further investigation. These findings suggest that NGB is closely related to LGG metabolism and the immune microenvironment, potentially serving as metabolic checkpoints in both molecular pathology and clinical practice.
Building upon these prognostic insights, we developed and validated machine learning-based survival models integrating pNGB signatures, demonstrating robust discriminatory power across multiple datasets. Surprisingly, the pNGB signature exhibited high accuracy and sensitivity among various machine learning models, supporting the notion that NGB is a critical signature in LGG prognosis. Moreover, the parsimonious nature of the Enet model aligns with Occam's razor principle, emphasizing its simplicity and predictive accuracy. The superior performance of the Enet survival model underscores its potential clinical utility in predicting LGG patient outcomes.
To further elucidate the molecular underpinnings of NGB in LGG, we compared molecular, tumor microenvironment, and clinical features between high- and low-risk LGG patients. Functional analyses revealed the enrichment of pathways related to immune response, cell proliferation, and inflammatory signaling in high-risk patients. Specifically, TNF, IL6, TGF-β, and IFN signaling were all upregulated in the high-risk group. Previous studies have demonstrated that inflammatory responses, such as IFN-γ and
To further extend the clinical translation value of our study, we systematically searched DrugBank, ApexBio, DGIdb, HMDB, and Tocris, identifying several candidates targeting the relevant genes. The details are listed in the Supplementary Table 1. Among these, Asparagine demonstrated the most credible treatment potential, targeting RPN2, DDOST, STT3A, DPAGT1, and MAN2A1. Additionally, Acarbose and Beta-D-Glucose also showed some approved treatment potential [Supplementary Table 1].
However, our research has some limitations. Firstly, while the study identified an NGB signature associated with prognosis, in vitro and in vivo functional validation is needed to elucidate the mechanistic link between NGB dysregulation and LGG progression. Secondly, the cellular sources of NGB were not investigated in the current study, requiring advanced research methods such as single-cell RNA sequencing or experiments. Lastly, the NGB-based model requires validation in larger and more diverse patient cohorts to ensure generalizability.
In conclusion, our study provides comprehensive insights into the prognostic significance and functional implications of NGB in LGG. By integrating multi-omics data and machine learning approaches, we have elucidated the intricate interplay between N-Glycan biosynthesis, tumor biology, and clinical outcomes, paving the way for further research and therapeutic interventions in LGG management.
DECLARATIONS
Acknowledgments
We extend our appreciation to all the researchers who generously shared the data utilized in this study. We also express our gratitude to TCGA and CGGA for their invaluable contribution in providing the data to the public.
Authors' contributions
Designed the study, wrote and revise the manuscript: Zhu Y, Qian C, Zhang Y
Ran the bioinformatics analyses: Zhu Y, Geng L
provided clinical specimens and data, technical support, and conceptual advice: Bo F, Xu Y, Wei J
Availability of data and materials
Publicly available datasets were utilized in this study. The TCGA LGG transcriptome data can be accessed from the GDC Data Portal (https://gdc.cancer.gov/about-data/publications/pancanatlas). Additionally, the transcriptome datasets from the Chinese Glioma Genome Atlas (CGGA) study were obtained from the CGGA website (http://www.cgga.org.cn) using the dataset IDs mRNA_seq325 and mRNAseq_693.
Financial support and sponsorship
The present study was supported by the General Project of Nanjing Medical Science and Technology Development (Grant No. YKK22142) and the Youth Talent Project of Nanjing Brain Hospital (Grant No. 23-25-2R7).
Conflicts of interest
All authors declared that there are no conflicts of interest.
Ethical approval and consent to participate
Not applicable.
Consent for publication
Not applicable.
Copyright
© The Author(s) 2024.
Supplementary Materials
REFERENCES
1. Teng C, Zhu Y, Li Y, et al. Recurrence- and malignant progression-associated biomarkers in low-grade gliomas and their roles in immunotherapy. Front Immunol 2022;13:899710.
2. Fukuya Y, Ikuta S, Maruyama T, et al. Tumor recurrence patterns after surgical resection of intracranial low-grade gliomas. J Neurooncol 2019;144:519-28.
3. Shaw EG, Berkey B, Coons SW, et al. Recurrence following neurosurgeon-determined gross-total resection of adult supratentorial low-grade glioma: results of a prospective clinical trial. J Neurosurg 2008;109:835-41.
5. Murphy ES, Leyrer CM, Parsons M, et al. Risk factors for malignant transformation of low-grade glioma. Int J Radiat Oncol Biol Phys 2018;100:965-71.
6. Westphal M, Lamszus K. The neurobiology of gliomas: from cell biology to the development of therapeutic approaches. Nat Rev Neurosci 2011;12:495-508.
7. Jansen E, Hamisch C, Ruess D, et al. Observation after surgery for low grade glioma: long-term outcome in the light of the 2016 WHO classification. J Neurooncol 2019;145:501-7.
8. Poff A, Koutnik AP, Egan KM, Sahebjam S, D’Agostino D, Kumar NB. Targeting the warburg effect for cancer treatment: ketogenic diets for management of glioma. Semin Cancer Biol 2019;56:135-48.
9. Claus EB, Walsh KM, Wiencke JK, et al. Survival and low-grade glioma: the emergence of genetic information. Neurosurg Focus 2015;38:E6.
10. Tran TO, Vo TH, Lam LHT, Le NQK. ALDH2 as a potential stem cell-related biomarker in lung adenocarcinoma: comprehensive multi-omics analysis. Comput Struct Biotechnol J 2023;21:1921-9.
11. Dang HH, Ta HDK, Nguyen TTT, et al. Identifying GPSM family members as potential biomarkers in breast cancer: a comprehensive bioinformatics analysis. Biomedicines 2021;9:1144.
12. Taniguchi N, Kizuka Y. Glycans and cancer: role of N-glycans in cancer biomarker, progression and metastasis, and therapeutics. Adv Cancer Res 2015;126:11-51.
13. Pinho SS, Reis CA. Glycosylation in cancer: mechanisms and clinical implications. Nat Rev Cancer 2015;15:540-55.
14. Medina-Cano D, Ucuncu E, Nguyen LS, et al. High N-glycan multiplicity is critical for neuronal adhesion and sensitizes the developing cerebellum to N-glycosylation defect. Elife 2018;7:e38309.
15. Xu Q, Wang W, Qu C, et al. Chitosan oligosaccharides inhibit epithelial cell migration through blockade of N-acetylglucosaminyltransferase V and branched GlcNAc structure. Carbohydr Polym 2017;170:241-6.
16. Cui Y, Li J, Zhang P, et al. B4GALT1 promotes immune escape by regulating the expression of PD-L1 at multiple levels in lung adenocarcinoma. J Exp Clin Cancer Res 2023;42:146.
17. Colaprico A, Silva TC, Olsen C, et al. TCGAbiolinks: an R/Bioconductor package for integrative analysis of TCGA data. Nucleic Acids Res 2016;44:e71.
18. Durinck S, Spellman PT, Birney E, Huber W. Mapping identifiers for the integration of genomic datasets with the R/Bioconductor package biomaRt. Nat Protoc 2009;4:1184-91.
19. Hänzelmann S, Castelo R, Guinney J. GSVA: gene set variation analysis for microarray and RNA-seq data. BMC Bioinformatics 2013;14:7.
20. Aran D, Hu Z, Butte AJ. xCell: digitally portraying the tissue cellular heterogeneity landscape. Genome Biol 2017;18:220.
21. Wilkerson MD, Hayes DN. ConsensusClusterPlus: a class discovery tool with confidence assessments and item tracking. Bioinformatics 2010;26:1572-3.
22. Ritchie ME, Phipson B, Wu D, et al. Limma powers differential expression analyses for RNA-sequencing and microarray studies. Nucleic Acids Res 2015;43:e47.
23. Liu Z, Liu L, Weng S, et al. Machine learning-based integration develops an immune-derived lncRNA signature for improving outcomes in colorectal cancer. Nat Commun 2022;13:816.
25. Li Y, Liu Y, Zhu H, et al. N-acetylglucosaminyltransferase I promotes glioma cell proliferation and migration through increasing the stability of the glucose transporter GLUT1. FEBS Lett 2020;594:358-66.
26. Wu Q, Berglund AE, Macaulay RJ, Etame AB. Epigenetic activation of TUSC3 sensitizes glioblastoma to temozolomide independent of MGMT promoter methylation status. Int J Mol Sci 2023;24:15179.
27. Liang Q, Wang K, Wang B, Cai Q. HCMV-encoded miR-UL112-3p promotes glioblastoma progression via tumour suppressor candidate 3. Sci Rep 2017;7:44705.
28. Chang X, Pan J, Zhao R, et al. DDOST correlated with malignancies and immune microenvironment in gliomas. Front Immunol 2022;13:917014.
29. Qi Y, Lv W, Liu X, et al. Comprehensive analysis identified glycosyltransferase signature to predict glioma prognosis and TAM phenotype. Biomed Res Int 2023;2023:6082635.
30. Liu P, Lin C, Liu Z, et al. Inhibition of ALG3 stimulates cancer cell immunogenic ferroptosis to potentiate immunotherapy. Cell Mol Life Sci 2022;79:352.
31. Lin W, Gao J, Zhang H, et al. Identification of molecular subtypes based on inflammatory response in lower-grade glioma. Inflamm Regen 2022;42:29.
32. Han T, Zuo Z, Qu M, Zhou Y, Li Q, Wang H. Comprehensive analysis of inflammatory response-related genes, and prognosis and immune infiltration in patients with low-grade glioma. Front Pharmacol 2021;12:748993.
33. Geng F, Shi BZ, Yuan YF, Wu XZ. The expression of core fucosylated E-cadherin in cancer cells and lung cancer patients: prognostic implications. Cell Res 2004;14:423-33.
34. Isaji T, Im S, Kameyama A, Wang Y, Fukuda T, Gu J. A complex between phosphatidylinositol 4-kinase IIα and integrin α3β1 is required for N-glycan sialylation in cancer cells. J Biol Chem 2019;294:4425-36.
35. Li R, Li H, Yang X, Hu H, Liu P, Liu H. Crosstalk between dendritic cells and regulatory T cells: protective effect and therapeutic potential in multiple sclerosis. Front Immunol 2022;13:970508.
Cite This Article

How to Cite
Zhu Y, Geng L, Bo F, Xu Y, Wei J, Zhang Y, Qian C. Machine learning-based integration of omics and clinical data reveals an N-glycan biosynthesis signature predictive of the outcome in low-grade glioma: an in silico study. J Cancer Metastasis Treat. 2024;10:23. http://dx.doi.org/10.20517/2394-4722.2024.32
Download Citation
Export Citation File:
Type of Import
Tips on Downloading Citation
Citation Manager File Format
Type of Import
Direct Import: When the Direct Import option is selected (the default state), a dialogue box will give you the option to Save or Open the downloaded citation data. Choosing Open will either launch your citation manager or give you a choice of applications with which to use the metadata. The Save option saves the file locally for later use.
Indirect Import: When the Indirect Import option is selected, the metadata is displayed and may be copied and pasted as needed.
About This Article
Copyright

Data & Comments
Data
0


Comments
Comments must be written in English. Spam, offensive content, impersonation, and private information will not be permitted. If any comment is reported and identified as inappropriate content by OAE staff, the comment will be removed without notice. If you have any queries or need any help, please contact us at support@oaepublish.com.