

fig8
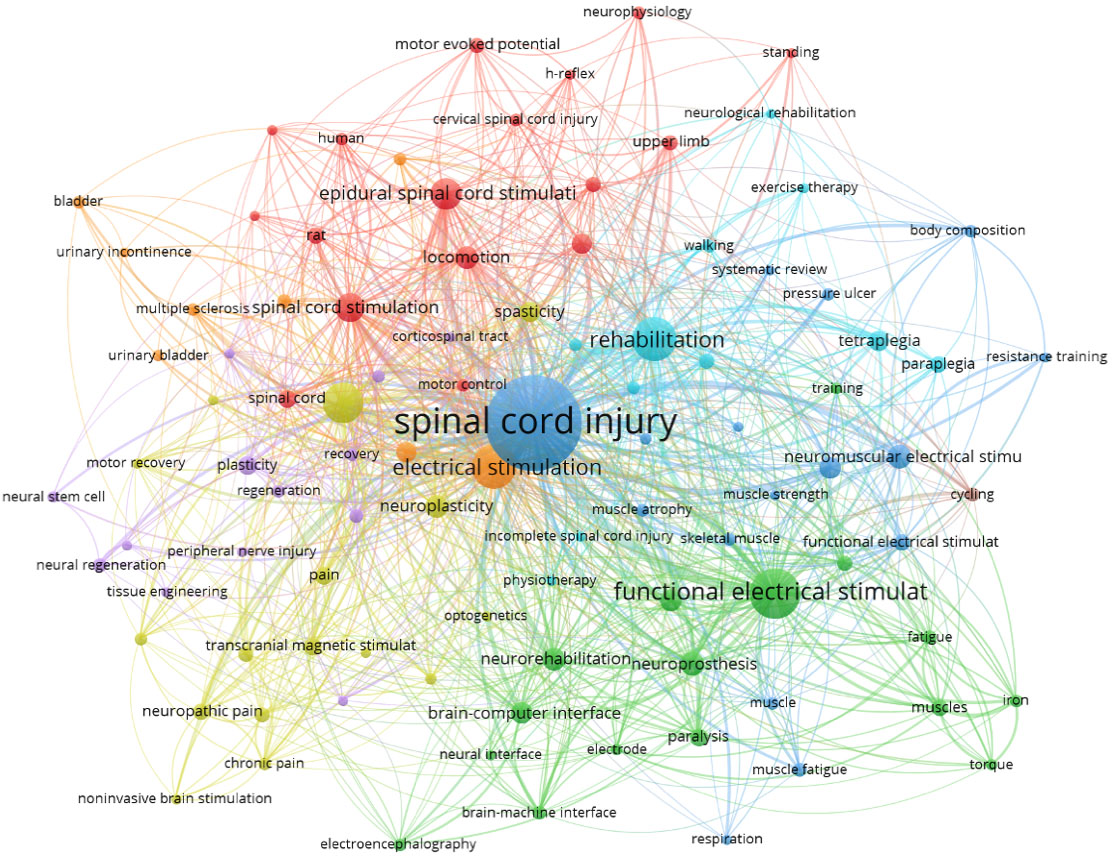
Figure 8. Visual map using VOSviewer network among keywords. Each node represents a keyword, with node size proportional to its occurrence frequency. Node colors and connecting lines represent distinct research clusters and co-occurrence links, mapping the core domains and sub-themes in the field.

