



Predicting cardiovascular-kidney-metabolic multimorbidity in Chinese adults with overweight and obesity using machine learning: an internal evaluation
 0
0 
Abstract
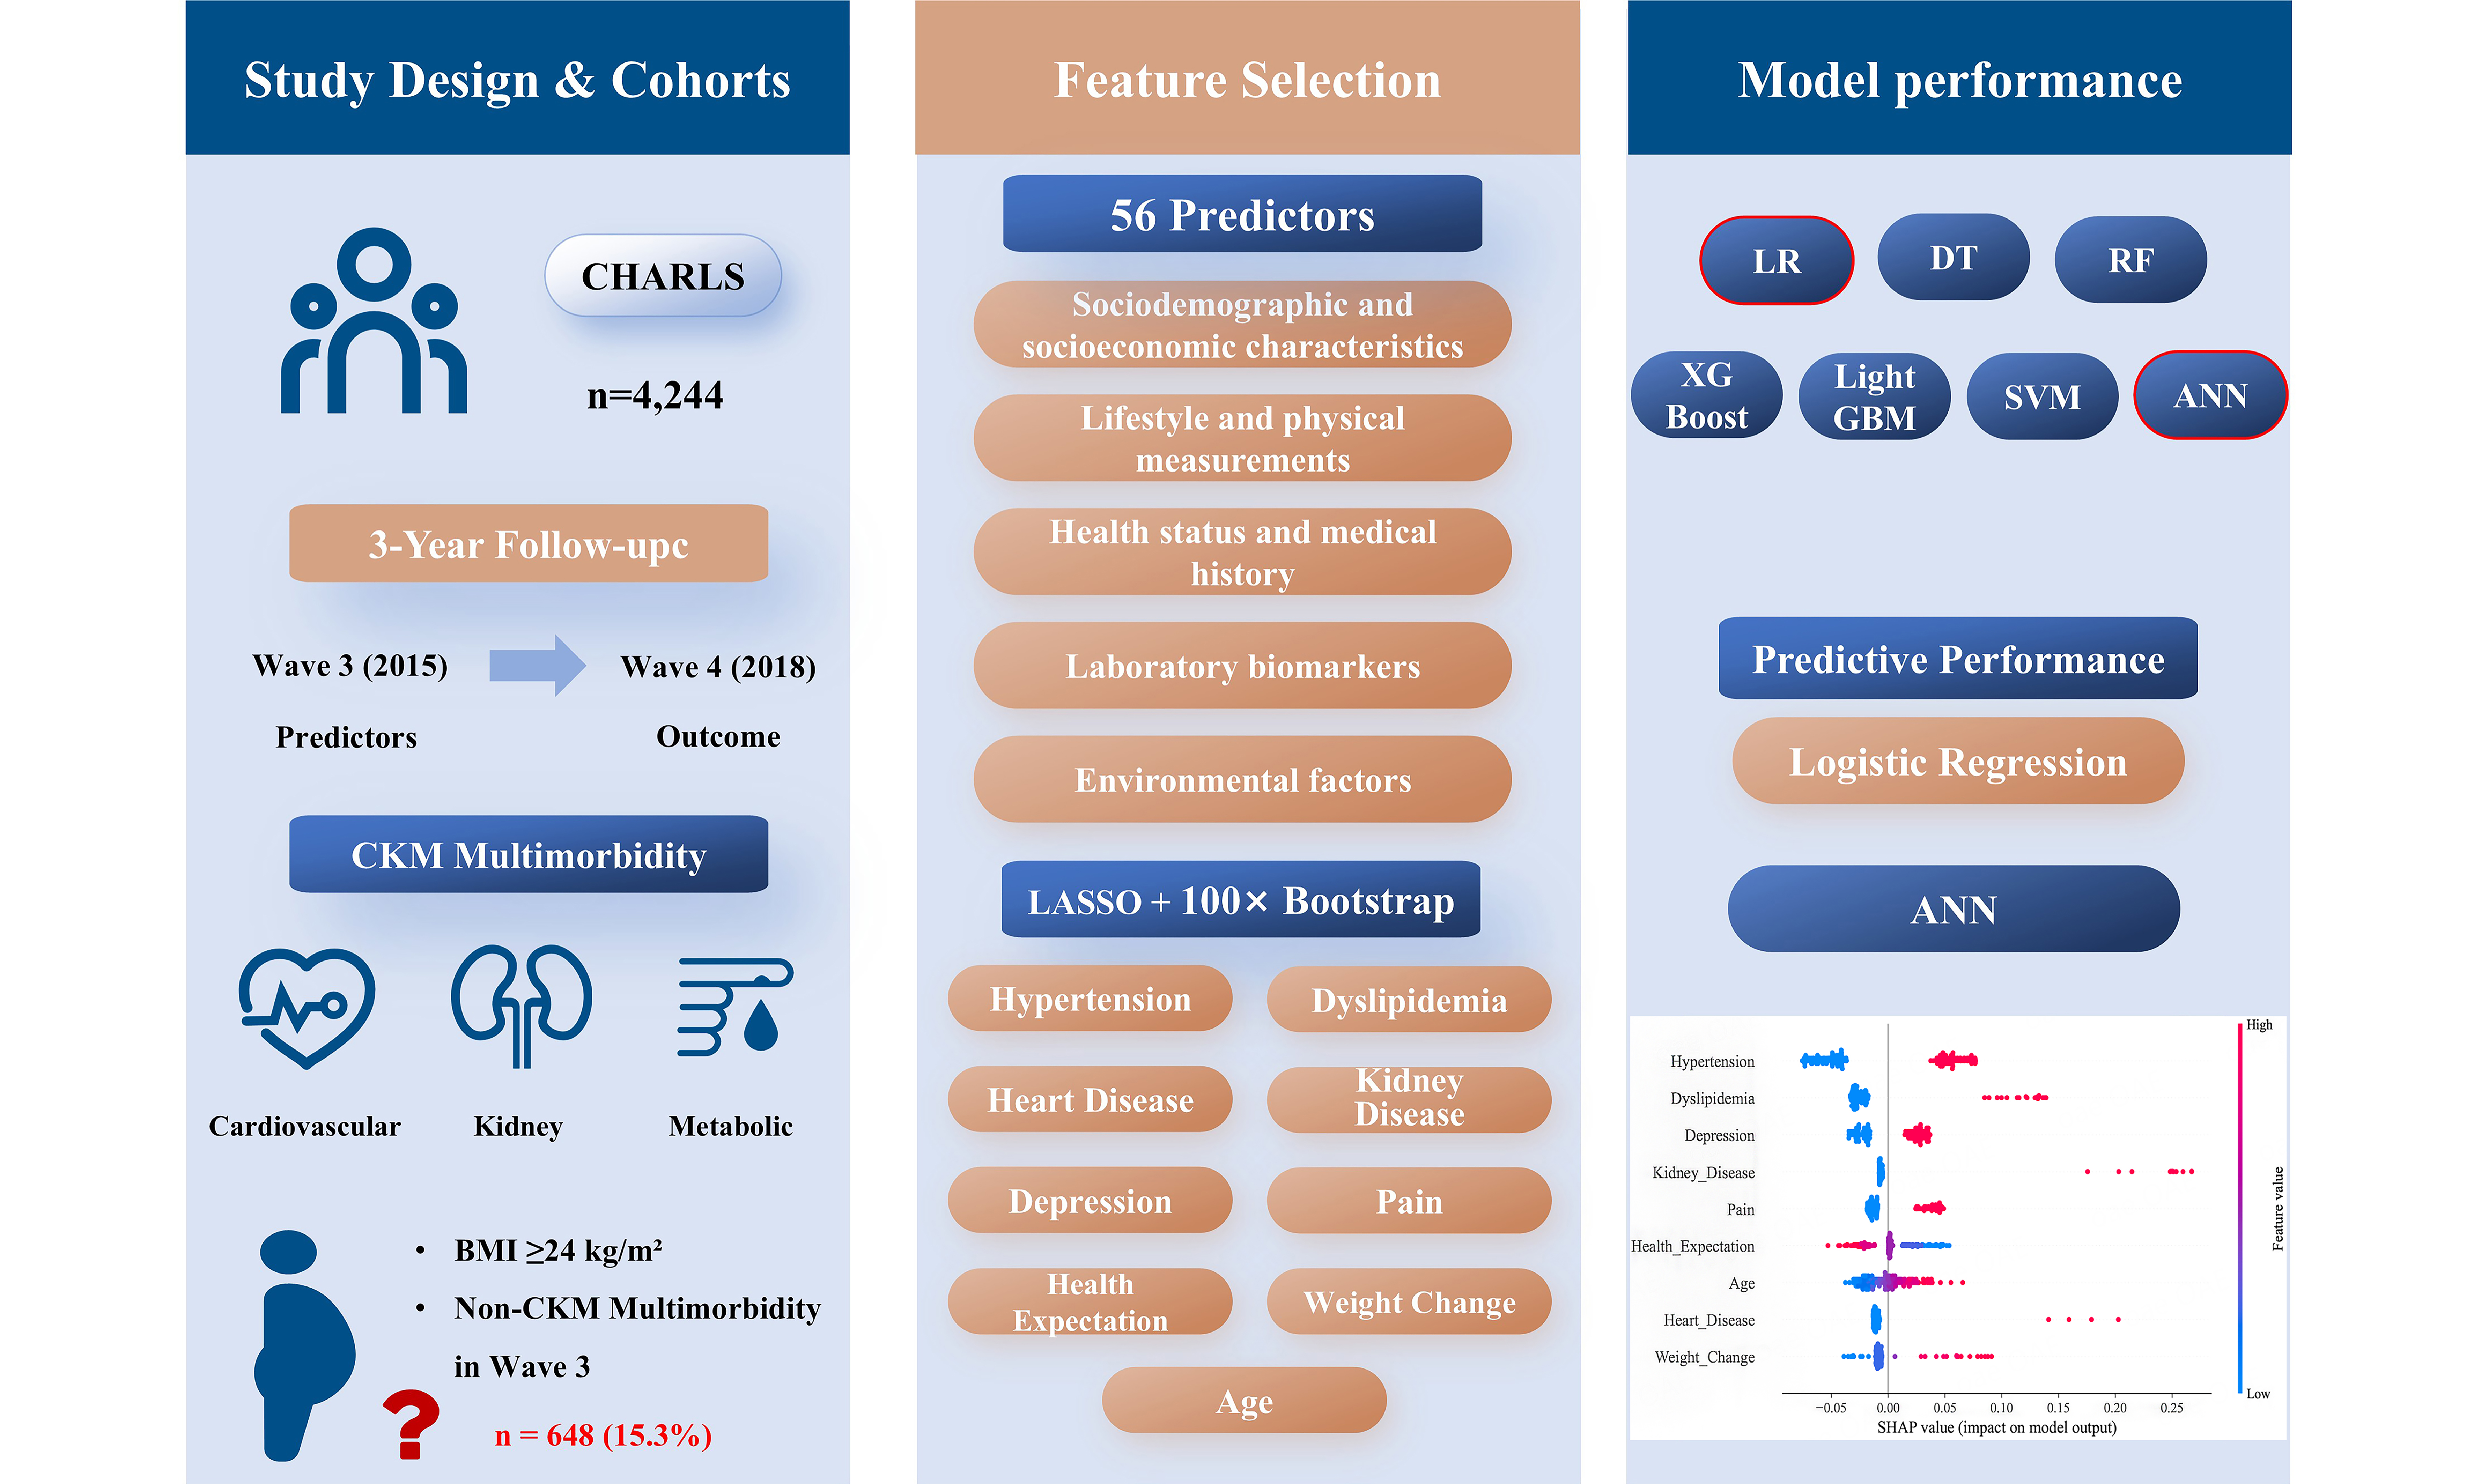
Aim: To develop and internally evaluate machine learning (ML) models for predicting incident cardiovascular-kidney-metabolic (CKM) multimorbidity in Chinese adults with overweight or obesity, and to identify key predictors.
Methods: We included 4,244 participants from the China Health and Retirement Longitudinal Study (CHARLS) with overweight/obesity [body mass index (BMI) ≥
Results: During 3-year follow-up, 648 (15.3%) participants developed incident CKM multimorbidity. Nine predictors were selected: age, depression, pain, health expectation, weight change, dyslipidemia, hypertension, heart disease, and kidney disease. Artificial neural network (ANN) and logistic regression showed the best discrimination (AUC: 0.758 and 0.757) and acceptable calibration in internal testing (Brier score: 0.113 and 0.114). SHAP analysis identified hypertension, dyslipidemia, and depression as top contributors. A nomogram was developed for preliminary risk stratification, but external validation is required before any clinical application.
Conclusion: In this internal evaluation, ANN and logistic regression showed moderate discrimination and acceptable calibration for predicting CKM multimorbidity in Chinese adults with overweight/obesity. Logistic regression performed comparably to complex algorithms yet is simpler; however, external validation is still required before use.
Keywords
INTRODUCTION
The global burden of non-communicable diseases is increasingly shaped by the complex interplay between cardiovascular disease (CVD), chronic kidney disease (CKD), and metabolic disorders including diabetes and obesity[1]. These conditions, once managed in clinical silos, are now recognized as pathophysiologically interconnected through shared mechanisms such as insulin resistance, chronic inflammation, and neurohormonal activation[2,3]. This understanding has catalyzed integrated approaches to prevention and management. In a landmark 2023 Presidential Advisory, the American Heart Association (AHA) formalized this interconnectedness by introducing the concept of Cardiovascular-Kidney-Metabolic (CKM) health, defining CKM syndrome as a systemic disorder resulting from the interplay between metabolic risk factors, CKD, and the cardiovascular system[4]. Importantly, CKM multimorbidity - the co-occurrence of at least two diagnosed diseases from the cardiovascular, kidney, and metabolic groups - represents the advanced clinical endpoint of this pathological process. As recently operationalized by Shi et al. using the China Health and Retirement Longitudinal Study (CHARLS) data[5], this distinction is critical, as transition to overt multimorbidity marks a pivotal point associated with exponentially greater healthcare burdens and synergistic increases in mortality risk[6,7].
Individuals with overweight and obesity constitute a primary reservoir for CKM multimorbidity development. Excess adiposity directly fuels the metabolic disturbances, hemodynamic alterations, and pro-inflammatory milieu that precipitate injury across cardiovascular and renal systems[8,9]. In China, where over 50% of adults are now affected by overweight or obesity following rapid economic transitions, this creates a vast population at elevated risk and an urgent public health priority[10,11]. Accurately predicting which individuals within this high-risk pool will progress to CKM multimorbidity is essential for targeted prevention. While numerous prediction models exist for individual CKM components - diabetes[12], CVD[13], or CKD[14] - they are inadequate for forecasting their synergistic co-occurrence as a composite endpoint. Existing multimorbidity models often rely on traditional regression with limited predefined variables, overlooking complex, non-linear interactions among broader determinants including psychosocial factors, biomarkers, and environmental exposures[15]. Although recent machine learning (ML) approaches have shown promise in predicting cardiovascular risk in Asian populations[16,17], none have been specifically applied to the newly-defined endpoint of CKM multimorbidity among Chinese adults with overweight or obesity. The rich, multidimensional data from nationally representative cohorts like CHARLS provide an unparalleled opportunity to address this gap. Recent methodological work has demonstrated the potential of neural networks, Gaussian process regression, ensemble methods, and graphical techniques for modeling complex nonlinear patterns across diverse study subjects[18-20]; however, whether such complexity translates into improved prediction for CKM multimorbidity in our population remains an open question, motivating our systematic comparison of seven algorithms against Logistic Regression (LR).
Therefore, this study aims to address this research gap by developing and internally evaluating ML models for progression to incident CKM multimorbidity among Chinese middle-aged and older adults with overweight or obesity who had zero or one CKM disease group at baseline, using nationally representative longitudinal data from the CHARLS study. Our methodological approach features several innovations: (1) a robust two-stage feature selection combining least absolute shrinkage and selection operator (LASSO) regression with bootstrap stability analysis to identify the most reliable predictors from a comprehensive variable pool; (2) systematic comparison of seven ML algorithms against traditional LR to determine the optimal model; and (3) application of SHapley Additive exPlanations (SHAP) to enhance interpretability of the best-performing model, providing clinically meaningful insights into key risk factors. By specifically targeting CKM multimorbidity in this high-risk population, our findings aim to deliver a novel, data-driven tool for targeted identification (pending external validation) and guide future preventive strategies.
METHODS
Data source and study population
Data for this study were derived from the CHARLS, a prospective, nationally representative cohort of community-residing middle-aged and older Chinese adults. The survey utilizes a multistage probability sampling design that spans 28 provinces, 150 counties, and 450 villages, thereby ensuring broad geographic and socioeconomic diversity. The initial wave was fielded in 2011-2012, with subsequent follow-up assessments conducted at intervals of approximately two to three years[21]. The study protocol received ethical approval from the Peking University Ethics Review Committee (IRB No. IRB00001052-11015). Written informed consent was obtained from all participants at each wave of data collection.
For the present investigation, we utilized Wave 3 (conducted in 2015) as the baseline survey for collecting predictor variables and Wave 4 (conducted in 2018) as the follow-up wave for ascertaining CKM multimorbidity. This longitudinal design enabled us to establish temporal relationships between baseline risk factors and incident CKM multimorbidity. Participants were included if they: (1) were aged 45 years or older at Wave 3; (2) had available body mass index (BMI) measurements and were classified as having overweight or obesity according to the criteria for Chinese adults (BMI ≥ 24 kg/m2)[22,23]; (3) had no prior diagnosis of CKM multimorbidity in Wave 3; and (4) completed the Wave 4 follow-up assessment with available data for ascertaining CKM multimorbidity. Following the application of the predefined eligibility criteria, 4,244 individuals with overweight or obesity were ultimately enrolled in the final analytical sample. Supplementary Figure 1 provides a detailed flow diagram of the participant selection and exclusion process.
Feature selection
Candidate predictors were initially selected based on a comprehensive review of the literature and their potential association with CKM multimorbidity in individuals with overweight or obesity. These variables covered multiple domains and were derived from the CHARLS questionnaire, physical measurements, and laboratory tests. Sociodemographic characteristics included age, sex (male/female), geographic region (east/central/west), educational level (categorized as less than elementary school, elementary school, middle school, high school or above), marital status (married/others), residence (rural/urban), and self-rated living standard (poor, relatively poor, average, relatively high, very high). Socioeconomic status was constructed by combining educational level and total household wealth. Educational level was categorized as less than upper secondary education/primary (score 0), upper secondary & vocational training/secondary (score 1), and tertiary education/tertiary (score 2). Total household wealth, representing the sum of all wealth components (residence, business, vehicles, and saving accounts) excluding debts or loans, was divided into quartiles and scored from 0 (lowest) to 3 (highest). The SES score was then calculated by summing the education and wealth scores and classified into four categories: low (score 0), low-middle (scores 1-2), upper-middle (scores 3-4), and high (score 5)[24]. Social isolation was measured using four objective criteria: not being married (including those who were separated, divorced, widowed, or had never married), residing alone, having fewer than weekly contacts with children (whether by phone, in person, or email), and engaging in no social activities during the previous month (e.g., meeting friends, playing chess or cards, or attending sports or social clubs). Each indicator scored 1 point, yielding a total score ranging from 0 to 4; participants with a score ≥ 2 were classified as socially isolated (yes/no)[25]. Lifestyle variables included smoking status (yes/no), alcohol consumption (yes/no), sleep duration (categorized as ≤ 6 h, 6-8 h, or > 8 h), and metabolic equivalent of task (MET). MET was derived from self-reported frequency and duration of vigorous, moderate, and light physical activities, with each activity type assigned a weighting coefficient of 8.0, 4.0, and 3.3, respectively, to compute total weekly MET-minutes[26].
Psychological status was evaluated using the 8-item Center for Epidemiologic Studies Depression Scale; a total score of 10 or higher indicated depressive symptoms (yes/no)[27]. Dementia was identified through either self-reported physician-diagnosed memory-related diseases or the presence of both functional and cognitive impairment. Functional impairment was defined as dependency in at least one activity of daily living. Cognitive impairment was assessed using the Telephone Interview for Cognitive Status (TICS), defined as performance 1.5 standard deviations below the education-specific mean in at least two cognitive domains. Participants showing transient impairment with subsequent recovery were not classified as cases[28]. Chronic conditions were ascertained through a combination of self-reported physician diagnoses, medication use, and laboratory or physical measurements. Hypertension was defined as self-reported physician diagnosis, self-reported use of antihypertensive medications, or measured systolic blood pressure (SBP) ≥ 140 mmHg or diastolic blood pressure (DBP) ≥
To reduce dimensionality and avoid overfitting, we employed a two-stage feature selection strategy combining LASSO regression with bootstrap stability analysis[32]. First, LASSO regression with L1 penalty was applied to the training set after standardizing all continuous variables to the [0,1] range. For categorical variables, ordered factors (e.g., educational level, health expectation) were converted to integer codes preserving their natural order, while unordered categorical variables (e.g., region, house type, cooking fuel, weight change pattern) were one-hot encoded prior to LASSO regression and ML modeling to avoid introducing artificial ordinal relationships. The optimal penalty parameter λ was determined by 10-fold cross-validation, selecting the value within one standard error of the minimum deviance (lambda.1se) to enhance parsimony. Variables with non-zero coefficients at this λ were considered initially selected. Second, to address potential instability in LASSO selection, we performed bootstrap stability analysis by generating 100 bootstrap samples from the training set and repeating the LASSO procedure (with 10-fold cross-validation and lambda.1se) on each sample. Predictors that appeared in at least 90% of the bootstrap iterations were retained as the final set of features for subsequent ML modeling, ensuring that the selected variables were both relevant to the outcome and stable across data perturbations.
Outcome definition
The primary outcome of this study was progression to incident CKM multimorbidity occurring between Wave 3 (2015) and Wave 4 (2018), defined as a binary indicator (yes/no) reflecting the coexistence of at least two of the three disease groups - cardiovascular, kidney, and metabolic diseases - within the same individual, as ascertained from the CHARLS standardized health questionnaires[5]. CVD was defined based on two questions at Wave 4: “Have you been diagnosed with heart attack, coronary heart disease, angina, congestive heart failure, or other heart problems by a doctor?” and “Have you been diagnosed with stroke by a doctor?”. Kidney disease was defined based on the question: “Have you been diagnosed with kidney disease (except for tumor or cancer) by a doctor?”. Metabolic disease was defined as self-reported physician diagnosis of hypertension, diabetes or high blood sugar, or dyslipidemia, supplemented by physical measurements, laboratory biomarkers, and medication use to enhance diagnostic accuracy. Based on the combinations of these conditions, CKM multimorbidity was further classified into four subtypes (cardiovascular-kidney, cardiovascular-metabolic, kidney-metabolic, and complete CKM multimorbidity) for descriptive purposes; however, the primary outcome for all analyses was the binary presence versus absence of CKM multimorbidity [Supplementary Table 1]. As participants with CKM multimorbidity at baseline were excluded, and those with zero or one CKM disease group at baseline were included, the outcome represents progression from zero or one CKM condition to overt multimorbidity rather than first onset of any CKM condition. This predictor-outcome overlap is intentional: the model predicts progression from ≤ 1 to ≥ 2 CKM components, and predictors and outcomes were assessed at distinct time points (2015 vs. 2018).
Handling of missing data and outliers
To address missing data and outliers in the CHARLS cohort, we first screened continuous variables for extreme outliers using the interquartile range (IQR) rule: values below Q1 - 3 × IQR or above Q3 + 3 × IQR were considered outliers and recoded as missing to prevent undue influence on subsequent analyses. Missing data are unavoidable in large-scale longitudinal studies, arising from attrition, item non-response, or loss to follow-up; simply excluding individuals with any missing information would reduce statistical power and potentially introduce selection bias, compromising sample representativeness. For all remaining missing values (including those originally missing and those set to missing due to outlier status), we applied multiple imputation using chained equations (MICE) implemented in the R package mice[33]. To account for imputation uncertainty, we generated five imputed datasets; all subsequent analyses were performed separately on each dataset, and results were pooled according to Rubin’s rules to obtain valid inference reflecting both within- and between-imputation variability. For continuous variables, we applied predictive mean matching; for binary variables, LR; and for unordered categorical variables, polytomous regression. To account for imputation uncertainty, five imputed datasets were generated, and all subsequent analyses were performed separately on each imputed dataset, with results pooled according to Rubin’s rules to obtain valid inference reflecting both within- and between-imputation variability. Comparisons of variable distributions before and after imputation are presented in Supplementary Figures 2 and 3. All preprocessing (imputation, scaling, feature selection) was restricted to the training set to prevent information leakage, with the outcome variable included in the imputation models. For each of the five imputed datasets, we applied the same stratified 70:30 split using a fixed random seed, ensuring reproducible and consistent partitioning. Feature selection (LASSO with bootstrap stability) was performed independently on each training set; the same nine predictors were retained across all five datasets, confirming robustness. Model tuning, training, and testing were then conducted within each split. Performance metrics [e.g., area under the curve (AUC), Brier score] were calculated on each testing set and pooled by averaging the point estimates; standard errors (95%CIs) were derived by combining within- and between-imputation variance per Rubin’s rules. Assuming missingness at random, this approach minimizes bias.
Model construction
To systematically evaluate the predictive performance of different ML paradigms for incident CKM multimorbidity in Chinese adults with overweight and obesity, we constructed and compared seven algorithms representing diverse methodological approaches. These included LR, a conventional generalized linear model that estimates the probability of binary outcomes; Decision Tree (DT), which partitions data based on feature values to generate interpretable classification rules[34]; random forest (RF), an ensemble method that aggregates multiple DT trained on bootstrap samples to reduce overfitting[35]; extreme gradient boosting (XGBoost), a scalable tree boosting system known for its efficiency and predictive accuracy[36]; light gradient boosting machine (LightGBM), a gradient boosting framework that uses leaf-wise tree growth to handle large-scale data with lower memory consumption[37]; support vector machine (SVM), which constructs optimal hyperplanes in a transformed feature space to maximize class separation[38]; and Artificial Neural Network (ANN), a multi-layer perceptron capable of capturing complex non-linear relationships through interconnected neurons[39]. The dataset was randomly split into training and testing subsets at a 70:30 ratio, with stratification employed to maintain the original prevalence of CKM multimorbidity events in both partitions. All procedures related to model development - including feature scaling, hyperparameter optimization, and internal cross-validation within the training set - were restricted exclusively to the training set, whereas the testing set was held out and not used until the final performance evaluation [Supplementary Figure 4]. We determined the optimal hyperparameters for each algorithm using GridSearchCV paired with 5-fold cross-validation. In this framework, we partitioned the training data into five non-overlapping folds. For each iteration, we used four folds as the training subset and the held-out fold as the validation subset, cycling through all five folds. Hyperparameters were then selected by maximizing the average cross-validated AUC. The final hyperparameter configurations are summarized in Supplementary Table 2.
Statistical analysis
All statistical analyses were conducted using R (version 4.4.2; R Foundation for Statistical Computing, Vienna, Austria) and Python (version 3.10.4; Python Software Foundation). The model development workflow was implemented across both environments based on the specific capabilities of each ecosystem. Specifically, feature selection using LASSO regression with bootstrap stability analysis was performed in R via the glmnet package (version 4.1-8). The development and hyperparameter tuning of ML models - including RF, XGBoost, LightGBM, SVM, and ANN - were carried out using the scikit-learn library (version 1.2.2) in Python, with GridSearchCV and 5-fold cross-validation employed for optimization. The LR model was developed in R using the rms package (version 6.7.0). For model interpretation, SHAP analysis was executed using the fastshap package (version 0.1.1) in R, with visualizations generated via shapviz (version 0.9.0). Additional R packages utilized for preprocessing, validation, and plotting included mice (version 3.14.0) for multiple imputation, pROC (version 1.18.0) for DeLong’s tests, and ggplot2 (version 3.4.2) for general plotting. Decision curve analysis was performed using the rmda package (version 1.6). All random processes were seeded with set.seed(1234) in both R and Python [via numpy.random.seed(1234)] to guarantee complete reproducibility. Baseline characteristics were summarized separately for participants who developed incident CKM multimorbidity during follow-up and those who did not. We reported continuous data as either mean ± standard deviation or median with IQR, based on the results of the Shapiro-Wilk test for normality. Categorical variables were summarized as frequencies and percentages. For between-group comparisons, we applied independent t-tests or Mann-Whitney U tests for continuous variables (depending on distributional assumptions) and chi-square tests for categorical variables. A two-sided P value < 0.05 was regarded as statistically significant in all conventional analyses.
We comprehensively evaluated the predictive performance of all seven ML models using a variety of metrics. Discrimination ability was assessed by the AUC value, which measures the model’s capacity to distinguish between individuals who developed CKM multimorbidity and those who did not. All performance metrics were derived from predictions on the independent testing set to ensure unbiased evaluation. Model calibration was comprehensively assessed using calibration plots, which graphically compare predicted probabilities against observed outcomes across deciles of risk, along with the Hosmer-Lemeshow goodness-of-fit test and the Brier score to quantify the accuracy of probability predictions. We additionally performed decision curve analysis to assess the clinical usefulness of the models by estimating the net benefit across various probability thresholds. To enhance the clinical applicability of the LR model, a nomogram was developed as a proof-of-concept tool for research purposes, and its use in clinical practice requires external validation. To enhance clinical interpretability beyond conventional metrics, we employed Shapley Additive Explanations to elucidate the optimal model. SHAP, grounded in cooperative game theory, quantifies the marginal contribution of each feature by comparing model predictions with and without that predictor across all possible coalitions[40]. For the best ML model, we generated multiple SHAP visualizations: a bar plot ranking feature importance based on mean absolute SHAP values, a beeswarm summary plot illustrating the distribution and directionality of SHAP values for key features, scatter dependence plots examining the marginal effects of continuous predictors, and waterfall and force plots demonstrating individual-level explanations for representative cases.
RESULTS
Participant characteristics
A total of 4,244 middle-aged and older adults with overweight or obesity were included, of whom 648 (15.3%) developed incident CKM multimorbidity during follow-up [Supplementary Table 3]. Compared to their non-CKM counterparts, individuals with CKM multimorbidity were significantly older, more likely to reside in central China, and had lower educational attainment. They also exhibited shorter sleep duration, lower physical activity levels, and a substantially higher prevalence of depressive symptoms. All chronic conditions assessed - including hypertension, diabetes, dyslipidemia, heart disease, stroke, kidney disease, and arthritis - were significantly more prevalent in the CKM group. Anthropometric measurements revealed higher BMI, WC, and blood pressure among CKM patients. Laboratory profiles showed elevated cystatin C, TG, and HbA1c, along with lower HDL. Additionally, use of non-clean cooking fuel was more common in the CKM group. These findings indicate that individuals with incident CKM multimorbidity present with a distinct profile characterized by adverse socioeconomic indicators, poorer cardiometabolic risk factors, and higher inflammatory burden.
Predictor selection
Based on the two-stage feature selection strategy combining LASSO regression with bootstrap stability analysis, we identified a parsimonious set of predictors for subsequent ML modeling. In the first stage, LASSO regression with 10-fold cross-validation selected the optimal penalty parameter corresponding to the minimum deviance within one standard error (lambda.1se), yielding an initial set of 16 variables with non-zero coefficients. To enhance selection stability, we then performed bootstrap analysis with 100 resamples and retained predictors that appeared in at least 90% of the bootstrap iterations. The final selected predictors included age, depression, pain, health expectation, weight change, and four chronic conditions: dyslipidemia, hypertension, heart disease, and kidney disease [Figure 1]. Multicollinearity among the 9 selected predictors was assessed using the variance inflation factor (VIF), and all VIF values were below 5, indicating no significant multicollinearity concerns [Supplementary Table 4].
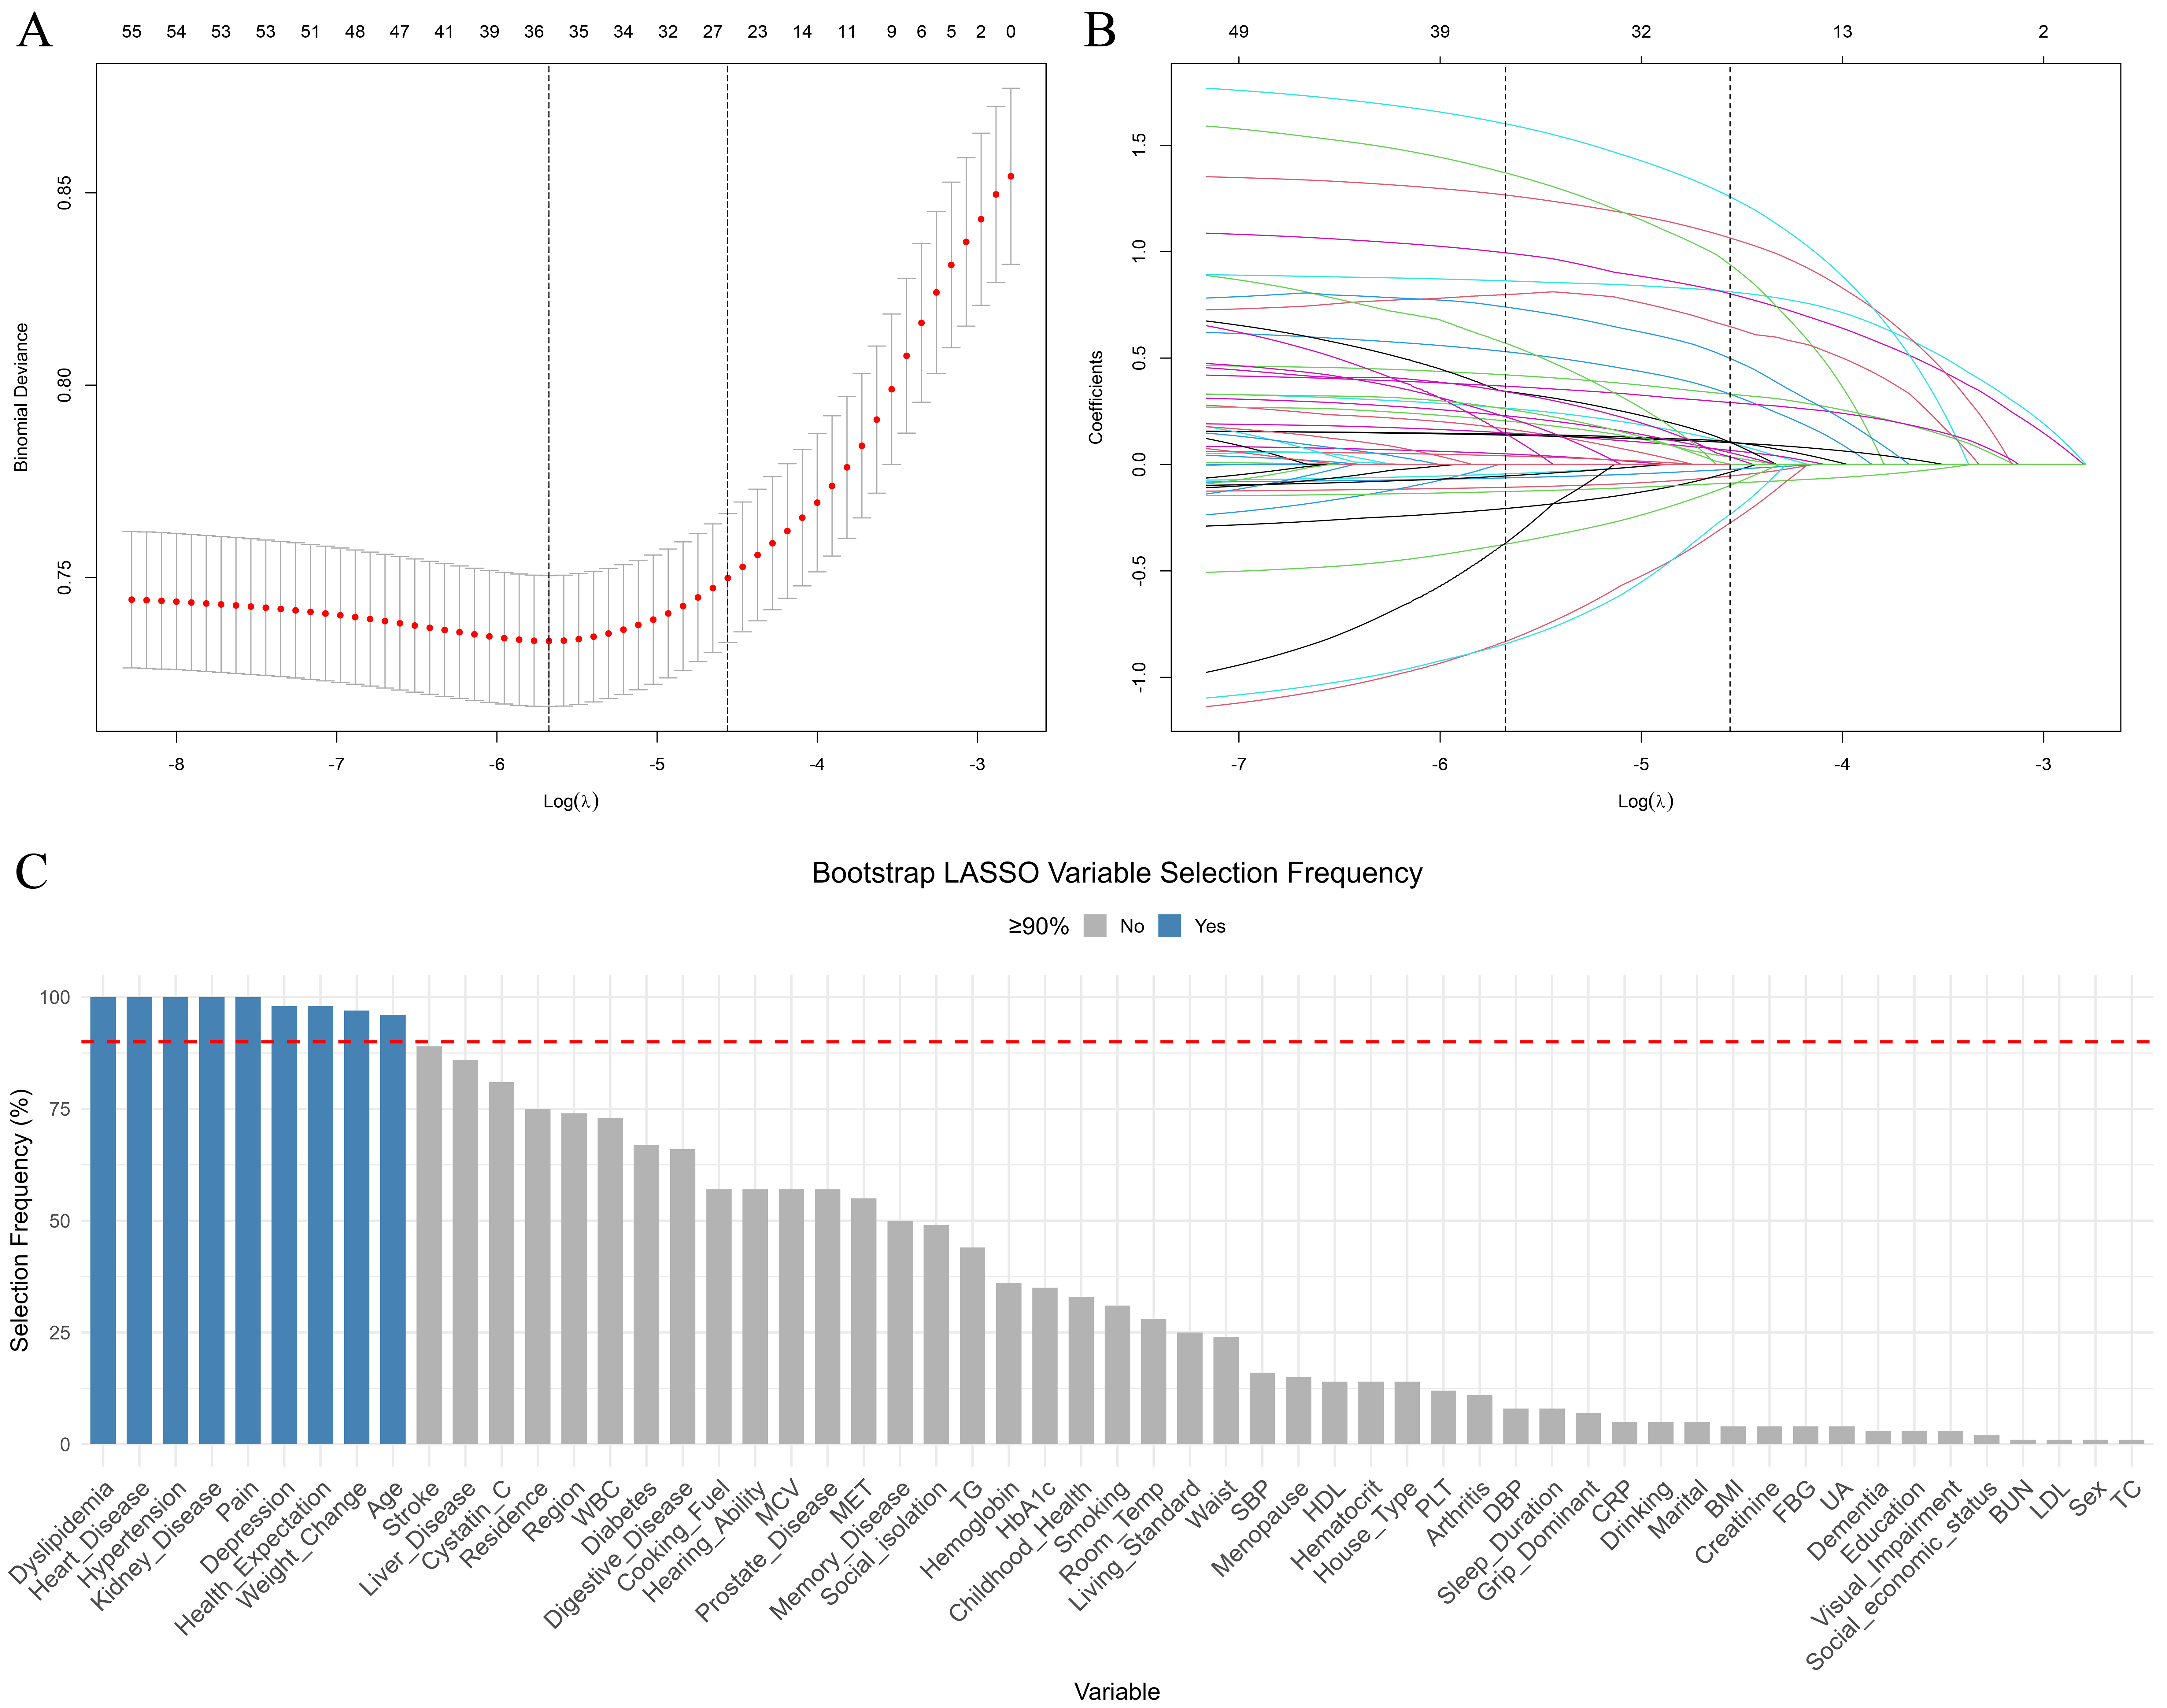
Figure 1. Feature selection using LASSO regression and bootstrap stability analysis. (A) LASSO coefficient paths for the candidate predictors; (B) Cross-validation error curve for selecting the optimal penalty parameter λ; the dotted lines indicate λ_min and λ_1se; (C) Selection frequency of each predictor across 100 bootstrap LASSO iterations; the red dashed line denotes the 90% threshold for final retention. LASSO: Least absolute shrinkage and selection operator; λ_min: minimum penalty parameter; λ_1se: largest penalty parameter within one standard error of the minimum cross-validation error; WBC: white blood cell count; MCV: mean corpuscular volume; MET: metabolic equivalent of task; TG: triglycerides; HbA1c: glycated hemoglobin (hemoglobin A1c); SBP: systolic blood pressure; HDL: high-density lipoprotein; PLT: platelet count; DBP: diastolic blood pressure; CRP: C-reactive protein; BMI: body mass index; FBG: fasting blood glucose; UA: uric acid; BUN: blood urea nitrogen; LDL: low-density lipoprotein; TC: total cholesterol.
Model performance
Among the seven ML models, ANN and LR demonstrated the most favorable discriminative ability in the testing set, with AUC values of 0.758 (95%CI: 0.720-0.791) and 0.757 (95%CI: 0.718-0.790), respectively [Figure 2 and Supplementary Figure 5]. In terms of calibration, ANN achieved the lowest Brier score of 0.113 (95%CI: 0.102-0.125), closely followed by LR with a Brier score of 0.114 (95%CI: 0.101-0.126), indicating acceptable calibration in the internal test set. Decision Curve Analysis (DCA) further revealed that both models provided the highest net clinical benefit across a range of threshold probabilities in the testing set. At the Youden-derived threshold, ANN and LR performed comparably (sensitivity 0.74 vs. 0.72, specificity 0.68 vs. 0.69, NPV 0.94 vs. 0.93; Supplementary Table 5). The modest positive predictive value (PPV) (~0.30) is expected given the low outcome prevalence (15.3%) and does not undermine clinical utility, as supported by DCA.

Figure 2. Performance evaluation of seven ML models. (A) ROC curves of seven ML models in the testing set; (B) ROC curves of seven ML models in the training set; (C) Calibration curves of the seven models in the testing set, with the Brier score indicated for each model; (D) DCA of the seven models in the testing set, demonstrating the net clinical benefit across different threshold probabilities. ML: Machine learning; ROC: receiver operating characteristic; AUC: area under the curve; CI: confidence interval; DCA: decision curve analysis; SVM: support vector machine; ANN: artificial neural network; LightGBM: Light Gradient Boosting Machine; XGBoost: Extreme Gradient Boosting.
LR model performance and nomogram
To provide a preliminary research tool for individualized risk prediction, a nomogram was constructed based on the LR model [Figure 3]. It is important to note that this nomogram requires external validation in independent cohorts before it can be recommended for routine clinical use. The nomogram integrates the selected predictors - including age, depression, pain, health expectation, weight change, dyslipidemia, hypertension, heart disease, and kidney disease - allowing for straightforward estimation of CKM multimorbidity probability by summing the points assigned to each risk factor. The calibration plot demonstrated acceptable calibration in the internal test set, with the Hosmer-Lemeshow test yielding a non-significant result, indicating no evidence of poor calibration in this internal evaluation. The nomogram is interpreted by summing the points for each predictor, then reading the corresponding predicted probability from the total points axis; its discrimination and calibration performance are reported above and are based on the testing set.
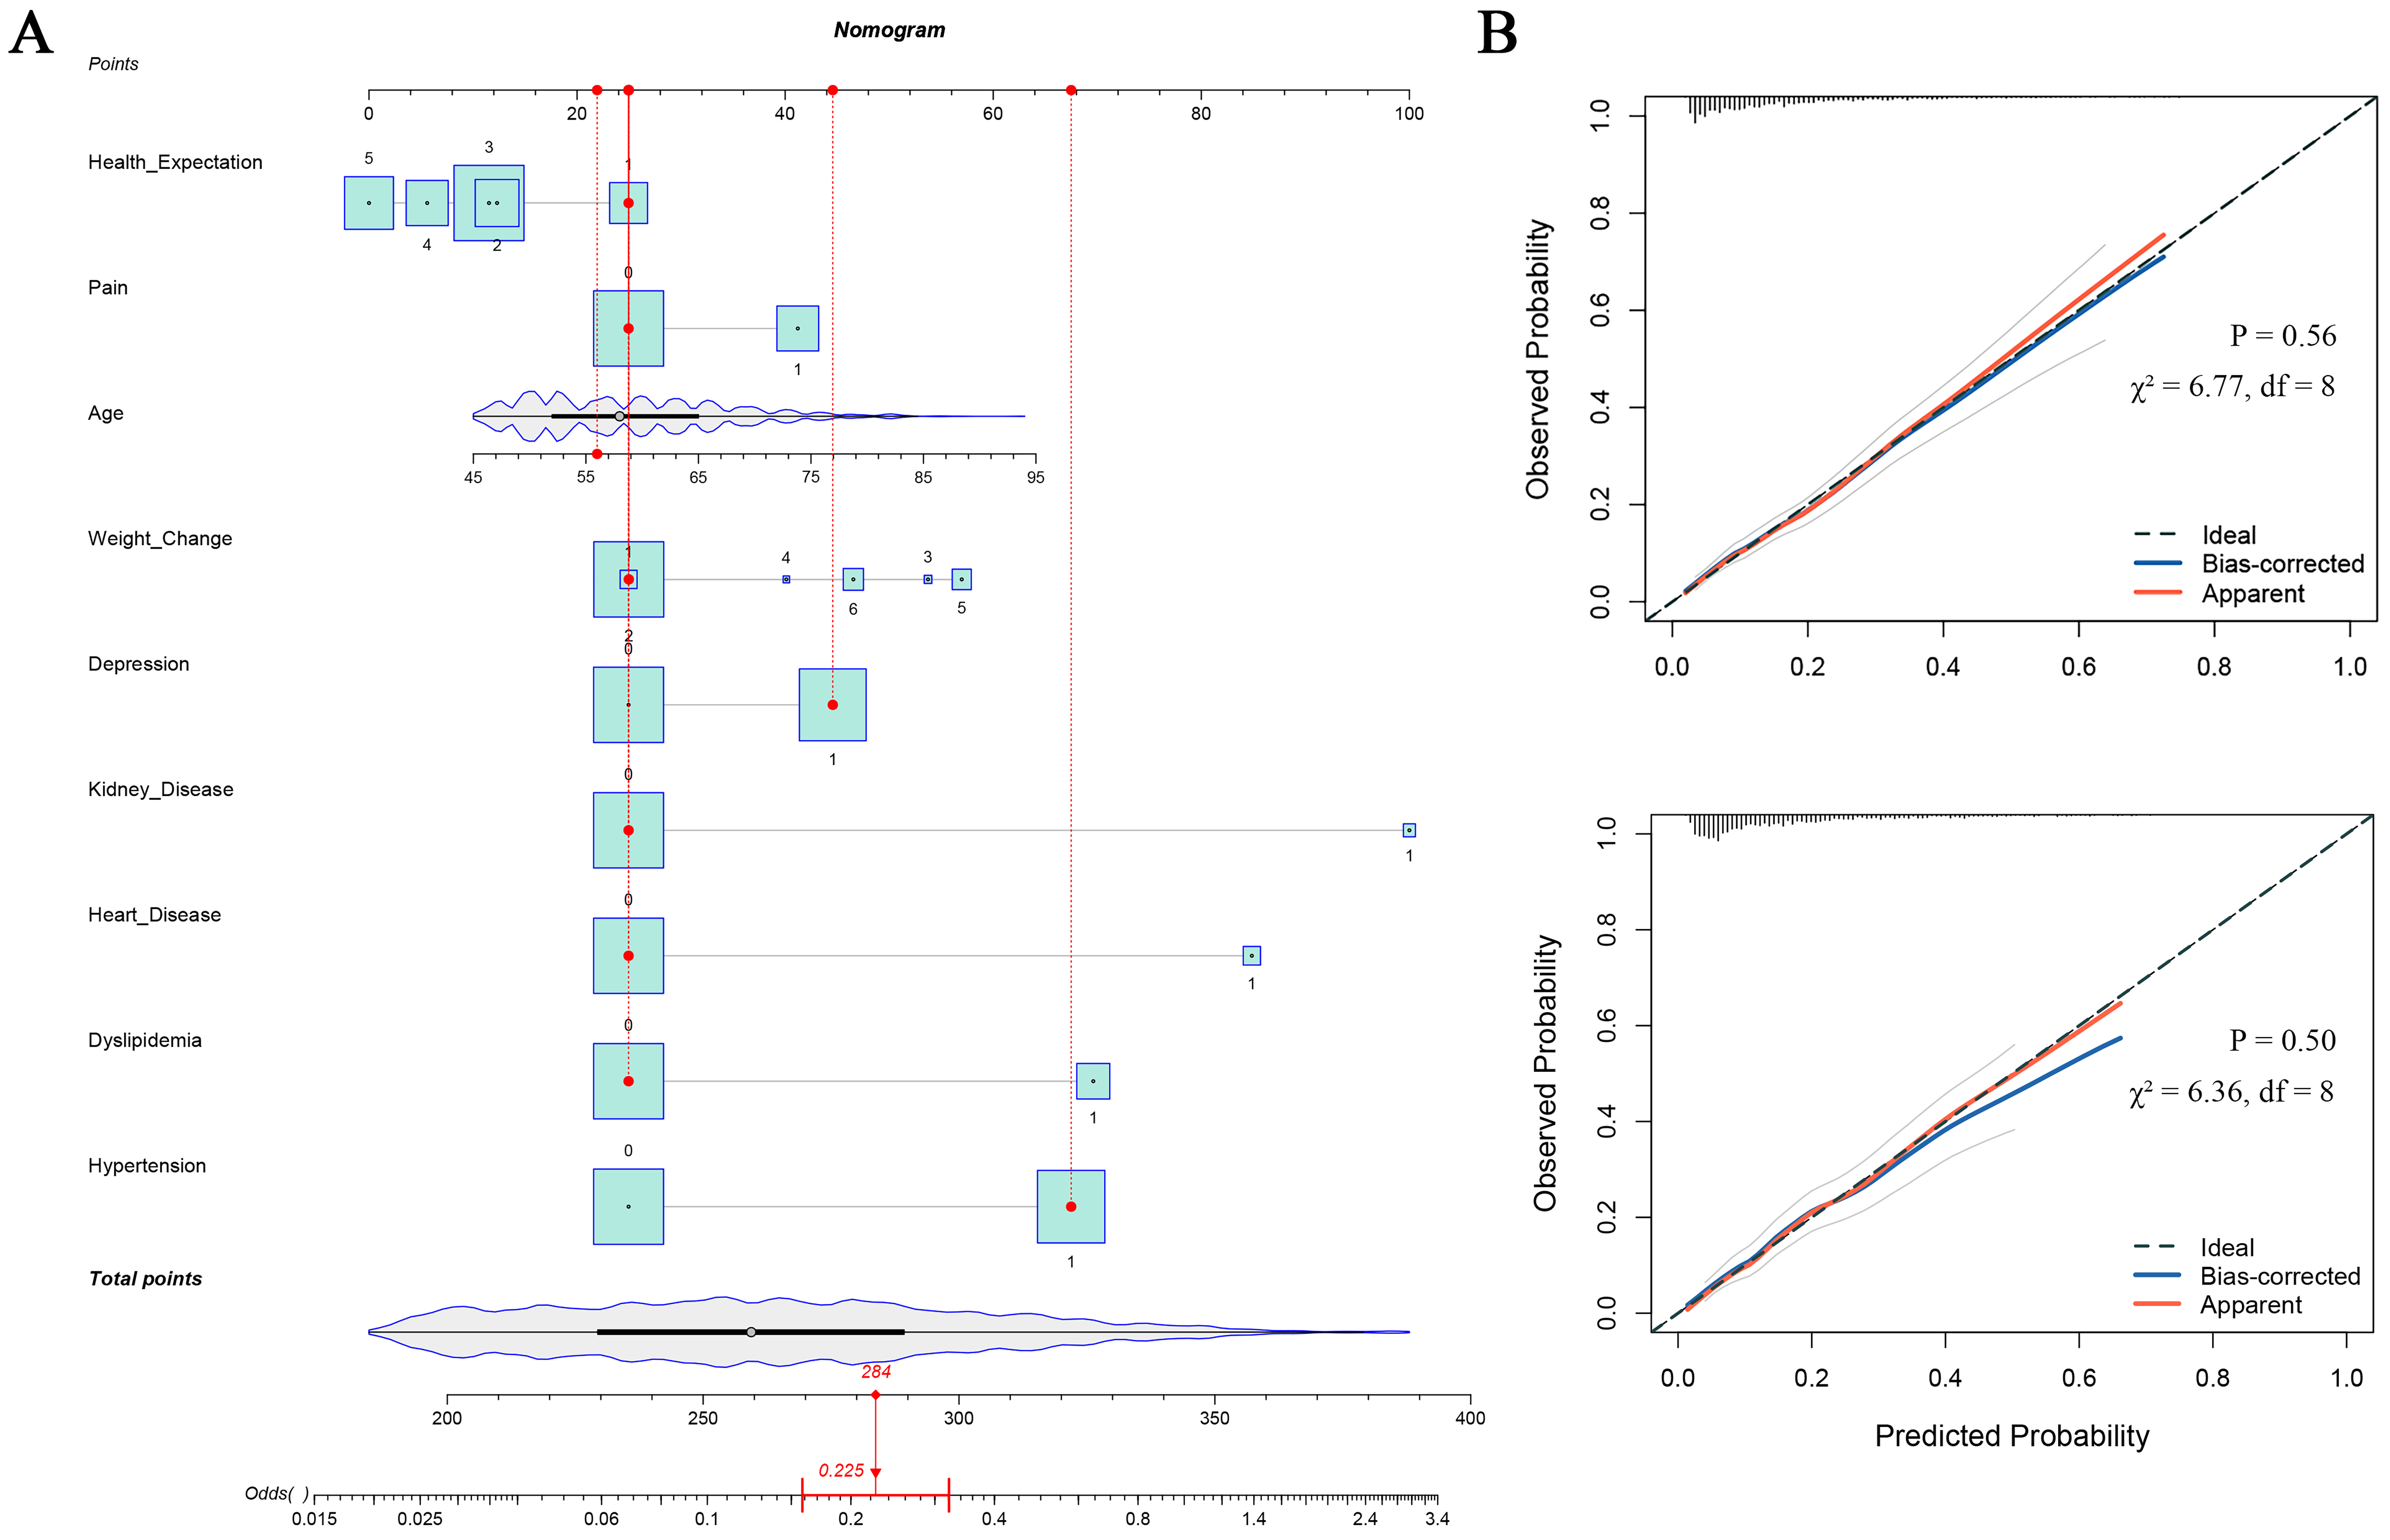
Figure 3. Logistic regression nomogram and calibration. (A) Nomogram for predicting CKM multimorbidity risk in Chinese adults with overweight and obesity incorporating 9 selected predictors; (B) Calibration curve of the logistic regression model in the training and testing sets. The Hosmer-Lemeshow test indicated good calibration. For the categorical variables, the following codings were used: depression (0 = no, 1 = yes), pain (0 = no, 1 = yes), dyslipidemia (0 = no, 1 = yes), hypertension (0 = no, 1 = yes), heart disease (0 = no, 1 = yes), kidney disease (0 = no, 1 = yes), health expectation (1 = almost impossible, 2 = not very likely, 3 = maybe, 4 = very likely, 5 = almost certain), and weight change (1 = Don’t know, 2 = No, 3 = Yes, first gained and then lost weight, 4 = Yes, first lost and then gained weight, 5 = Yes, only gained weight, 6 = Yes, only lost weight). CKM: Cardiovascular-kidney-metabolic; df: degrees of freedom.
SHAP interpretation of the ANN model
To elucidate the decision-making process of the ANN model and identify the key drivers of CKM multimorbidity risk, SHAP analysis was performed [Figure 4]. The SHAP bar plot ranks feature importance based on mean absolute SHAP values, revealing that hypertension, dyslipidemia, depression, kidney disease, and pain are the top five contributors to CKM multimorbidity risk. The beeswarm summary plot provides a comprehensive overview of SHAP value distributions for all nine key features. For categorical variables, the presence of hypertension, dyslipidemia, heart disease, kidney disease, depression, and pain consistently increased predicted CKM multimorbidity risk, while poorer health expectation (lower scores) and specific patterns of weight change (particularly weight gain or loss) were also strongly associated with higher risk. For the continuous variable age, a monotonic positive relationship with CKM multimorbidity risk was observed, indicating that older individuals faced substantially higher predicted risk. Scatter dependence plots further illustrate the marginal effect of age, confirming its linear positive association with SHAP values. SHAP analysis at the individual level revealed contrasting risk profiles: low-risk individuals were characterized by the absence of key risk factors, including hypertension, dyslipidemia, depression, and stable weight with younger age, while high-risk individuals exhibited the opposite combination.

Figure 4. SHAP interpretation of the ANN model. (A) SHAP bar plot showing feature importance ranked by mean absolute SHAP values; (B) SHAP beeswarm summary plot illustrating the distribution of SHAP values for each feature. Red indicates high feature values, blue indicates low feature values, and the horizontal position represents the impact on model output; (C) SHAP scatter dependence plots for key variables, demonstrating the marginal effects of nine predictors on predicted CKM multimorbidity risk; (D) Waterfall plot for predicting non-CKM multimorbidity patient (class 0), showing how individual feature contributions drove the low-risk prediction; (E) Force plot for predicting CKM multimorbidity patient (class 1), visualizing the feature contributions that pushed the prediction toward high risk. SHAP: SHapley Additive exPlanations; ANN: artificial neural network; CKM: cardiovascular-kidney-metabolic.
DISCUSSION
Comparison with existing research results
Our parsimonious nine-predictor model demonstrated moderate performance in internal testing (AUC 0.758), aligning with recent large-scale studies while revealing important distinctions. Wang et al., using CHARLS data, reported that metabolic multimorbidity was associated with increased risks of CVD and kidney disease; our findings extend this work by showing that metabolic conditions, when combined with prior CVD and kidney disease, form a predictive signature for incident CKM multimorbidity rather than merely serving as risk factors for individual outcomes[41]. Notably, diabetes - despite its established role - was not retained in our final model. This may reflect high collinearity with other metabolic predictors in our overweight/obese population, or that hypertension and dyslipidemia already capture substantial metabolic risk information. Formal correlation analysis [Supplementary Table 6] confirmed moderate correlations between diabetes and hypertension (r = 0.42) and dyslipidemia (r = 0.38). Clinically, this does not diminish diabetes’ importance; rather, in this population with hypertension and dyslipidemia, diabetes adds limited incremental predictive value for 3-year CKM multimorbidity. Our model should therefore be used as a screening tool to identify high-risk individuals who may benefit from further metabolic evaluation, including diabetes testing. This observation aligns with Song et al., who found that the C-reactive protein-triglyceride-glucose index outperformed individual components in predicting CKM mortality[42].
Beyond traditional cardiometabolic risk factors, our analysis uncovered a prominent role for psychological factors - particularly depression and pain - ranking among the top five predictors. This resonates with the emerging understanding that CKM syndrome involves neuroendocrine and behavioral pathways. The inflammatory hypothesis linking depression to cardiometabolic disease is consistent with a potential mechanism: chronic low-grade inflammation, reflected by elevated CRP and pro-inflammatory cytokines, may reflect a shared pathway underlying both depressive symptoms and metabolic dysregulation[42]. Pain may serve as a marker of musculoskeletal or neuropathic complications secondary to metabolic disease, while also contributing to physical inactivity and social isolation. Collectively, these findings suggest that comprehensive CKM risk assessment should extend beyond traditional biomedical markers to encompass psychosocial well-being[43]. However, our observational design cannot distinguish whether depression and pain are independent drivers, proxies for systemic inflammation, or downstream consequences of early subclinical organ damage; future studies with repeated measures and longitudinal mediation analyses are needed to disentangle these pathways.
In contrast to previous studies emphasizing lifestyle factors, physical activity and sleep duration were not retained in our final prediction model, despite significant univariate differences. This may be because our study population was restricted to individuals with overweight or obesity, among whom the protective effects of physical activity might be attenuated by the predominant metabolic risk conferred by excess adiposity[44]. Additionally, physical activity may exert effects through mediating pathways (e.g., blood pressure control, inflammation reduction) that are captured directly by disease indicators (hypertension, dyslipidemia) in our model[45]. Third, our three-year follow-up window may be insufficient to capture cumulative protective effects of physical activity.
Another novel aspect pertains to weight dynamics. Our model retained weight change patterns - rather than baseline BMI alone - as a significant predictor, with both weight gain and loss associated with increased risk compared to stable weight. This finding aligns with the life-course perspective emphasizing weight trajectory over static adiposity[46]. The finding that both gain and loss predicted CKM multimorbidity may reflect heterogeneity: intentional weight loss through lifestyle modification likely confers benefit, whereas unintentional loss due to underlying illness signals increased risk. Our dataset did not distinguish between these, representing an important direction for future research.
Finally, while socioeconomic and environmental factors did not emerge in our final parsimonious model, their indirect influence warrants discussion. Their effects may be mediated through retained clinical predictors (hypertension, dyslipidemia, depression) that represent the biological embedding of social adversity. Thus, although not appearing in the final model, these distal determinants remain fundamental to understanding CKM disparities and designing equitable interventions. We recognize that hypertension, dyslipidemia, heart disease, and kidney disease are both predictors and components of the outcome. This overlap reflects our design: predicting progression from ≤ 1 to ≥ 2 CKM conditions - so the model targets those with existing single-system disease, not first-onset in healthy persons.
Strengths and limitations
This study has several notable advantages. To the best of our knowledge, it is the first investigation to construct ML models specifically designed for predicting CKM multimorbidity in a high-risk cohort consisting of Chinese adults with overweight or obesity. Second, our rigorous two-stage feature selection combining LASSO with bootstrap stability analysis enhances reliability and generalizability. Third, comprehensive evaluation across seven algorithms with assessment of discrimination, calibration, clinical utility, and interpretability provides a holistic understanding. Fourth, SHAP analysis enables clinically meaningful interpretation of the neural network model. Fifth, a nomogram based on LR provides a proof-of-concept tool for individualized risk prediction (pending external validation).
Several limitations warrant consideration. First, the relatively short three-year follow-up window may underestimate cumulative CKM multimorbidity incidence and limit detection of longer-latency predictors. We used Wave 3 (2015) as baseline because key biomarkers (HbA1c, lipid fractions) and consistent depression/pain measures were unavailable in Wave 1 (2011-2012); using Wave 1 would have introduced substantial missing data and biased estimates. Future studies with longer follow-up are needed to confirm our findings. Second, CKM multimorbidity ascertainment relied partly on self-reported physician diagnoses, which may introduce misclassification bias, although we supplemented with physical measurements, laboratory biomarkers, and medication use to enhance accuracy. Specifically, cardiovascular and kidney disease definitions were based on self-reported diagnoses, which may introduce recall or reporting bias. Formal sensitivity analyses using alternative diagnostic thresholds were not performed due to the absence of a gold-standard external validation cohort. Medication use during follow-up was not included as a predictor because it represents an intermediate consequence of baseline diseases rather than an independent upstream risk factor; however, differential treatment effects could influence outcomes, and future studies should examine this using time-varying approaches. Additionally, anxiety was not assessed due to CHARLS data limitations; its omission may modestly underestimate psychological risk. Third, despite comprehensive feature selection, unmeasured confounders such as dietary patterns, genetic factors, and medication adherence may influence CKM multimorbidity risk. We also acknowledge that the weight change variable conflates intentional and unintentional weight fluctuations, which may have opposed prognostic value; future studies should stratify by weight loss intentionality. Fourth, our study population was restricted to middle-aged and older Chinese adults with overweight or obesity who had zero or one CKM disease group at baseline, limiting generalizability to other populations and to prediction of first-onset CKM disease. The model is intended to predict progression from zero or one CKM condition to overt multimorbidity, not first onset of any individual CKM disease. CHARLS uses a multistage probability sampling design; our analysis did not incorporate sampling weights or design effects, as the focus was individual-level prediction. Ignoring these features may affect variance estimation and generalizability, which external validation should address. Fifth, while we employed multiple imputation for missing data, some bias may persist if data were not missing at random. Without external validation in a geographically or demographically distinct population, any claims of generalizability remain speculative, and immediate clinical translation is not warranted. Sixth, the modest improvement of ML algorithms over LR suggests that in this specific context, traditional regression may suffice for clinical application, though the SHAP insights from complex models remain valuable for understanding risk factor contributions. This near-equivalence highlights an important implementation consideration: complex models require greater computational resources and specialized expertise, whereas LR is simpler, more transparent, and readily deployed. In the absence of substantial performance gains, the choice should prioritize interpretability and ease of deployment, reserving complex ML for contexts where non-linearity is pronounced or interaction effects are strong. Seventh, and most critically, our model was internally evaluated using a train-test split rather than externally validated in an independent cohort. Therefore, our findings should be considered preliminary, and claims of generalizability remain speculative until external validation is performed.
Implications for practice and research
This model is intended to predict progression from zero or one CKM condition to overt multimorbidity; it is not designed for screening completely disease-free individuals. Thus, the inclusion of baseline CKM components as predictors is appropriate for this progression-focused application. Although the model includes several established clinical predictors, its novelty lies in the inclusion of psychosocial factors and weight change dynamics, as well as the systematic comparison of ML algorithms against simple regression to quantify any non-linear advantage. For clinical practice, the identified predictor set - particularly the prominence of modifiable factors including depression, pain, and weight change alongside traditional cardiometabolic conditions - suggests that comprehensive CKM risk assessment should extend beyond conventional biomedical markers to include psychological well-being and weight trajectory. The nomogram provides an intuitive proofofconcept tool for research purposes; it is not ready for routine clinical use and requires external validation in independent cohorts. With that caveat, it may eventually help identify high-risk individuals who could benefit from intensive lifestyle interventions or closer monitoring. The comparable performance of LR to complex ML algorithms suggests that implementation in resource-constrained settings need not require sophisticated computational infrastructure. For research, our findings highlight several priority areas. First, the prominent role of psychological factors warrants investigation into whether interventions targeting depression and pain management can reduce CKM multimorbidity incidence. Second, the importance of weight change patterns over static adiposity measures suggests that longitudinal weight trajectories merit greater attention in risk prediction research. Third, future studies should examine whether predictors differ between overweight/obese and normal-weight individuals, potentially revealing distinct pathophysiological pathways. While socioeconomic and environmental factors were not retained in our final parsimonious model, their indirect influence warrants discussion; their effects may be mediated through retained clinical predictors (hypertension, dyslipidemia, depression) that represent the biological embedding of social adversity. Formal mediation analysis is needed to quantify how these distal determinants translate into proximal clinical risk markers, which would further strengthen the public health relevance of our findings. Although our study developed a static nomogram, future clinical implementation would require regular monitoring for calibration drift and predefined protocols for periodic model retraining. Practical risk thresholds and corresponding clinical actions were not pre-specified; DCA confirms net benefit over a range of probabilities, but implementation studies are needed to define optimal intervention thresholds for specific healthcare settings. Finally, external validation in independent cohorts and longer follow-up periods are essential before widespread clinical implementation to confirm generalizability and assess whether early risk signatures predict later disease trajectories.
DECLARATIONS
Acknowledgments
This analysis uses data or information from the Harmonized CHARLS dataset and Codebook, Version D as of June 2021, developed by the Harmonized CHARLS project, which was funded by the National Institute on Aging (R01AG030153, RC2AG036619, R03AG043052). For more information, please refer to https://g2aging.org/. We also thank the China Center for Economic Research, National School of Development, Peking University, for providing the data.
Authors’ contributions
Conceptualization: Li X, Li Z
Methodology: Li X, Li Z, Chen X
Software: Li Z, Gao L
Validation: Li X, Wei B
Formal analysis: Li Z, Zhang C
Investigation: Duan R
Resources: Duan R
Data curation: Ji Y
Writing - original draft preparation: Li X, Li Z
Writing - review and editing: Liu S, Ji Y, Yan Y
Visualization: Li X, Yan Y
Supervision: Liu S
Project administration: Liu S
Funding acquisition: Liu S
All authors have read and agreed to the published version of the manuscript.
Availability of data and materials
The dataset supporting the conclusions of this article is available in the CHARLS repository, https://charls.pku.edu.cn/. The Harmonized CHARLS dataset used for variable harmonization is available via the Gateway to Global Aging Data: https://g2aging.org/. The data supporting the findings of this study are available from the corresponding author upon reasonable request.
AI and AI-assisted tools statement
Not applicable.
Financial support and sponsorship
This work was supported by the Collaborative Traditional Chinese and Modern Medicine for Chronic Disease Management Research Project (No. CXZH2024079); Shanxi Provincial Clinical Medicine Research Center Construction Task Project (No. 20240410501001); Shanxi Province Science and Technology Achievements Transformation Guidance Special Fund (No. 202304021301066); Shanxi Province Research Funding for Returned Overseas Scholars (No. 2024-143); Shanxi Province Key Laboratory of Endocrine and Metabolic Diseases (No. 202404010920011); Shanxi Provincial Key Research and Development Program Project (No. 202402130501006).
Conflicts of interest
All authors declared that there are no conflicts of interest.
Ethical approval and consent to participate
This study used de-identified, publicly available data from the China Health and Retirement Longitudinal Study (CHARLS), for which ethical approval and informed consent had been obtained in the original survey. As this was a secondary analysis of publicly available anonymized data, no additional ethical approval was required.
Consent for publication
Not applicable.
Copyright
© The Author(s) 2026.
Supplementary Materials
REFERENCES
1. GBD 2023 Disease and Injury and Risk Factor Collaborators. Burden of 375 diseases and injuries, risk-attributable burden of 88 risk factors, and healthy life expectancy in 204 countries and territories, including 660 subnational locations, 1990-2023: a systematic analysis for the Global Burden of Disease Study 2023. Lancet. 2025;406:1873-922.
2. Gunnarsson S, Vito O, Unwin RJ. Cardiovascular-kidney-metabolic syndrome: prevalence, risks, disease trajectories, and early-stage management. Am J Physiol Cell Physiol. 2026;330:C1-8.
3. Bharaj IS, Brar A, Kacheria A, et al. Contemporary and emerging therapeutics in cardiovascular-kidney-metabolic (CKM) syndrome: in memory of Professor Akira Endo. Biomedicines. 2025;13:2192.
4. Ndumele CE, Neeland IJ, Tuttle KR, et al. ; American Heart Association. A synopsis of the evidence for the science and clinical management of cardiovascular-kidney-metabolic (CKM) syndrome: a scientific statement from The American Heart Association. Circulation. 2023;148:1636-64.
5. Shi P, Lou C, Fang J, Song Y. Adverse life events across the life course and the risk of new-onset cardiovascular-kidney-metabolic multimorbidity in middle-aged and older adults: longitudinal evidence from CHARLS. J Am Heart Assoc. 2025;14:e045192.
6. Shen C, Yang R, Zhou Y, et al. Metabolic dysfunction associated steatotic liver disease, cardiometabolic multimorbidity and mortality: evidence from the UK biobank. Clin Res Cardiol. 2026;115:1378-88.
7. Zhou Y, Dai X, Ni Y, et al. Interventions and management on multimorbidity: an overview of systematic reviews. Ageing Res Rev. 2023;87:101901.
8. Hall JE, do Carmo JM, da Silva AA, Wang Z, Hall ME. Obesity-induced hypertension: interaction of neurohumoral and renal mechanisms. Circ Res. 2015;116:991-1006.
9. Czaja-Stolc S, Potrykus M, Stankiewicz M, Kaska Ł, Małgorzewicz S. Pro-inflammatory profile of adipokines in obesity contributes to pathogenesis, nutritional disorders, and cardiovascular risk in chronic kidney disease. Nutrients. 2022;14:1457.
10. Sun X, Yan AF, Shi Z, et al. Health consequences of obesity and projected future obesity health burden in China. Obesity. 2022;30:1724-51.
11. Peng W, Chen S, Chen X, et al. Trends in major non-communicable diseases and related risk factors in China 2002-2019: an analysis of nationally representative survey data. Lancet Reg Health West Pac. 2024;43:100809.
12. Yan Z, Chang X, Liu Z, Liu R, Du X. The association of obesity and lipid-related indicators with all-cause and cardiovascular mortality risks in patients with diabetes or prediabetes: a cross-sectional study based on machine learning algorithms. Front Endocrinol. 2025;16:1492082.
13. Wang C, He S, Xie G, et al. Associations of longitudinal trajectories of triglyceride-glucose index combined with classical and novel obesity indices and cardiovascular disease: evidence from a nationwide prospective cohort study in China. Cardiovasc Diabetol. 2025;24:431.
14. Zhang H, Zhang Y, Gao W, Mu Y. Identification of risk factors and development of a predictive model for chronic kidney disease in patients with obesity: a four-year cohort study. Lipids Health Dis. 2024;23:57.
15. Jiang Y, Zhao B, Wang X, et al. UKB-MDRMF: a multi-disease risk and multimorbidity framework based on UK biobank data. Nat Commun. 2025;16:3767.
16. Huang Q, Zou X, Lian Z, et al. Predicting cardiovascular outcomes in Chinese patients with type 2 diabetes by combining risk factor trajectories and machine learning algorithm: a cohort study. Cardiovasc Diabetol. 2025;24:61.
17. Zhu J, Shi Z, Ge Z, et al. Comparative analysis of cardiometabolic multimorbidity predictors in China and the USA: a machine learning approach. Diabetes Res Clin Pract. 2025;229:112938.
18. Liu T, Krentz A, Lu L, Curcin V. Machine learning based prediction models for cardiovascular disease risk using electronic health records data: systematic review and meta-analysis. Eur Heart J Digit Health. 2025;6:7-22.
19. Xu D, Xu Z. Machine learning applications in preventive healthcare: a systematic literature review on predictive analytics of disease comorbidity from multiple perspectives. Artif Intell Med. 2024;156:102950.
20. Khalid F, Alsadoun L, Khilji F, et al. Predicting the progression of chronic kidney disease: a systematic review of artificial intelligence and machine learning approaches. Cureus. 2024;16:e60145.
21. Zhao Y, Hu Y, Smith JP, Strauss J, Yang G. Cohort profile: the China Health and Retirement Longitudinal Study (CHARLS). Int J Epidemiol. 2014;43:61-8.
22. Rubino F, Cummings DE, Eckel RH, et al. Definition and diagnostic criteria of clinical obesity. Lancet Diabetes Endocrinol. 2025;13:221-62.
23. Gao M, Lv J, Yu C, et al. ; China Kadoorie Biobank (CKB) Collaborative Group. Metabolically healthy obesity, transition to unhealthy metabolic status, and vascular disease in Chinese adults: a cohort study. PLoS Med. 2020;17:e1003351.
24. Zhou Y, Kivimäki M, Yan LL, et al. Associations between socioeconomic inequalities and progression to psychological and cognitive multimorbidities after onset of a physical condition: a multicohort study. EClinicalMedicine. 2024;74:102739.
25. Song Y, Zhu C, Shi B, et al. Social isolation, loneliness, and incident type 2 diabetes mellitus: results from two large prospective cohorts in Europe and East Asia and Mendelian randomization. EClinicalMedicine. 2023;64:102236.
26. Li X, Zhang W, Zhang W, et al. Level of physical activity among middle-aged and older Chinese people: evidence from the China health and retirement longitudinal study. BMC Public Health. 2020;20:1682.
27. Jiang C, Sun J, Lv Y, et al. The Chinese version of the 8-item Center for Epidemiologic Studies Depression Scale: Longitudinal psychometric syntheses with 10-year cohort multi-center evidence in an adult sample. Gen Hosp Psychiatry. 2024;91:204-11.
28. Zeng M, Chen Y, Lobanov-Rostovsky S, et al. Adiposity and dementia among Chinese adults: longitudinal study in the China Health and Retirement Longitudinal Study (CHARLS). Int J Obes. 2025;49:706-14.
29. Whelton PK, Carey RM, Aronow WS, et al. 2017 ACC/AHA/AAPA/ABC/ACPM/AGS/APhA/ASH/ASPC/NMA/PCNA Guideline for the prevention, detection, evaluation, and management of high blood pressure in adults: executive summary: a report of the American College of Cardiology/American Heart Association Task Force on Clinical Practice Guidelines. Hypertension. 2018;71:1269-324.
30. American Diabetes Association. 2. Classification and diagnosis of diabetes: Standards of Medical Care in Diabetes-2018. Diabetes Care. 2018;41:S13-27.
31. Joint committee issued Chinese guideline for the management of dyslipidemia in adults. [2016 Chinese guideline for the management of dyslipidemia in adults]. Zhonghua Xin Xue Guan Bing Za Zhi. 2016;44:833-53.
32. Pavlou M, Omar RZ, Ambler G. Penalized regression methods with modified cross-validation and bootstrap tuning produce better prediction models. Biom J. 2024;66:e202300245.
33. Witte J, Foraita R, Didelez V. Multiple imputation and test-wise deletion for causal discovery with incomplete cohort data. Stat Med. 2022;41:4716-43.
34. Silva GFS, Fagundes TP, Teixeira BC, Chiavegatto Filho ADP. Machine learning for hypertension prediction: a systematic review. Curr Hypertens Rep. 2022;24:523-33.
35. Hu J, Szymczak S. A review on longitudinal data analysis with random forest. Brief Bioinform. 2023;24:bbad002.
36. Fu C, Zhang Z, Li Y, et al. Association of the estimated glucose disposal rate combined with a body shape index with all-cause and cardiovascular-specific mortality among individuals with cardiovascular-kidney-metabolic syndrome. Cardiovasc Diabetol. 2026;25:112.
37. Zhang X, Yao W, Wang D, Hu W, Zhang G, Zhang Y. Development and validation of machine learning models for identifying prediabetes and diabetes in normoglycemia. Diabetes Metab Res Rev. 2024;40:e70003.
38. Jia W, Liu X, Wang Y, Pedrycz W, Zhou J. Semisupervised learning via axiomatic fuzzy set theory and SVM. IEEE Trans Cybern. 2022;52:4661-74.
40. Nohara Y, Matsumoto K, Soejima H, Nakashima N. Explanation of machine learning models using shapley additive explanation and application for real data in hospital. Comput Methods Programs Biomed. 2022;214:106584.
41. Wang W, Liu Y, Yuan D, et al. Association between metabolic multimorbidity and the risk of cardiovascular disease, kidney disease, and mortality: longitudinal evidence from CHARLS (2011-2020). Public Health. 2025;249:106020.
42. Song G. The C-reactive protein-triglyceride glucose index (CTI) predicts mortality in cardiovascular-kidney-metabolic syndrome: a dual-cohort study with machine learning validation. Int J Surg. 2026;112:1340-52.
43. He D, Zhang X, Li C, et al. Rising prevalence of cardiovascular-kidney-metabolic syndrome in China, 2010-2019: national cross-sectional surveys. J Am Coll Cardiol. 2025;86:213-6.
44. Zhao W, Yan Q, Mou C. Physical activity and cardiovascular-metabolic disease risk across cardiovascular-kidney-metabolic syndrome stages: a population-based cohort study. BMC Cardiovasc Disord. 2025;25:748.
45. Choi S, Oh M, Lee DH, Jee SH, Jeon JY. Invasive and non-invasive variables prediction models for cardiovascular disease-specific mortality between machine learning vs. traditional statistics. Sci Rep. 2025;15:35093.
Cite This Article
 Open Access
How to Cite
Download Citation
Export Citation File:
Type of Import
Tips on Downloading Citation
Citation Manager File Format
Type of Import
Direct Import: When the Direct Import option is selected (the default state), a dialogue box will give you the option to Save or Open the downloaded citation data. Choosing Open will either launch your citation manager or give you a choice of applications with which to use the metadata. The Save option saves the file locally for later use.
Indirect Import: When the Indirect Import option is selected, the metadata is displayed and may be copied and pasted as needed.
About This Article
Copyright

Data & Comments
Data
0










Comments
Comments must be written in English. Spam, offensive content, impersonation, and private information will not be permitted. If any comment is reported and identified as inappropriate content by OAE staff, the comment will be removed without notice. If you have any queries or need any help, please contact us at [email protected].