


The cumulative effect and sensitive period of overweight/obesity on high blood pressure in children based on the Tianjin Birth Cohort Study
 0
0 Abstract
Aim: Sensitive periods in child development are times when certain exposures may exert greater influences on health outcomes. The exposure to overweight/obesity and its cumulative effect during children’s sensitive periods may be associated with a higher risk of high blood pressure (HBP) in childhood.
Methods: A total of 522 boys and 534 girls (mean age: 9.6 years old, standard deviation: 0.6) from the birth cohort were selected for subsequent analysis. The curves of body mass index Z-score were generated by mixed-effect models. The statistically significant relative risk (RR) values of the first derivatives of the curves, evaluated at 0.5 year intervals, were used to identify the sensitive period. The area under the curve was employed to measure the cumulative exposure to overweight/obesity. Binary logistic regression model was used to investigate the association between the cumulative effect and risk of HBP in children.
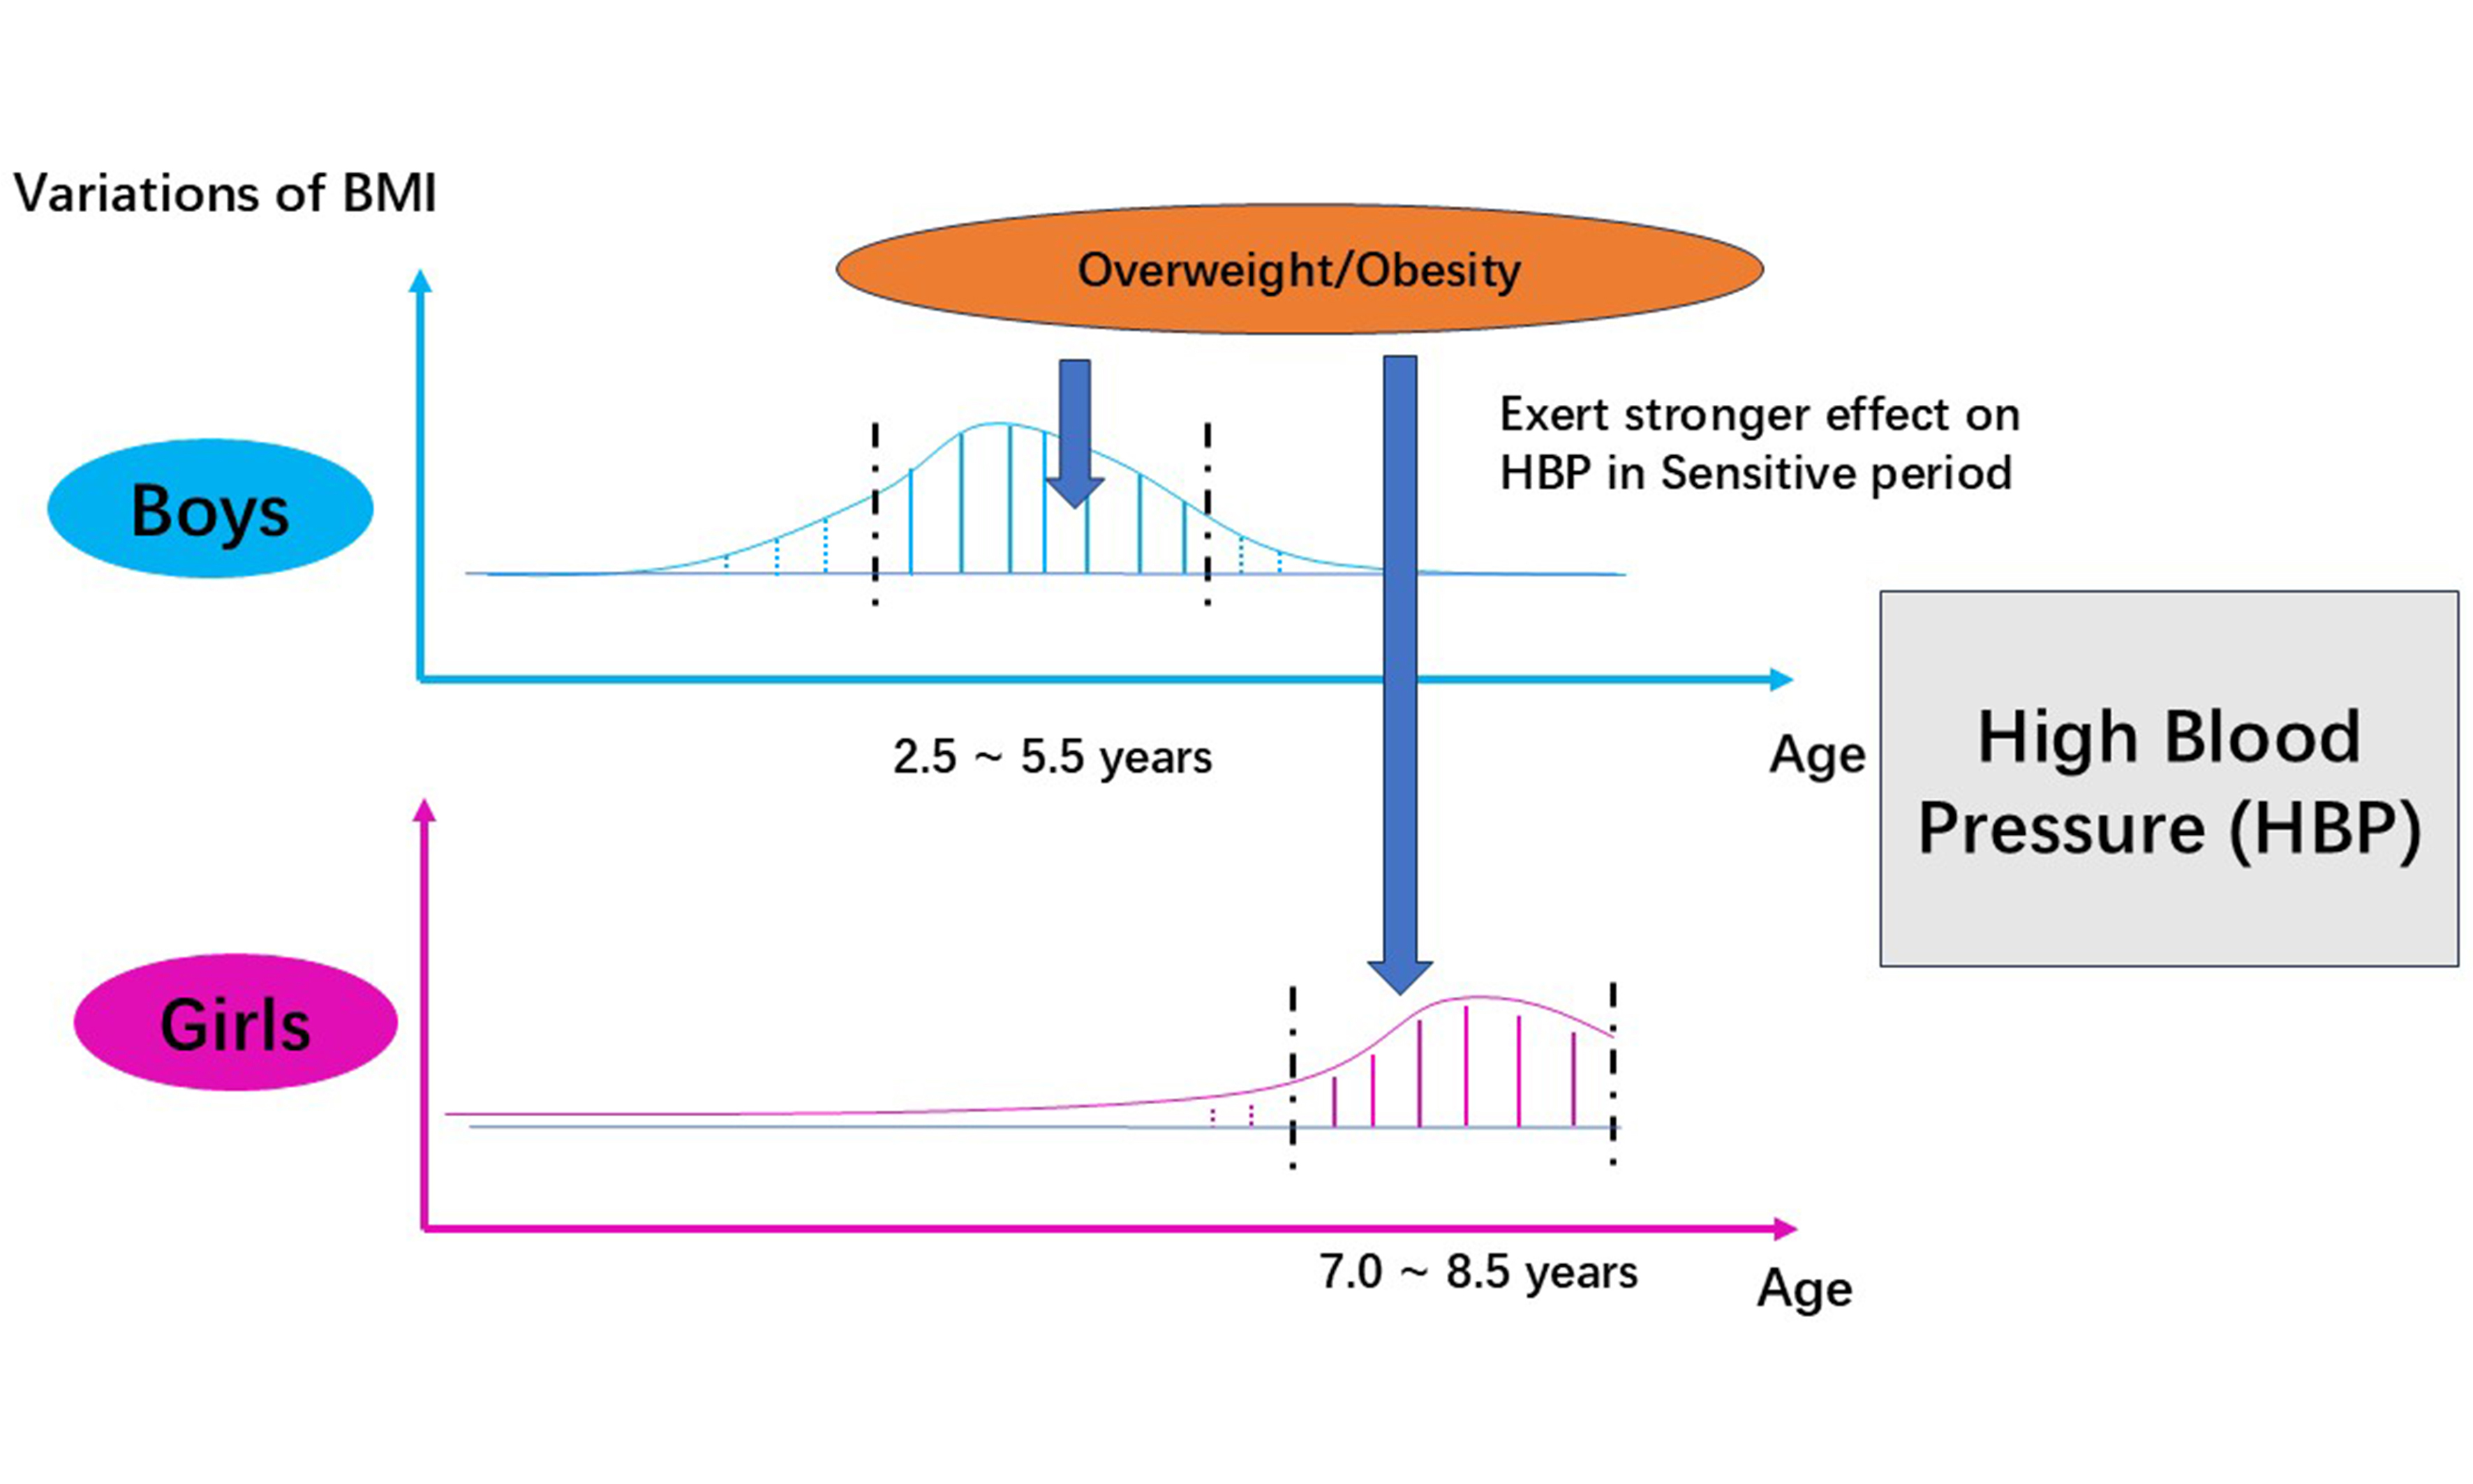
Results: The sensitive periods identified were 2.5-5.5 years in boys and 7.0-8.5 years in girls. During these sensitive periods, the cumulative effect [RR: 1.12, 95% confidence interval (CI): 1.07-1.17, P < 0.001] and the average cumulative effect (RR: 1.21, 95%CI: 1.16-1.28, P < 0.001) of overweight/obesity exerted a greater impact on the risk of HBP than during periods outside the sensitive periods (cumulative effect: RR: 1.01, 95%CI: 1.00-1.03, P = 0.036; average cumulative effect: RR: 1.02, 95%CI: 1.00-1.03, P = 0.049).
Conclusion: This study identified the sensitive periods during which overweight/obesity influences the risk of HBP in children aged 9-10 years and demonstrated the greater cumulative effect of overweight/obesity on the elevated risk of HBP.
Keywords
INTRODUCTION
The global prevalence of high blood pressure (HBP) in childhood has increased markedly over the past several decades globally[1]. This could lead to target organ injury, including cardiac and vascular injury, in early life[2,3]. In addition, HBP may persist from childhood or adolescence into adulthood[4]. However, some early precursor injuries caused by HBP in childhood are reversible. Therefore, early identification of HBP and effective interventions in childhood are critical for the primordial and primary prevention of cardiovascular diseases.
It has been proven that being overweight/obese is an important risk factor for HBP in children[5,6]. Haapala et al. found that constant and abdominal overweight/obesity were related to a more significant increase in blood pressure (BP) during the follow-up period[7]. It implied that the association between persistent overweight/obesity and HBP could be interpreted by a long-term accumulation of adiposity in early life. Recent studies have revealed that rapid body mass index (BMI) increase and persistently high BMI during childhood were associated with an elevated risk of HBP in children[7,8]. Based on the association between BMI trajectories and HBP, a hypothesis was proposed that exposure to overweight/obesity during a defined period exerts a stronger influence on HBP in childhood[9].
This hypothesis was supported by the “sensitive period” introduced by the developmental origins of health and disease (DOHaD) hypothesis, which suggests that some environmental agents or processes exerted a significant effect on future chronic disease risk if they occur during a “critical” or “sensitive” early developmental period. This refers to the fact that, during a specific developmental stage (such as pregnancy, fetal period, childhood, and adolescence), an organism may be more sensitive to exposure to external environmental factors, leading to long-term or irreversible health effects[10-12]. In this study, we speculate that there is a sensitive period for exposure to overweight/obesity. During this period, being overweight/obese or having a higher BMI would have stronger cumulative effects on HBP in children.
Currently, the sensitive period of the cumulative effect of overweight/obesity on HBP in childhood has not yet been revealed. In this study, using the Tianjin birth cohort, continuous and repeated measurements were employed to (1) investigate the cumulative effect of overweight/obesity on HBP; (2) identify the sensitive period of overweight/obesity on HBP; and (3) explore the cumulative effect during and outside the sensitive period on children’s HBP.
METHODS
Data sources
This study was conducted based on the Tianjin Birth Cohort Study. The study includes children from three schools in the District of Xiqing, Tianjin, China. Children in grades 3-4 were selected using the cluster sampling method. Information on the children was recorded from birth to the final survey in April 2023 (grades 3-4). The baseline survey was conducted in April 2021 (grades 1-2). Pre-school information was collected retrospectively from the Tianjin Women and Children’s Health Center. Physical examination indicators - such as height, weight, and BP - and diet/lifestyle behaviors - such as sugar-sweetened beverage (SSB) consumption, intake of fried food, and moderate-intensity physical activity - were collected. General information - such as breastfeeding history, reproductive history, and history of hypertension and other diseases - and clinical measurements - such as height, pre-pregnancy weight and BP, and pregnancy weight and BP - of mothers were also collected by linking their child healthcare records to their offspring’s healthcare system number.
Initially, a total of 1,297 subjects were included in the study. By the final survey, we had finished 14 measurements of height and weight, and BP was measured at the baseline and the final surveys. The children involved in this study had completed the final physical examinations and provided information on their birth height and weight. Participants with at least ten measurements of height and weight were included. Finally, 1,056 children with an average age of 9.6 [standard deviation (SD): 0.6] years old at the final survey were included in this study (522 boys and 534 girls).
Measurements and screens for HBP
Height and weight were measured at birth, 3, 6, and 9 months; 1, 1.5, 2, 2.5, 3, 3.5, 4, 5, and 6 years; at the baseline survey; and at the final survey. All measuring instruments were calibrated. Children were asked to remove heavy clothes and shoes before measuring weight and height. Weight was measured to the nearest 0.1 kg using a digital scale (TCS-60, Tianjin Weighing Apparatus Co., China). Height was measured using a recumbent length stadiometer (YSC-2, Beijing Guowangxingda, China) that was accurate to the nearest
Systolic blood pressure (SBP) and diastolic blood pressure (DBP) were measured using an OMRON electronic sphygmomanometer (HEM-7200, OMRON Corporation) on the right arm. Participants were asked to sit quietly for 5-10 min before the first measurement. BP was measured at least twice, with a 5 min interval between each measurement. The difference between the two measurements had to be less than 10 mmHg (either SBP or DBP); otherwise, another measurement was taken until the difference between the last two measurements was < 10 mmHg. Before the physical examination began, the measurements of height, weight and BP were carried out by medical students. Unified training was conducted by professional medical staff. During the physical examination period, professional medical workers would supervise the entire physical examination process. Once the physical examination was complete, all the data would be reviewed again by our team.
In this study, the Chinese National (CN) Standard (WS/T 610-2018), Reference of screening for elevated BP among children and adolescents aged 7-18 years, was used to screen for HBP in children[14]. To evaluate the stability of the sensitive period of HBP across different standards, the American Academy of Pediatrics 2017 Clinical Practice Guideline for Screening and Management of High Blood Pressure in Children and Adolescents[15] was also applied, which is commonly used for screening HBP in children. Subsequently, based on the BP measured in the final round, participants with SBP or DBP ≥ 95th age-, sex-, and height-specific percentile were identified as having HBP.
Covariates
Covariates related to the mothers were obtained through self-report at the first antenatal care visit - including birth date, ethnicity, education, pre-pregnancy body weight, abortion history, date of last menstrual period, and smoking and drinking habits - and from health records, including maternal age (calculated as the difference between the child’s and mother’s birth dates), maternal educational level, breastfeeding practice (exclusive breastfeeding, exclusive formula feeding, or mixed feeding), pregnancy outcomes (date of delivery, delivery mode, and labor complications), gestational duration (calculated as the difference between the child’s birth date and the mother’s last menstrual period), maternal BP during pregnancy (HBP or normal), and maternal history of hypertension.
Covariates related to the children were obtained from a questionnaire administered in the final round, including age, sex, singleton status (singleton or polyembryony), and diet and lifestyle behaviors (vegetable intake, SSB consumption, moderate-intensity physical activity)[16,17]. The Dietary Guidelines for Chinese School-aged Children (2022), released by the Chinese Nutrition Society, was used to classify diet and lifestyle behaviors as binary variables[18]. In this study, these were categorized as vegetable intake (everyday vs. < not everyday), SSB consumption (yes vs. no), and moderate-intensity physical activity frequency (≥ 3 times per week vs. < 3 times per week). As children may not have fully understood some questions, the questionnaires were completed by children with assistance from their parents.
Statistical analysis
Children’s height and weight followed a normal distribution and demonstrated homogeneity of variance at each time point. In addition, height and weight were linearly correlated with BP. Therefore, the mixed-effect model was employed to fit BMI Z-score curves for all participants based on the longitudinal repeated measurements of height and weight at each time point[19]. This model is applicable to the analysis of repeated measurement data. Based on these BMI Z-score curves, the first derivatives (linear slopes) on curves were calculated at 0.5-year intervals. Then, the associations between the linear slope at each time point and the incidence of HBP in the final survey were estimated by calculating the relative risk (RR) value[20,21]. If the lower limit of the 95% confidence interval (CI) of the RR value exceeded 1, we considered that the change in BMI Z-score at this time point was sensitive to HBP. The period during which the lower limit of the 95%CI for the RR value constantly exceeded 1 was defined as the sensitive period for BMI changes on HBP. The RR values were calculated after adjusting for region and age, children’s diet and exercise habits, mothers’ breastfeeding habits, maternal BP during pregnancy, maternal history of hypertension and other diseases, and singleton status.
The area under the curve (AUC) analysis was performed to measure the cumulative effects. According to the mixed-effect model, the BMI Z-score curve for each participant could be obtained, and the AUC from birth to the final survey could be calculated by integrating the curve equation[22]. Referring to the definition of overweight/obesity of the WHO growth reference for children[15], when the BMI Z-score curves exceeded 1, overweight/obesity would generate cumulative effect. The cumulative effect of overweight/obesity for each child was measured by subtracting the AUC of BMI Z-score curves from the area under the line of BMI Z-score = 1[23]. The cumulative time (in years) that the BMI Z-score curves exceeded the BMI Z-score = 1 was the duration (in years) of the entire observation period. The average cumulative effect was calculated by dividing the cumulative effect by the total duration. Similarly, the average cumulative effect during a specific period was calculated by dividing the cumulative effect in the sensitive period by its duration. The average cumulative effect outside the sensitive period was calculated by dividing the cumulative effect in other time periods by their corresponding durations. The mixed-effects modeling and calculation of AUC were performed using R (version 4.0.3). Binary logistic regression was used to analyze the effect of the first derivatives on BMI Z-score curves and the cumulative overweight/obesity on the risk of HBP at the final survey, using IBM SPSS Statistics (Statistical Package for the Social Sciences, version 21.0). In the regression model, the following covariates were adjusted for: nation, age, children’s diet and exercise habits, mothers’ breastfeeding, maternal BP during pregnancy, maternal history of hypertension and other diseases, and singleton status. Statistical significance was defined as a two-sided P value < 0.05.
RESULTS
In the final survey, the mean ± SD values for SBP and DBP were 109.5 ± 11.1 mmHg and 64.4 ± 7.1 mmHg, respectively. Boys had a significantly higher SBP (110.8 ± 11.9 mmHg) than girls (108.2 ± 11.1 mmHg) (P < 0.001). The total incidence of HBP was 14.3% (151 participants) and it was not significantly different between boys (14.2%) and girls (14.4%) based on the CN standard. Other indicators and covariates are presented in Table 1.
The characteristics of participants
| Mean (SE)/N (%) | t/χ2 | P | ||||
| Total (N = 1056) | Boys (N = 522) | Girls (N = 534) | ||||
| Information of children in the last survey | ||||||
| Age (year) | 9.6 (0.6) | 9.7 (0.6) | 9.6 (0.5) | 0.80 | 0.417 | |
| Height (cm) | 141.2 (7.6) | 141.7 (7.5) | 140.7 (7.7) | 1.43 | 0.153 | |
| Weight (kg) | 38.5 (11.0) | 40.6 (12.0) | 36.4 (9.5) | 5.90 | < 0.001 | |
| SBP (mmHg) | 109.5 (11.1) | 110.8 (10.9) | 108.2 (11.1) | 4.17 | < 0.001 | |
| DBP (mmHg) | 64.44 (7.13) | 64.37 (7.06) | 64.51 (7.20) | -0.22 | 0.791 | |
| Childhood HBP rate in the last round survey | ||||||
| CN standard | Normal BP | 905 (85.7) | 448 (85.8) | 457 (85.6) | 0.94 | 0.344 |
| HBP | 151 (14.3) | 74 (14.2) | 77 (14.4) | |||
| USA standard | Normal BP | 891 (80.6) | 422 (80.8) | 429 (80.2) | 0.77 | 0.342 |
| HBP | 205 (19.4) | 100 (19.2) | 105 (19.6) | |||
| Children’s diet and exercise habits | ||||||
| Vegetable intake | 7 days per week | 244 (27.9) | 110 (25.8) | 134 (29.8) | 1.70 | 0.196 |
| < 7 days per week | 632 (72.1) | 316 (74.2) | 316 (70.2) | |||
| Fried food intake | 0 times per week | 269 (30.4) | 132 (30.5) | 137 (30.2) | 0.01 | 0.947 |
| > 0 times per week | 617 (69.6) | 301 (69.5) | 316 (69.8) | |||
| Sweet sugary beverages | Yes | 501 (57.2) | 252 (59.2) | 249 (55.3) | 1.31 | 0.258 |
| No | 375 (42.8) | 174 (40.8) | 201 (44.7) | |||
| Moderate-intensity physical activity | ≥ 3 days per week | 574 (64.8) | 279 (64.4) | 295 (65.1) | 0.05 | 0.833 |
| < 3 days per week | 312 (35.2) | 154 (35.6) | 158 (34.9) | |||
| Information about mothers | ||||||
| Breastfeeding | Exclusively breastfeeding | 504 (58.3) | 243 (57.3) | 261 (59.3) | 1.90 | 0.391 |
| Exclusively formula feeding | 128 (14.8) | 70 (16.5) | 58 (13.2) | |||
| Mixed feeding | 232 (26.9) | 111 (26.2) | 121 (27.5) | |||
| Mother’s BP during pregnancy period | Normal BP | 681 (76.9) | 332 (76.7) | 349 (77.0) | 0.02 | 0.909 |
| HBP | 205 (23.1) | 101 (23.3) | 104 (23.0) | |||
| Mother’s history of hypertension | Yes | 25 (2.9) | 9 (2.1) | 16 (3.6) | 1.76 | 0.193 |
| No | 839 (97.1) | 415 (97.9) | 424 (96.4) | |||
| Mother’s history of other diseases | Yes | 6 (0.7) | 5 (1.2) | 1 (0.2) | 2.87 | 0.094 |
| No | 880 (99.3) | 428 (98.8) | 452 (99.8) | |||
| Mothers’ education level | No bachelor degree | 650 (62.9) | 331 (64.6) | 319 (61.2) | 1.30 | 0.255 |
| Bachelor’s degree or higher | 383 (37.1) | 181 (35.4) | 202 (38.8) | |||
| Monthly household income | < 8,000 CNY | 347 (41.8) | 174 (42.8) | 173 (40.8) | 0.33 | 0.569 |
| ≥ 8,000 CNY | 484 (58.2) | 233 (57.2) | 251 (59.2) | |||
The cumulative effects of being overweight/obese on HBP in the final survey were calculated over the entire observation period [Table 2]. For all participants, RR values were obtained after adjusting for sex, nation, age, vegetable intake, SSB consumption, moderate-intensity physical activity, mothers’ breastfeeding, maternal BP during pregnancy, maternal history of hypertension and other diseases, and singleton status. In boys and girls, all covariates were also adjusted for except sex. Based on the CN standard, the duration and cumulative effects of overweight/obesity were associated with an increased risk of HBP in boys, but not in girls. The average cumulative effect elevated the risk of children’s HBP (RR: 1.09, 95%CI: 1.07-1.10, P = 0.01), in both boys (RR: 1.11, 95%CI: 1.04-1.17, P = 0.03) and girls (RR: 1.06, 95%CI: 1.01-1.10, P = 0.03). Similar results were observed based on the USA standard.
The association of duration time, cumulative effect, and average cumulative effect with risk of HBP in the last survey
| Standard | Variable | All participants | Boys | Girls | ||||||
| RRa | 95%CI | P | RRb | 95%CI | P | RRc | 95%CI | P | ||
| CN standard | Duration time (Year) | 1.01 | 1.01, 1.02 | 0.046 | 1.01 | 1.01, 1.03 | 0.038 | 1.01 | 0.99, 1.02 | 0.078 |
| Cumulative effect | 1.03 | 1.02, 1.03 | 0.027 | 1.04 | 1.02, 1.04 | 0.043 | 1.02 | 1.00, 1.03 | 0.067 | |
| Average cumulative effect | 1.09 | 1.07, 1.10 | 0.018 | 1.11 | 1.04, 1.17 | 0.031 | 1.06 | 1.01, 1.10 | 0.034 | |
| USA standard | Duration time (Year) | 1.02 | 1.01, 1.02 | 0.035 | 1.02 | 1.01, 1.03 | 0.026 | 1.01 | 0.98, 1.02 | 0.543 |
| Cumulative effect | 1.04 | 1.02, 1.05 | 0.033 | 1.03 | 1.02, 1.04 | 0.047 | 1.02 | 1.01, 1.03 | 0.046 | |
| Average cumulative effect | 1.11 | 1.08, 1.14 | 0.022 | 1.09 | 1.07, 1.11 | 0.028 | 1.07 | 1.02, 1.10 | 0.039 | |
Then, the sensitive periods were identified based on the CN and USA standards, respectively, by calculating the RR values on the BMI Z-score curves at 0.5-year intervals [Figure 1]. In all participants, the sensitive period was identified as 2.5-5.5 years old using the CN standard, with the lower limit of the 95%CI of the RR value constantly exceeding 1 during this period. HBP was associated with changes in BMI Z-score more strongly at 4 years old (with a maximum RR value at this time point, RR: 2.00, 95%CI: 1.41-2.84, P < 0.001). In boys, the sensitive period was also identified as 2.5-5.5 years old and the maximum RR value emerged at 4 years old (RR: 4.07, 95%CI: 2.32-7.15, P < 0.001). In girls, it was identified as 7.0-8.5 years old, and the maximum RR value was observed at 7 years old (RR: 2.05, 95%CI: 1.17-3.60, P = 0.01). Identification of the sensitive period using the USA standard produced similar results. The sensitive period in all participants was 3.0-6.0 years old, with the maximum of RR value also appearing at 4 years old (RR: 2.64, 95%CI: 1.87-3.72, P < 0.001). The sensitive period was also 3.0-6.0 years old in boys and the maximum RR value still appeared at 4 years old (RR: 3.74, 95%CI: 2.31-6.06, P < 0.001). For girls, the sensitive period was later than for boys (7.5-9.0 years old). The maximum RR value appeared at 7.5 years old (RR: 3.38, 95%CI: 1.63-7.00, P = 0.001).
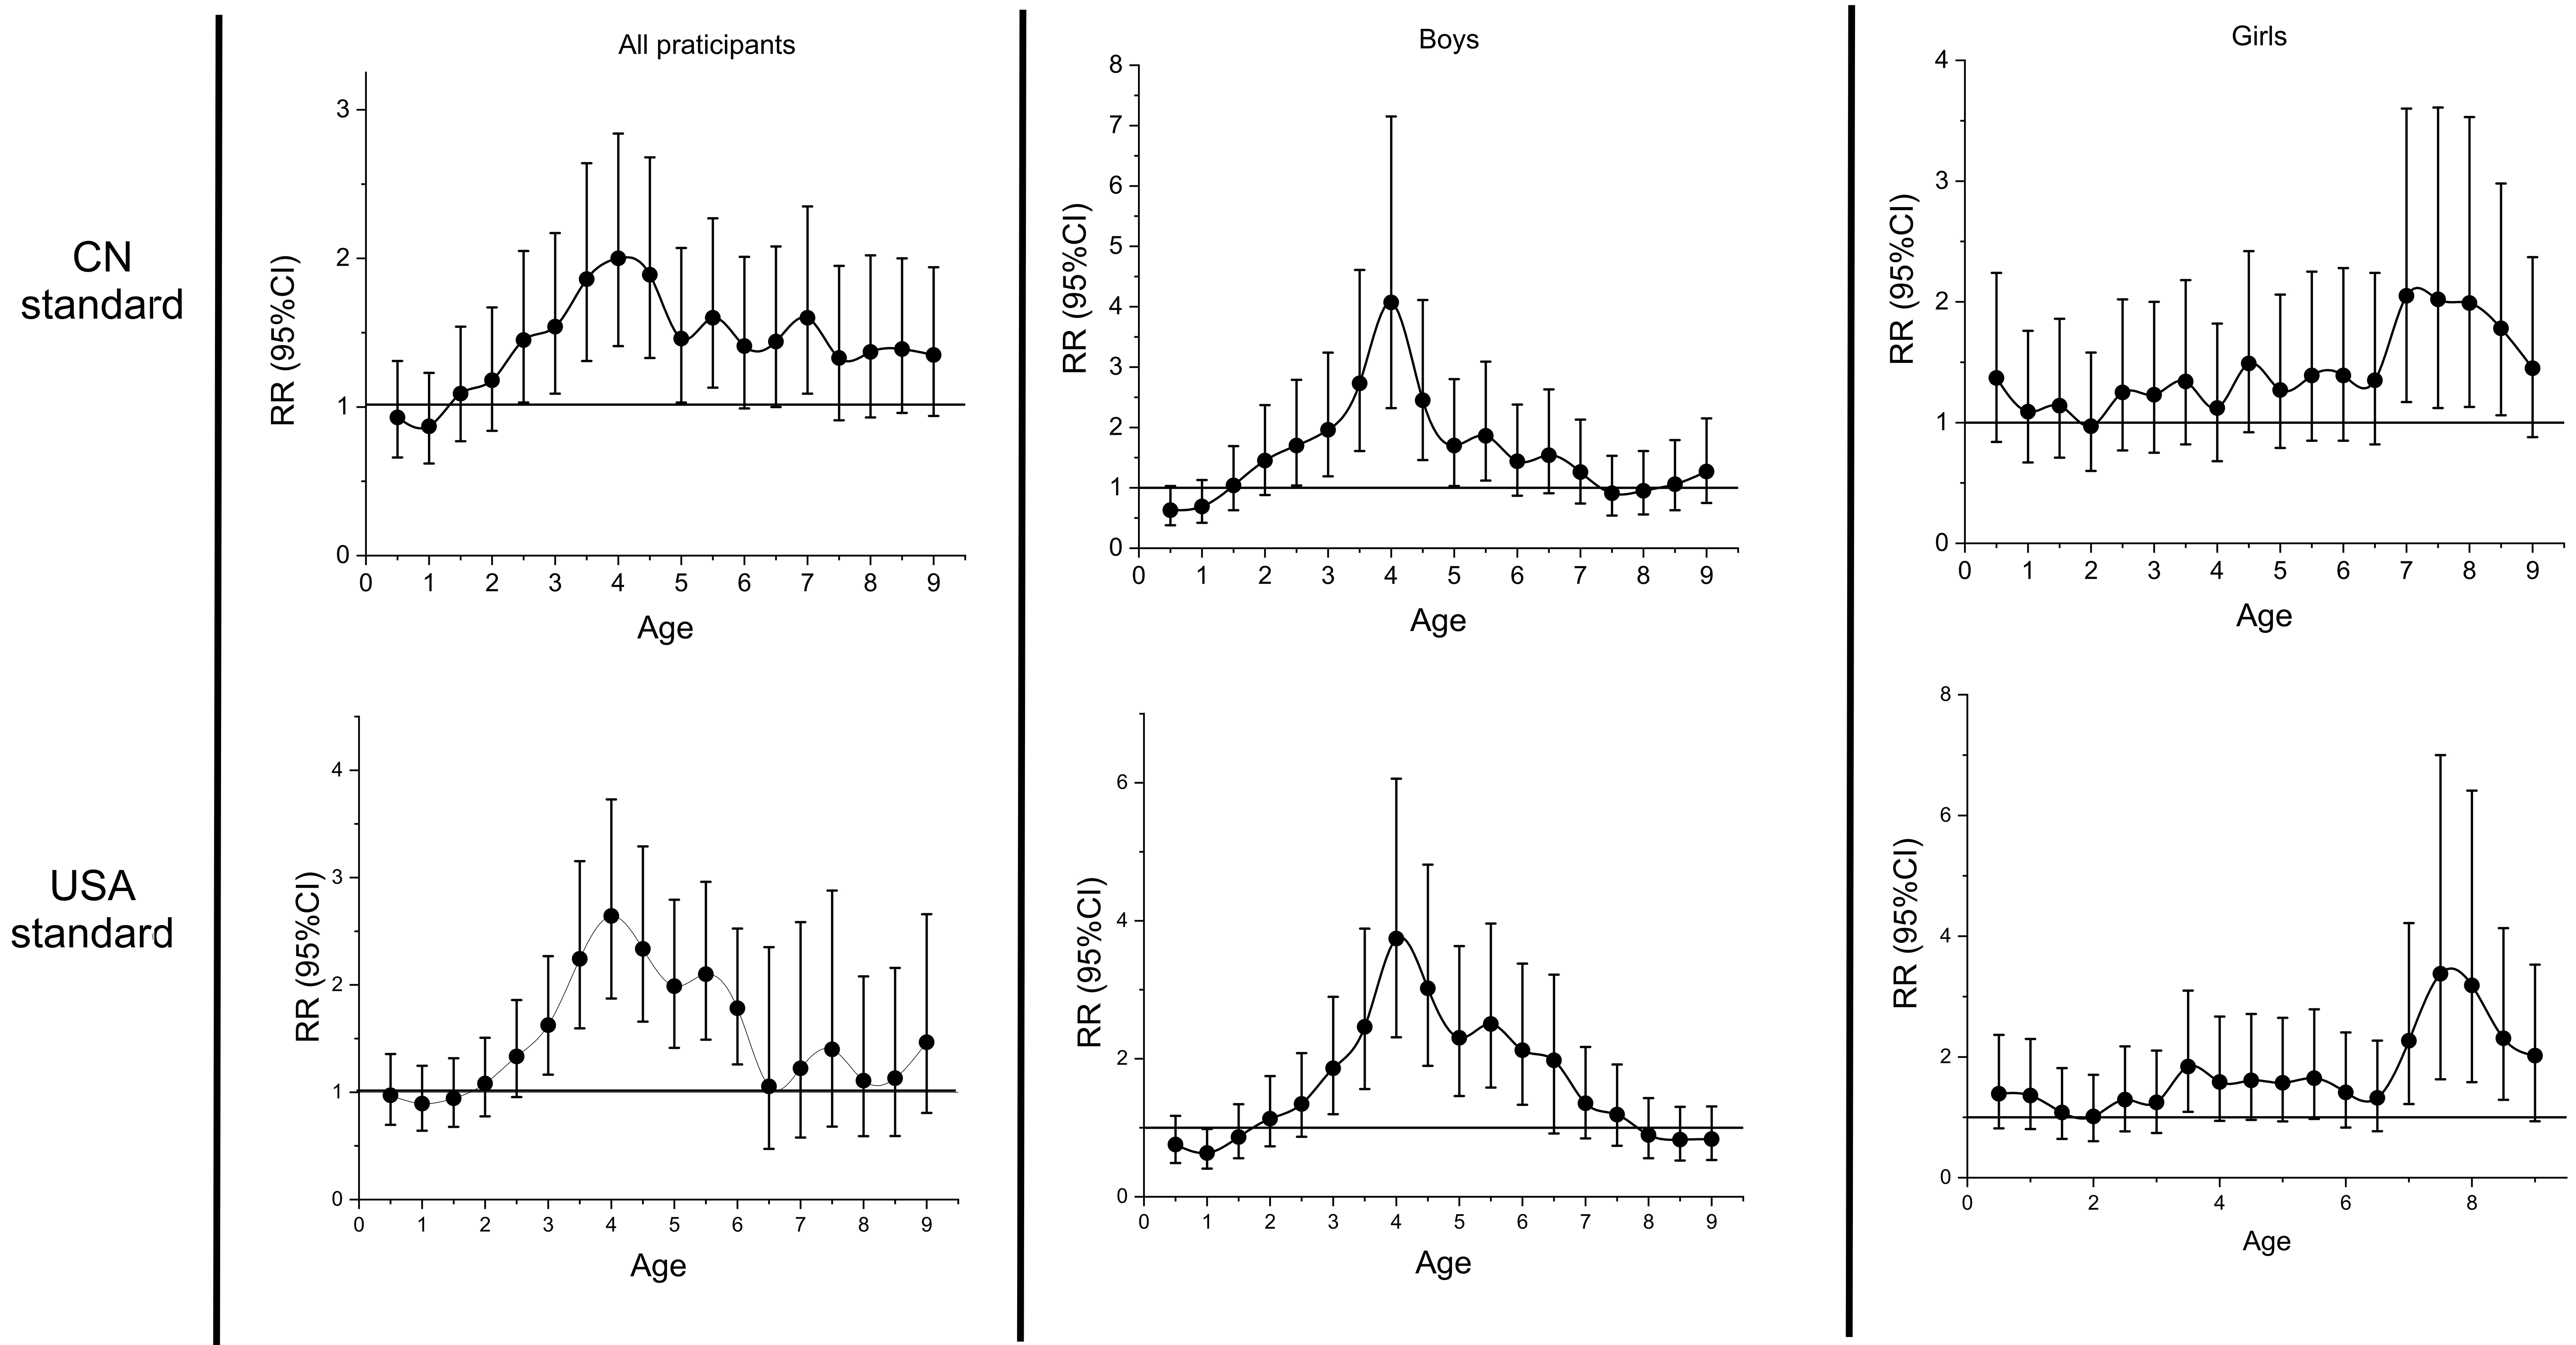
Figure 1. Identification of the Sensitive Period of Overweight/Obesity on Childhood High Blood Pressure. The associations between the linear slope at each time point and the incidence of HBP in the final survey were estimated by calculating the RR value. If the lower limit of the 95%CI of the RR value exceeded 1, we considered that the change in BMI Z-score at this time point was sensitive to HBP. BMI: Body mass index; CI: confidence interval; HBP: high blood pressure; RR: relative risk; CN: Chinese National.
According to the CN standard, the duration of being overweight/obese during the sensitive period, instead of other periods, was associated with HBP [Table 3]. In all participants, the cumulative effect (RR: 1.12, 95%CI: 1.07-1.17, P < 0.001) and the average cumulative effect (RR: 1.21, 95%CI: 1.16-1.28, P < 0.001) in the sensitive period were significantly more strongly associated with the risk of HBP than the cumulative effect (RR: 1.01, 95%CI: 1.00-1.03, P = 0.036) and the average cumulative effect (RR: 1.02, 95%CI: 1.00-1.03, P = 0.049) outside the sensitive period. The same results were obtained for boys and girls. The results based on the USA standard were almost consistent with those using the CN standard.
The association between duration, cumulative effect, and average cumulative effect during the sensitive period, as well as variations outside the sensitive period, with the risk of HBP in the last survey
| Standard | Variable | RRa | 95%CI | P | RRb | 95%CI | P | RRc | 95%CI | P |
| CN standard | Duration time in sensitive period (years) | 1.02 | 1.02, 1.03 | 0.024 | 1.03 | 1.03, 1.05 | 0.034 | 1.02 | 1.01, 1.02 | 0.041 |
| Cumulative effect in sensitive period | 1.12 | 1.07, 1.17 | < 0.001 | 1.12 | 1.06, 1.19 | < 0.001 | 1.09 | 1.03, 1.14 | 0.013 | |
| Average cumulative effect in sensitive period | 1.21 | 1.16, 1.28 | < 0.001 | 1.26 | 1.13, 1.42 | < 0.001 | 1.12 | 1.07, 1.16 | 0.022 | |
| Duration time outside of the sensitive period (years) | 1.01 | 0.96, 1.04 | 0.157 | 1.02 | 0.94, 1.09 | 0.378 | 0.97 | 0.93, 1.02 | 0.255 | |
| Cumulative effect outside of the sensitive period | 1.01 | 1.00, 1.03 | 0.036 | 1.01 | 1.01, 1.03 | 0.046 | 1.03 | 1.02, 1.05 | 0.042 | |
| Average cumulative effect outside of the sensitive period | 1.02 | 1.00, 1.03 | 0.049 | 1.03 | 1.02, 1.03 | 0.036 | 1.05 | 1.01, 1.07 | 0.040 | |
| USA standard | Duration time in sensitive period (years) | 1.01 | 1.01, 1.03 | 0.033 | 1.03 | 1.01, 1.04 | 0.038 | 1.01 | 1.00, 1.02 | 0.048 |
| Cumulative effect in sensitive period | 1.14 | 1.09, 1.17 | 0.005 | 1.17 | 1.13, 1.20 | 0.019 | 1.13 | 1.02, 1.25 | 0.035 | |
| Average cumulative effect in sensitive period | 1.25 | 1.14, 1.36 | < 0.001 | 1.24 | 1.11, 1.40 | 0.002 | 1.16 | 1.06, 1.31 | 0.010 | |
| Duration time outside of the sensitive period (years) | 1.00 | 0.94, 1.10 | 0.226 | 1.02 | 0.96, 1.07 | 0.505 | 1.00 | 0.98, 1.01 | 0.728 | |
| Cumulative effect outside of the sensitive period | 1.03 | 1.00, 1.04 | 0.044 | 1.04 | 0.98, 1.10 | 0.116 | 1.02 | 0.98, 1.07 | 0.602 | |
| Average cumulative effect outside of the sensitive period | 1.06 | 1.02, 1.10 | 0.022 | 1.05 | 1.01, 1.11 | 0.029 | 1.07 | 1.03, 1.12 | 0.025 |
Then, to verify the robustness of our results, the cumulative effect and sensitive period of overweight/obesity on HBP were recalculated in different subgroups. Boys and girls were further classified into distinct subgroups based on monthly household income (< 8,000 CNY; ≥ 8,000 CNY) and mothers’ education level (< Bachelor’s degree; ≥ Bachelor’s degree). According to the CN standard [Figure 2], the sensitive period was approximately maintained at 2.5-5.5 years old for boys, while for girls it remained 7.0-8.5 years old. Additionally, the association between the cumulative effect of overweight/obesity and HBP did not change significantly in the different subgroups. The sensitive period and the cumulative effect of overweight/obesity on HBP were also robust according to the USA standard.
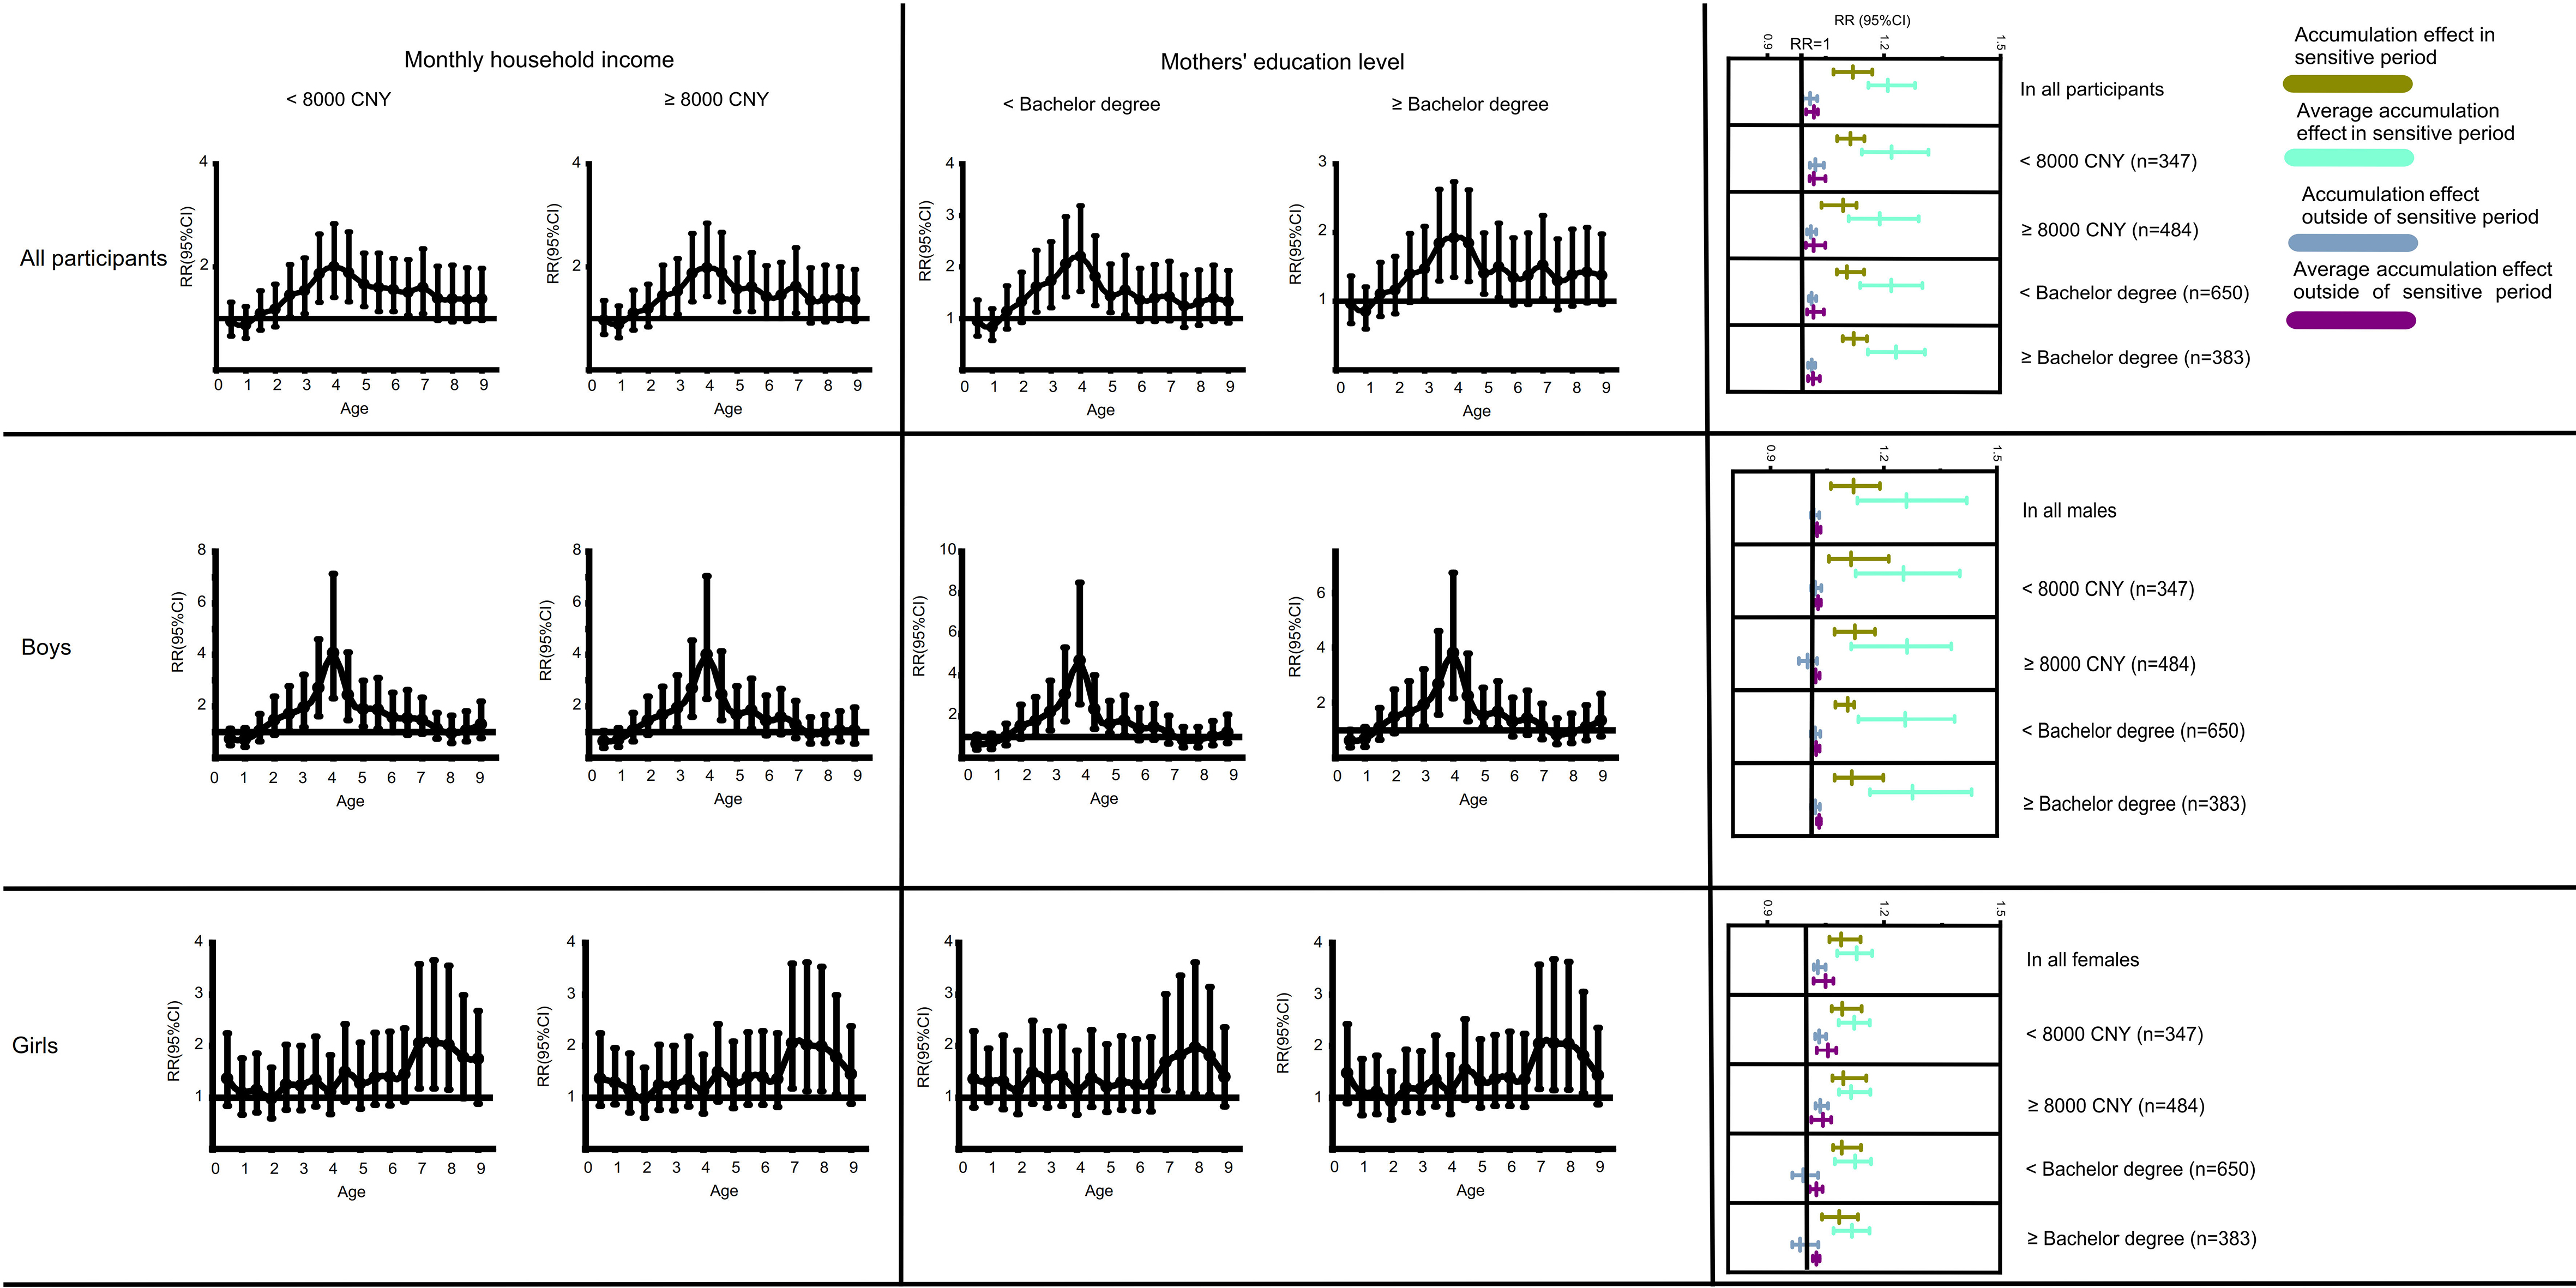
Figure 2. Identification of the Sensitive Period and the associations between cumulative effect of overweight/obesity and childhood high blood pressure based on different subgroups based on the differences in Monthly household income and Mothers’ education level. The participants were grouped based on monthly household income < 8,000 CNY or ≥ 8,000 CNY, and mothers’ education level < Bachelor’s degree or ≥ Bachelor’s degree. CNY: Chinese yuan; HBP: high blood pressure.
DISCUSSION
In this study, we found that the cumulative exposure to overweight/obesity was associated with an elevated risk of HBP in childhood. Besides, we confirmed the existence of a sensitive period for overweight/obesity during childhood. During this period, the cumulative effect of overweight/obesity exerts a stronger correlation to HBP. The sensitive period was 2.5-5.5 years in boys, and 7.0-8.5 years in girls.
Previous research has emphasized that weight gain during the first six postnatal months is an important predictor of future BP[24,25], whereas subsequent studies have suggested that weight gain during childhood may have a stronger association with BP than weight gain in infancy. A cohort study conducted in the USA found that gain of BMI Z-score during 2-3 years old had a greater influence on an increase of SBP in 6-10 years old, compared to the influence of gain of BMI Z-score 0-6 months on SBP[26]. Another cohort study in Asia found that the raised BMI Z-score at 36-48 months was associated with elevated SBP Z-score at 4 years old, whereas the increase of BMI Z-score from birth to 36 months did not present a significant association with elevated SBP Z-score[27]. A study based on the Avon cohort, which followed participants over a longer time span, found that while weight changes from birth to 17 months were associated with raised SBP level at 10 years of age, whereas weight changes from 17 months to 10 years showed a stronger association with both SBP and DBP levels[28]. Recently, a study measured the velocity of weight gain over a defined period by dividing the weight gain by the duration. In this study, the velocity of weight gain in 1-6.5 years presented the strongest association with SBP and DBP in 16 years of age, followed by the velocity of weight gain in 6.5-11.5 years, which also presents a strong association with BP[12].
In our study, the sensitive period during which changes in BMI Z-score on HBP emerged in childhood occurred at around 2.5-5.5 years of age. Although the sensitive period differed between boys and girls, its overall age range (2.5-8.5 years) remained consistent with previous studies[26-28]. BMI gains during this period may have a more pronounced effect on BP increases. Previous studies were conducted with shorter observation periods or longer survey intervals. In contrast, our study used continuous and repeated measurement data over a longer observation period, spanning from birth to grades 3-4 (approximately 9-10 years old), with shorter intervals between surveys. These strengths in this study enhance the ability to accurately identify sensitive periods in child development. Moreover, the first derivatives of all time points on the BMI Z-score curve could reflect changes in BMI Z-scores more sensitively. Accurate identification of these sensitive periods is vital for the early detection, diagnosis, and treatment of HBP in children, which helps to prevent and delay the risk of HBP during childhood.
We found that the sensitive periods for overweight/obesity were different for boys and girls, with the sensitive period appearing earlier in boys. The differences may be attributed to variations in body fat development patterns and fat distribution. The accumulation of fat could increase the risk of HBP in children[29,30]. Dong et al. suggested that the 95th, 90th, and 75th percentiles of total body fat percentage (BF%) in children aged 3-10 years presented an increasing trend in both boys and girls[31]. The growth of BF% seems to be more rapid in boys, which may cause the earlier sensitive period.The later sensitive period in girls may be attributed to a longer cumulative accumulation of fat. In addition, cumulative trunk fat is associated with raised BP levels in children and adolescents[32,33], while leg fat seems to be a protective factor[34]. Therefore, an increased trunk/leg fat (T/L) ratio appears to imply a higher risk of HBP, with the T/L ratio showing a downward trend in boys aged 3-7 years and remaining a relatively stable level in boys aged 7-9 years[31]. The T/L ratio in 3-5.5 years maintains a high level, indicating that the sensitive period emerges during this period in girls. The disappearance of the sensitive period after 5.5 years of age may be due to the decrease of the T/L ratio. In boys, the T/L ratio remains at a stable level in 3-7 years of age and increases thereafter[31], which is consistent with the start of the sensitive period.
Previous studies have revealed that children with a high BMI or who experience rapid weight gain are at a higher risk of HBP[7,35,36], which implies that the long-term accumulation of adipose tissue can contribute to HBP in children. In this study, we confirmed that the cumulative effect of overweight/obesity can increase the risk of HBP in children. Furthermore, we demonstrated that the cumulative exposure to overweight/obesity could have a greater effect on children’s HBP within the sensitive period than outside it. This could be explained by the DOHaD hypothesis, which states that exposure to overweight/obesity has a greater effect than exposure during other periods[12].
There are some limitations that lie in this study. Firstly, the T/L ratio and BF%, which are important influencing factors for HBP, were not measured. The current study only measured height and weight, and the classification of overweight/obesity was based solely on BMI. The missing body composition data may affect the results of the study and should be assessed in future investigations. Several unmeasured confounding factors, such as genetic predisposition, were also not collected in our data. Secondly, HBP in this study was diagnosed based on measurements taken on the same day, whereas taking BP measurements twice on two different days with at least a one-month interval can predict HBP more accurately[37]. Thirdly, this study was conducted in Tianjin, and the number of participants was relatively small. These factors will limit the generalizability of the study results and prevent us from conducting advanced analysis, such as Bayesian relevant life-course exposure model. Fourthly, as it is an observational study, it precludes causal inference. Lastly, the annual survey on behavioral factors was not conducted for children aged 0-7 years. However, certain behavioral factors may be important influencing factors for overweight/obesity and HBP in children.
Conclusion
This study identified the sensitive periods during which overweight and obesity strongly influence the risk of HBP in children aged 9-10 years. Notably, these periods differed between boys and girls: in boys, the sensitive period occurred between 2.5 and 5.5 years, whereas in girls it occurred later, between 7.0 and 8.5 years. Overweight/obesity during the sensitive period had a greater impact on HBP risk than exposure across the entire observation period.
DECLARATIONS
Acknowledgments
We appreciate the children who participated in this study and their parents. We also appreciate our partners Tianjin Women and Children’s Health Center.
Authors’ contributions
Responsible for study implementation, research design, manuscript revision, and funding support: Dong B
Contributed to manuscript revision: Li J
Handled data collection, analysis, and manuscript writing: Feng T
Contributed to study implementation and data collection: Deng R
Responsible for language editing of the manuscript: Peng Y
Availability of data and materials
Data can be available upon request from the corresponding authors.
Financial support and sponsorship
This work was supported by the Beijing Natural Science Foundation (Grant No. 7242187), the Chinese Association for Student Nutrition & Health Promotion-Mead Johnson Nutritionals (China) Joint Fund (CASNHP-MJN2023-11), and the National Natural Science Foundation of China (Grant No. 81903344).
Conflicts of interest
All authors declared that there are no conflicts of interest.
Ethical approval and consent to participate
This study was approved by the Ethics Committee of Peking University (IRB00001052-19099) on (2023.01.16). All participants were asked to sign an informed consent form with the help of their parents.
Consent for publication
Not applicable.
Copyright
© The Author(s) 2025.
REFERENCES
1. Falkner B, Gidding SS, Baker-Smith CM, et al; American Heart Association Council on Hypertension; Council on Lifelong Congenital Heart Disease and Heart Health in the Young; Council on Kidney in Cardiovascular Disease; Council on Lifestyle and Cardiometabolic Health; and Council on Cardiovascular and Stroke Nursing. Pediatric primary hypertension: an underrecognized condition: a scientific statement from the american heart association. Hypertension. 2023;80:e101-11.
2. Tran AH, Flynn JT, Becker RC, et al. Subclinical systolic and diastolic dysfunction is evident in youth with elevated blood pressure. Hypertension. 2020;75:1551-6.
3. Khoury M, Urbina EM. Hypertension in adolescents: diagnosis, treatment, and implications. Lancet Child Adolesc Health. 2021;5:357-66.
4. Chen X, Wang Y. Tracking of blood pressure from childhood to adulthood: a systematic review and meta-regression analysis. Circulation. 2008;117:3171-80.
5. Zhou J, Wu J, Jiang D, et al. National, regional and provincial prevalence of childhood hypertension in China in 2020: a systematic review and modelling study. Lancet Child Adolesc Health. 2024;8:872-81.
6. Cai S, Zhang Y, Chen Z, et al. Secular trends in physical fitness and cardiovascular risks among Chinese college students: an analysis of five successive national surveys between 2000 and 2019. Lancet Reg Health West Pac. 2025;58:101560.
7. Haapala EA. Prevention of cardiovascular diseases since early childhood - is keeping kids at normal weight the best investment? Eur J Prev Cardiol. 2019;26:1323-5.
8. Ge WX, Han D, Ding ZY, et al. Pediatric body mass index trajectories and the risk of hypertension among adolescents in China: a retrospective cohort study. World J Pediatr. 2023;19:76-86.
9. Wang X, Dong B, Huang S, et al. Body mass index trajectory and incident hypertension: results from a longitudinal cohort of Chinese children and adolescents, 2006-2016. Am J Public Health. 2020;110:1689-95.
10. Frankenhuis WE, Nettle D, McNamara JM. Echoes of early life: recent insights from mathematical modeling. Child Dev. 2018;89:1504-18.
11. Plante I, Winn LM, Vaillancourt C, Grigorova P, Parent L. Killing two birds with one stone: pregnancy is a sensitive window for endocrine effects on both the mother and the fetus. Environ Res. 2022;205:112435.
12. Zhang X, Tilling K, Martin RM, et al. Analysis of ‘sensitive’ periods of fetal and child growth. Int J Epidemiol. 2019; 48:116-23.
13. de Onis M, Onyango AW, Borghi E, Siyam A, Nishida C, Siekmann J. Development of a WHO growth reference for school-aged children and adolescents. Bull World Health Organ. 2007;85:660-7.
14. Dong Y, Ma J, Song Y, et al. National blood pressure reference for Chinese Han children and adolescents aged 7 to 17 years. Hypertension. 2017;70:897-906.
15. Flynn JT, Kaelber DC, Baker-Smith CM, et al. Clinical practice guideline for screening and management of high blood pressure in children and adolescents. Pediatrics. 2017;140:e20173035.
16. Calcaterra V, Cena H, Magenes VC, et al. Sugar-sweetened beverages and metabolic risk in children and adolescents with obesity: a narrative review. Nutrients. 2023;15:702.
17. Chen J, Wang Y, Li W, et al. Physical activity and eating behaviors patterns associated with high blood pressure among Chinese children and adolescents. BMC Public Health. 2023;23:1516.
18. Zhang N, Zhu W, Zhang M, Ma G. Interpretation on dietary guidelines for Chinese school-aged children (2022). Chinese Journal of school health. 2022;43:805-8.
19. Brown VA. An introduction to linear mixed-effects modeling in R. Adv Methods Pract Psychol Sci. 2021;4:2515245920960351.
20. Fan B, Yang Y, Dayimu A, et al. Body mass index trajectories during young adulthood and incident hypertension: a longitudinal cohort in Chinese population. J Am Heart Assoc. 2019;8:e011937.
21. Zhang T, Whelton PK, Xi B, et al. Rate of change in body mass index at different ages during childhood and adult obesity risk. Pediatr Obes. 2019;14:e12513.
22. Araújo J, Severo M, Barros H, Ramos E. Duration and degree of adiposity: effect on cardiovascular risk factors at early adulthood. Int J Obes. 2017;41:1526-30.
23. Norris T, Cole TJ, Bann D, et al. Duration of obesity exposure between ages 10 and 40 years and its relationship with cardiometabolic disease risk factors: a cohort study. PLoS Med. 2020;17:e1003387.
24. Ben-Shlomo Y, McCarthy A, Hughes R, Tilling K, Davies D, Smith GD. Immediate postnatal growth is associated with blood pressure in young adulthood: the Barry Caerphilly Growth Study. Hypertension. 2008;52:638-44.
25. Belfort MB, Rifas-Shiman SL, Rich-Edwards J, Kleinman KP, Gillman MW. Size at birth, infant growth, and blood pressure at three years of age. J Pediatr. 2007;151:670-4.
26. Perng W, Rifas-Shiman SL, Kramer MS, et al. Early weight gain, linear growth, and mid-childhood blood pressure: a prospective study in project viva. Hypertension. 2016;67:301-8.
27. Aris IM, Bernard JY, Chen LW, et al. Postnatal height and adiposity gain, childhood blood pressure and prehypertension risk in an Asian birth cohort. Int J Obes. 2017;41:1011-7.
28. Jones A, Charakida M, Falaschetti E, et al. Adipose and height growth through childhood and blood pressure status in a large prospective cohort study. Hypertension. 2012;59:919-25.
29. Ortiz-Pinto MA, Ortiz-Marrón H, Ferriz-Vidal I, et al. Association between general and central adiposity and development of hypertension in early childhood. Eur J Prev Cardiol. 2019;26:1326-34.
30. Tebar WR, Ritti-Dias RM, Farah BQ, Zanuto EF, Vanderlei LCM, Christofaro DGD. High blood pressure and its relationship to adiposity in a school-aged population: body mass index vs waist circumference. Hypertens Res. 2018;41:135-40.
31. Dong H, Yan Y, Liu J, et al; China Child and Adolescent Cardiovascular Health (CCACH) collaboration members. Reference centiles for evaluating total body fat development and fat distribution by dual-energy x-ray absorptiometry among children and adolescents aged 3-18 years. Clin Nutr. 2021;40:1289-95.
32. Yu S, Zhao S, Tang J, et al. Fat-free mass may play a dominant role in the association between systolic blood pressure and body composition in children and adolescents. Br J Nutr. 2024;131:622-9.
33. Agbaje AO, Barker AR, Tuomainen TP. Effects of arterial stiffness and carotid intima-media thickness progression on the risk of overweight/obesity and elevated blood pressure/hypertension: a cross-lagged cohort study. Hypertension. 2022;79:159-69.
34. Cioffi CE, Alvarez JA, Welsh JA, Vos MB. Truncal-to-leg fat ratio and cardiometabolic disease risk factors in US adolescents: NHANES 2003-2006. Pediatr Obes. 2019;14:e12509.
35. Dong J, Dong H, Yan Y, et al. Prevalence of hypertension and hypertension phenotypes after three visits in Chinese urban children. J Hypertens. 2022;40:1270-7.
36. Liu Z, Yang L, Zhao M, Yu Y, Xi B. Weight status change from birth to childhood and high blood pressure in childhood. Future. 2024;2:164-71.
Cite This Article
How to Cite
Download Citation
Export Citation File:
Type of Import
Tips on Downloading Citation
Citation Manager File Format
Type of Import
Direct Import: When the Direct Import option is selected (the default state), a dialogue box will give you the option to Save or Open the downloaded citation data. Choosing Open will either launch your citation manager or give you a choice of applications with which to use the metadata. The Save option saves the file locally for later use.
Indirect Import: When the Indirect Import option is selected, the metadata is displayed and may be copied and pasted as needed.
About This Article
Special Topic
Copyright

Data & Comments
Data
0


Comments
Comments must be written in English. Spam, offensive content, impersonation, and private information will not be permitted. If any comment is reported and identified as inappropriate content by OAE staff, the comment will be removed without notice. If you have any queries or need any help, please contact us at [email protected].