


Liver fibrosis and diabetic peripheral neuropathy in individuals with type 2 diabetes mellitus: an observational, cross-sectional study
 0
0 
Abstract
Aim: To evaluate the association between liver fibrosis, investigated by non-invasive fibrosis scores and measurement of stiffness, and diabetic peripheral neuropathy (DPN) in type 2 diabetes mellitus (T2DM).
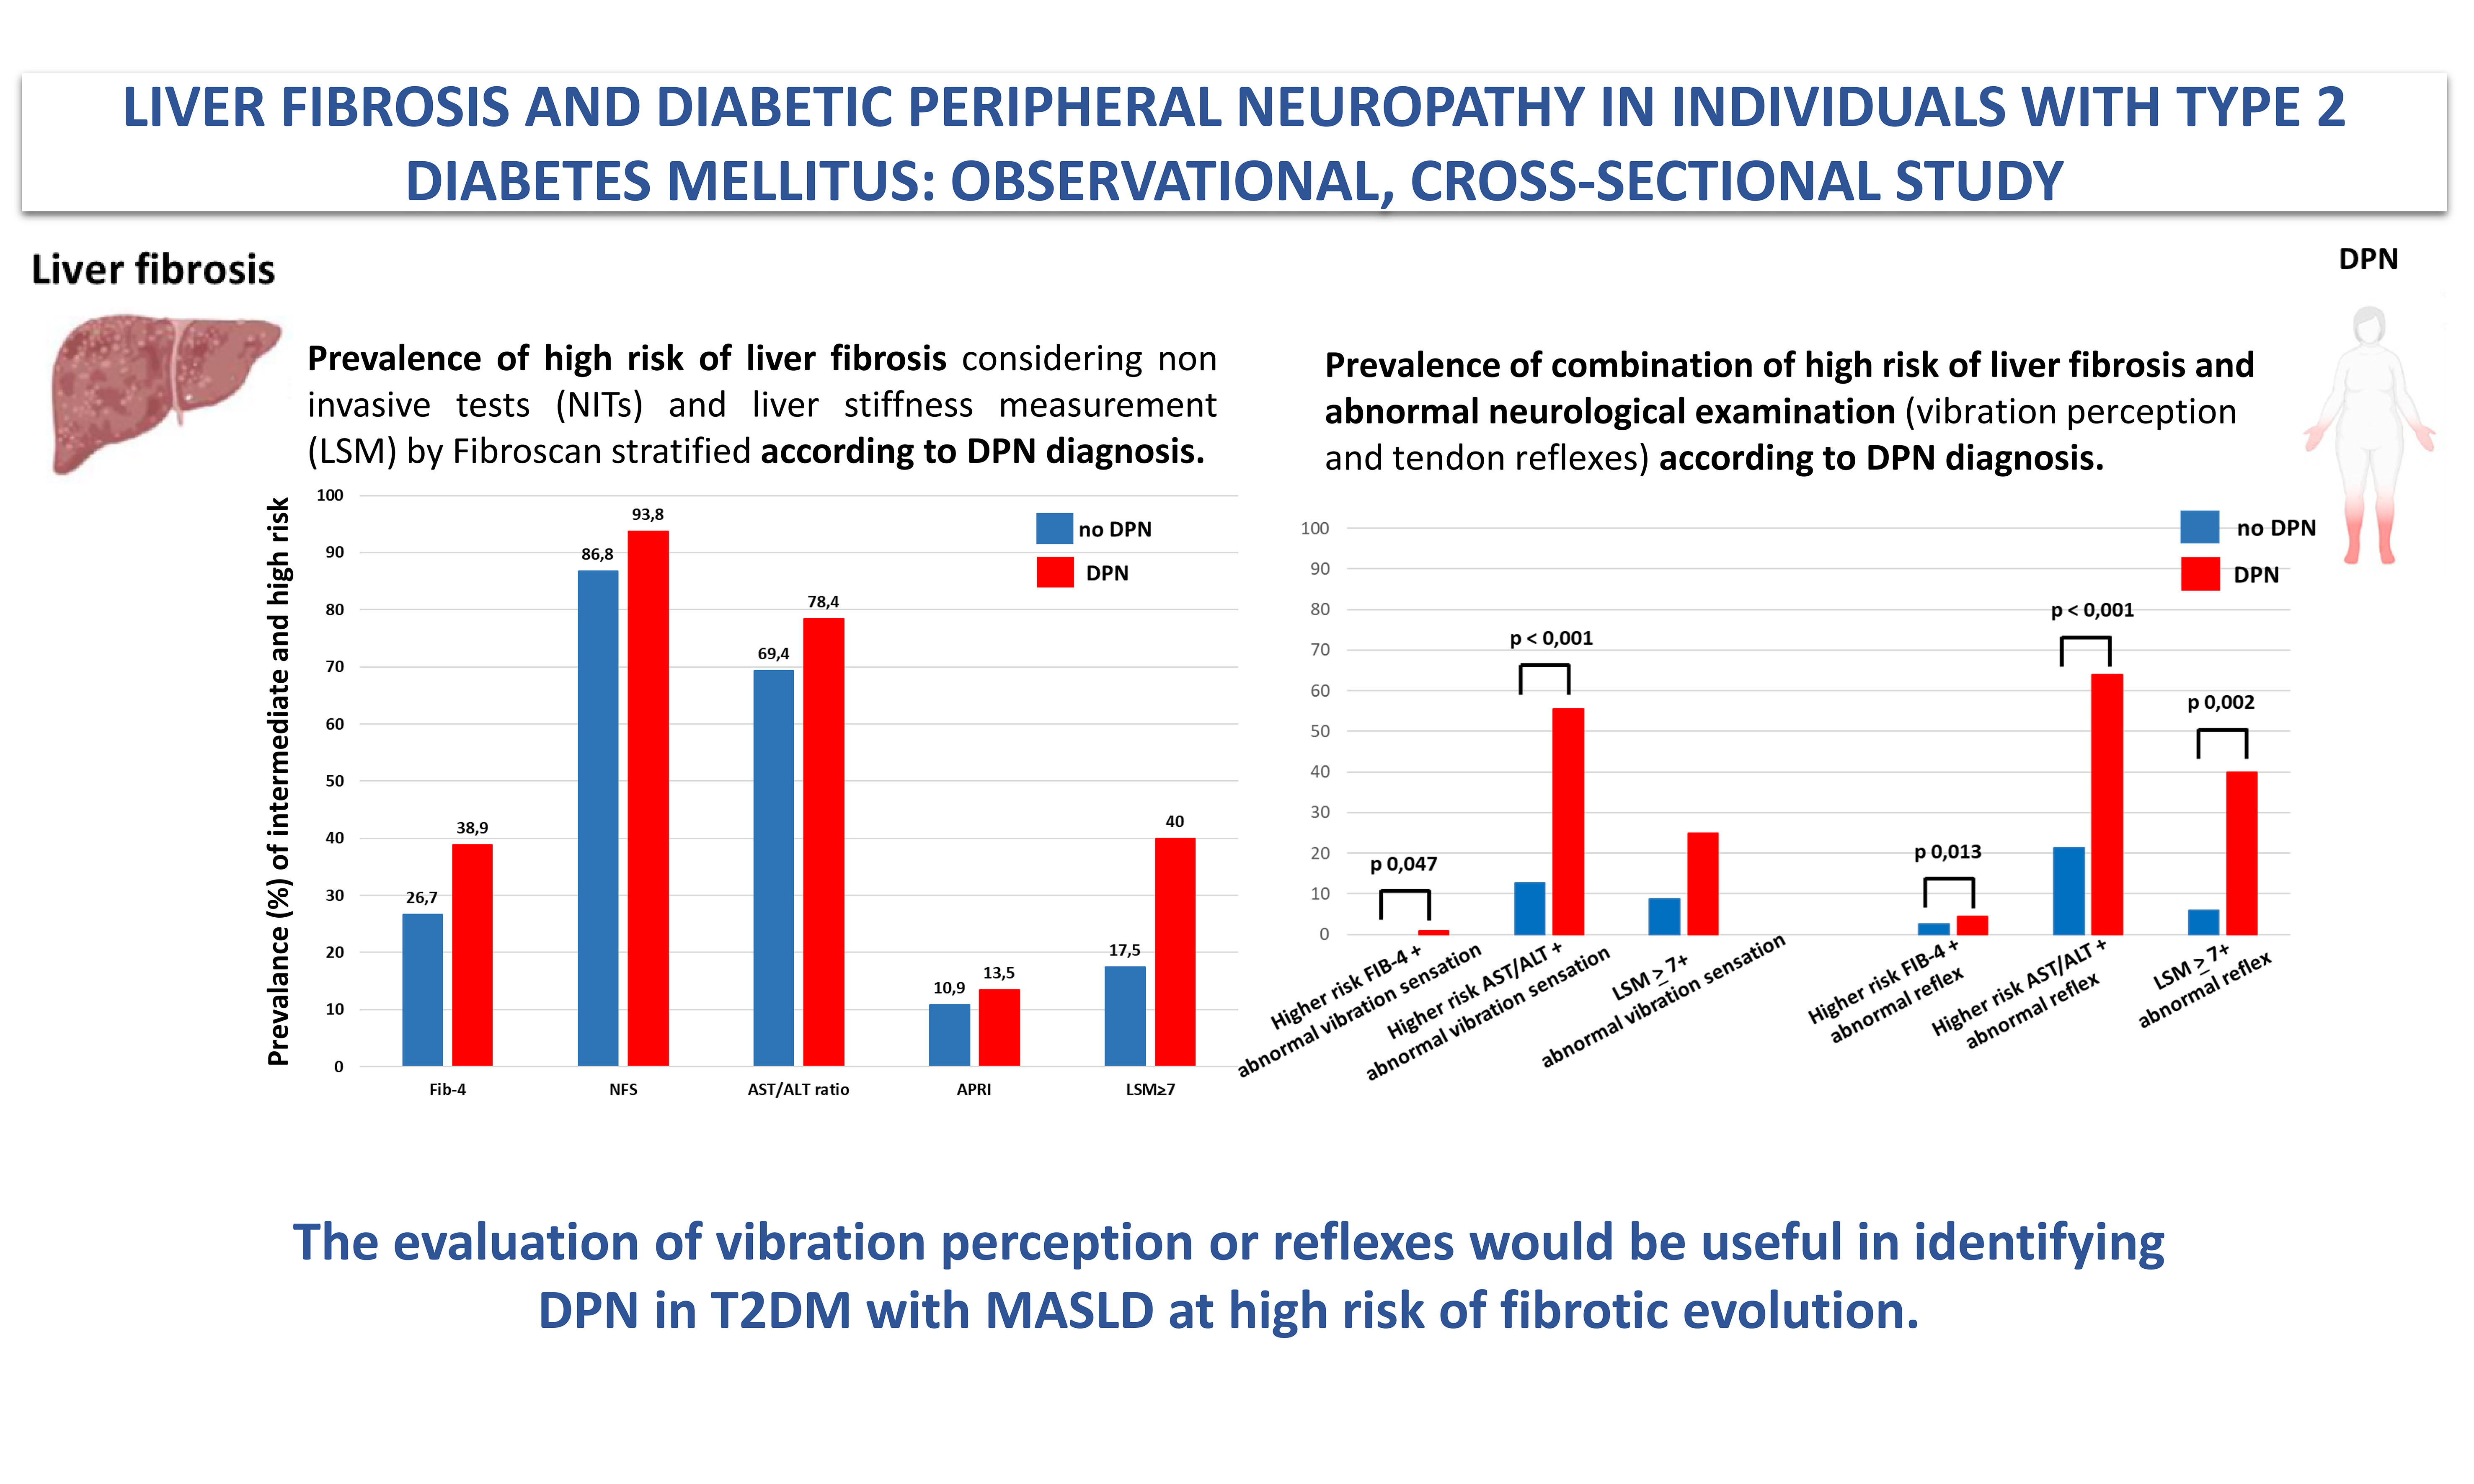
Methods: We conducted a cross-sectional, retrospective study including individuals with T2DM and hepatic steatosis who underwent a DPN examination. Liver fibrosis risk was estimated using the fibrosis-4 score (FIB-4), non-alcoholic fatty liver disease fibrosis score (NFS), aspartate transaminase (AST)/alanine transaminase (ALT) ratio, and the AST to platelet ratio index. Fibrosis was investigated using the vibration-controlled transient elastography (Fibroscan®) in a subgroup of patients. Liver stiffness measurement (LSM) ≥ 7.0 kPa defined significant fibrosis.
Results: Eighty-six T2DM subjects (mean age 59.22 ± 13.18 years; 69.8% male; DPN prevalence 43%) were included. Higher risk scores of liver fibrosis (FIB-4 and AST/ALT) in subjects with DPN compared to those without DPN were detected (FIB-4: 1.23 ± 0.66 vs. 1.63 ± 0.85; P = 0.018; AST/ALT: 0.89 ± 0.23 vs. 1.11 ± 0.61; P = 0.026). The DPN group showed higher LSM values, and the Michigan Diabetic Neuropathy Score was directly related to LSM (Rho: 0.304, P = 0.026). Moreover, a higher prevalence of alteration in vibration or reflexes was observed in subjects with LSM ≥ 7 kPa (P = 0.025 and P = 0.042, respectively). Finally, the evaluation of vibration or reflexes in individuals at high risk of liver fibrosis at FIB-4 and AST/ALT was associated with DPN (FIB-4 + abnormal vibration: P = 0.047; FIB-4 + abnormal reflexes: P = 0.013; AST/ALT + abnormal vibration: P < 0.001; AST/ALT + abnormal reflexes: P < 0.001).
Conclusion: The evaluation of vibration or reflexes would be useful in identifying DPN in T2DM with Metabolic Dysfunction-Associated Steatotic Liver Disease at high risk of fibrotic evolution.
Keywords
INTRODUCTION
Metabolic Dysfunction-Associated Steatotic Liver Disease (MASLD) is defined by the presence of hepatic steatosis in conjunction with one cardiometabolic risk factor[1], notably including type 2 diabetes mellitus (T2DM), and encompasses a broad spectrum of liver disease, from simple steatosis to cirrhosis, including liver fibrosis[2]. MASLD and T2DM share common pathological aspects, the most relevant of which is insulin resistance and its related metabolic dysfunction[3]. In a recent study, the prevalence of MASLD in subjects with T2DM was 64%, while the prevalence of significant fibrosis [defined as liver stiffness measurement (LSM) ≥ 8.1 kiloPascals (kPa)], advanced fibrosis (defined as LSM ≥ 12.1 kPa), and cirrhosis due to MASLD was 17%, 11%, and 3%, respectively[2]. Indeed, T2DM is a recognized independent risk factor for metabolic dysfunction-associated steatohepatitis (MASH) and for advanced liver fibrosis[4,5], and a recent meta-analysis found that MASLD is associated with an increased risk of all-cause mortality among the T2DM population[6].
Moreover, this coexistence also contributes to the higher risk of T2DM-related chronic vascular complications[7]. Regarding macro-vascular complications, MASLD (especially in the stage of fibrosis) is a recognized risk factor for major adverse cardiovascular events and for cardiovascular disease (CVD) morbidity and mortality[3,8]. On the other hand, the effect of MASLD on the development of microvascular complications in individuals with T2DM has been less frequently investigated, and the results are conflicting. In detail, a meta-analysis of nine observational longitudinal studies involving non-hospitalized subjects with T2DM (96,595 adult individuals, 34.1% with MASLD) reported an increased risk of incident chronic kidney disease (CKD) in individuals with MASLD [Hazard ratio (HR): 1.37][9]. Moreover, a recent prospective cohort study found an association between MASLD and nephropathy and neuropathy in subjects with T2DM[10], and a retrospective study found that MASLD increases the risk of end-stage renal disease in subjects with T2DM and diabetic nephropathy[11]. Anyway, the data remains conflicting, since, in other studies, this association was not found[12]. Similarly, MASLD was found to be associated with an increased prevalence of proliferative/laser-treated retinopathy in T2DM individuals in the cross-sectional evaluation from the Valpolicella Study[13], even if in other studies this association was not proven[12]. Considering diabetic peripheral neuropathy (DPN), a significantly increased DPN prevalence among T2DM subjects with MASLD was observed in a meta-analysis including thirteen cross-sectional studies (9,614 participants)[14]. Recently, using the outpatient part of the nationwide Swedish Patient Register, Ebert et al. have collected individuals with a first MASLD diagnosis [number (N) = 6,785] and matched these with up to ten reference individuals from the general population (N = 61,136)[15]. The authors demonstrated that, over a median follow-up of 5.7 years, the incidence rate of microvascular diseases was more than twofold higher in subjects with MASLD {10.8 per 1000 person-years [95% confidence interval (CI): 9.9-11.8]} vs. reference individuals [4.7 per 1,000 person-years (95%CI: 4.5-4.9)][15]. When analyzed separately, MASLD was related to a 46% and 38% increased rate of CKD and retinopathy, respectively[15]. For neuropathy, very few outcomes were observed; therefore, the regressions are not considered reliable and the results were inconclusive[15].
Focusing on liver fibrosis, the association between liver fibrosis and macrovascular complications is well established: as noted above, liver fibrosis is linked to an increased risk of fatal or non-fatal CVD events[8]. However, the association between liver fibrosis and microvascular complications has been less extensively investigated. Furthermore, several practical non-invasive scores have been developed and validated to detect or exclude advanced liver fibrosis. Among these, the non-alcoholic fatty liver disease (NAFLD) fibrosis score (NFS) and the fibrosis-4 (FIB-4) score are the most commonly used scoring systems, and they have been endorsed by international guidelines[16-18]. The studies conducted so far have demonstrated that NFS and FIB-4 scores are able to predict mortality[19-22], cardiovascular events, CKD and liver-related complications in MASLD individuals[21,22]. Focusing on DPN, there are few studies that have evaluated the association with these risk indicators showing inconclusive findings[10,23,24].
Therefore, the association between DPN and liver fibrosis is an emerging finding while the association between fibrosis risk indicators and DPN still has inconclusive evidence. Since the results of the previous studies are controversial, the present study aimed to investigate the association of liver fibrosis, evaluated by non-invasive fibrosis scores and measurement of stiffness, and DPN.
METHODS
An observational, cross-sectional, retrospective study was conducted evaluating the data of subjects followed for T2DM at the diabetes services of Modena University Hospital (Italy) between January 2022 and February 2024. The study enrolled subjects with T2DM and an ultrasound diagnosis of hepatic steatosis who underwent a clinical examination for DPN. Thus, specific inclusion criteria included: age ≥ 18 years, previous diagnosis of T2DM according to American Diabetes Association (ADA) guidelines[25], hepatic steatosis, and previous evaluation of DPN. Exclusion criteria were nondiabetic peripheral neuropathies, excessive alcohol consumption, serious disorders and any clinically relevant disease preventing an adequate understanding of the questionnaires used for neuropathy assessment.
Study design
We collected data on previous biochemical assessment, evaluation of DPN, and evaluation of liver fibrosis. The maximum length of time between biochemical assessment, evaluation of DPN and evaluation of liver fibrosis was three months. Demographic (age and sex), anthropometric (height, weight, waist and hip circumference), clinical (smoking, physical activity, diabetes duration, macro- and microvascular complications of T2DM, comorbidities) and pharmacological data were collected.
Biochemical assessment
The following biochemical parameters were collected: fasting glucose (mg/dL), glycosylated hemoglobin (HbA1c, mmol/mol), aspartate transaminase (AST, U/L), alanine transaminase (ALT, U/L), gamma-glutamyl transferase (gGT, U/L), albumin (g/dL), total cholesterol (mg/dL), high-density lipoprotein (HDL, mg/dL), low-density lipoprotein (LDL) (mg/dL), triglycerides (mg/dL), creatinine (mg/dL), estimated glomerular filtration rate (eGFR) (mL/min), complete blood count.
Evaluation of DPN
Neurological assessment included evaluation of neuropathic symptoms and deficits using validated scoring systems, i.e., the Questionnaire of the Michigan Neuropathy Screening Instrument (MNSI-Q), the Michigan Diabetic Neuropathy Score (MDNS) and Diabetic Neuropathy Index (DNI). MNSI-Q, MDND, and DNI are defined according to standardized scores[26,27]. The definition of DPN required the presence of at least one abnormality among neuropathic symptoms or signs[28], in terms of MNSI-Q cut off > 4 and/or signs in terms of DNI cut off > 2 or MDNS cut off > 7.
Evaluation of liver fibrosis
Risk of advanced fibrosis was estimated using non-invasive tests (NITs): the FIB-4 score[29], the NFS[30], the AST/ALT ratio, and the AST to platelet ratio index (APRI)[31]. Finally, the presence of fibrosis was investigated using vibration-controlled transient elastography (VCTE) (Fibroscan®). Two Fibroscan® probes are available: the M probe and the XL probe; the latter has been designed specifically for use in subjects with obesity. LSMs were performed after at least 3 h of fasting, by two highly experienced operators (> 500 exams). Measurements were conducted on the right lobe of the liver in an area without focal lesions. Results, automatically generated by the software, are expressed in LSM as kPa. The LSMs were considered reliable only if ten successful measurements were obtained corresponding to the median of ten valid measurements. According to literature consensus, LSM value ≥ 7.0 kPa[32] defined the presence of significant liver fibrosis (≥ F2).
Statistical analysis
Continuous and categorical data were compared using the Mann-Whitney test and Fisher’s exact test, respectively. Bivariate correlation analyses were performed by Rho’s Spearman combining DPN scores, risk indexes for liver fibrosis and those variables that changed between subjects with or without DPN. Values are reported as mean ± standard deviation (SD). Statistical analysis was performed using the “Statistical Package for the Social Sciences” software for Windows (version 27.0; SPSS Inc., Chicago, IL, USA). For all comparisons, P < 0.050 was considered statistically significant.
RESULTS
Clinical characteristics of the study population
A total of 86 individuals with T2DM were enrolled in the present study, including 61 men (70.9%) and 25 women (29.1%). The mean age at baseline was 59.22 ± 13.18 years, ranging from 21 to 85 years. All basic clinical characteristics, including age, body mass index (BMI), duration of T2DM, glycaemic control, presence of diabetes complications, blood lipid, kidney and liver function indicators, therapy, etc., are presented in Table 1 and in Supplementary Table 1.
Clinical characteristics of 86 subjects with T2DM and hepatic steatosis, overall and according to the presence of DPN
| Overall (n = 86) | no-DPN (n = 49) | DPN (n = 37) | P | |
| General characteristics | ||||
| Male (%) | 61 (70.9) | 36 (73.5) | 25 (67.6) | 0.551 |
| Age (years) | 59.22 ± 13.18 (21-85) | 54.76 ± 13.04 | 65.14 ± 10.97 | < 0.001 |
| Duration of diabetes (years) | 9.61 ± 8.87 (1-42) | 7.49 ± 7.60 | 12.5 ± 9.71 | 0.009 |
| Body weight (Kg) | 93.01 ± 23.69 | 97.30 ± 25.12 | 87.17 ± 20.53 | 0.051 |
| BMI (Kg/m2) | 32.60 ± 7.45 (18-53) | 34.07 ± 8.08 | 30.62 ± 6.06 | 0.034 |
| With obesity (%) | 52 (60.5) | 32 (65.3) | 20 (54.1) | 0.291 |
| Waist circumference (cm) | 111.24 ± 15.88 (65-145) | 112.86 ± 15.74 | 109.19 ± 16.08 | 0.341 |
| HbA1c (mmol/mol) | 57.71 ± 14.28 (33-95) | 57.76 ± 15.55 | 57.65 ± 12.61 | 0.973 |
| Complications and comorbidities | ||||
| Diabetic retinopathy (%) | 7/79 (8.9) | 1 (2.3) | 6 (17.1) | 0.021 |
| DPN (%) | 37 (43) | --- | --- | --- |
| Albuminuria (%) | 24/83 (28.9) | 9 (18.4) | 15 (44.1) | 0.011 |
| CKD - lowe GFR (%) | 13 (15.1) | 4 (8.2) | 9 (24.3) | 0.038 |
| Hypertension (%) | 69 (80.2) | 36 (73.5) | 33 (89.2) | 0.070 |
| Dyslipidemia (%) | 78 (90.7) | 43 (87.8) | 35 (94.6) | 0.280 |
| Ischemic heart disease (%) | 28 (32.6) | 15 (30.6) | 13 (35.1) | 0.658 |
| Heart failure (%) | 11 (12.8) | 4 (8.2) | 7 (18.9) | 0.139 |
| Cerebrovascular disease (%) | 30 (34.9) | 15 (30.6) | 15 (40.5) | 0.339 |
| Peripheral vascular disease (%) | 8/54 (14.8) | 3 (10.3) | 5 (20) | 0.319 |
Prevalence and clinical characteristics of subjects with DPN
DPN was detected (DPN+) in 43% of the overall cohort (37 subjects). DPN+ subjects were older (P < 0.001) and had a longer duration of diabetes (P = 0.009). Moreover, DPN+ individuals showed a lower BMI (P = 0.034), and a higher presence of diabetic complications, in particular retinopathy (P = 0.021), impaired urinary albumin excretion (P = 0.011), and CKD (P = 0.038) [Table 1]. No significant differences were also observed in other biohumoral assessments such as lipid profile and liver function [Supplementary Table 2] and in the current use of any antidiabetic drugs between subjects with and without DPN [Supplementary Table 3].
Associations between fibrosis indices and LSM, and the presence of DPN
Among fibrosis scores, FIB-4 and AST/ALT ratio scores were higher in DPN+ vs. DPN- (P = 0.018 and P = 0.026, respectively). LSM by VCTE has been investigated in 54 subjects (62.8%); in this cohort, the prevalence of significant liver fibrosis was 25.9%. Although significant fibrosis by VCTE appeared more prevalent in DPN+ vs. DPN- (40% vs. 17.5%), the small sample size did not allow statistical significance to be reached (P = 0.073) [Table 2].
Non-invasive biomarkers of liver fibrosis (86 subjects) and liver stiffness measurement (54 subjects) in the whole population and according to the DPN diagnosis
| Non-invasive biomarkers of fibrosis | (n = 86) | no-DPN (n = 49) | DPN (n = 37) | P |
| FIB-4 score (mean ± SD) | 1.41 ± 0.77 | 1.23 ± 0.66 | 1.63 ± 0.85 | 0.018 |
| FIB-4 higher risk* score (%) | 32.5 | 12 (26.7) | 14 (38.9) | 0.242 |
| NFS (mean ± SD) | - 0,09 ± 1.37 | - 0,37 ± 1.43 | 0.19 ± 1.20 | 0.086 |
| NFS higher risk* score (%) | 89.7 | 33 (86.8) | 30 (93.8) | 0.337 |
| AST/ALT ratio (mean ± SD) | 0.97 ± 0.43 | 0.89 ± 0.23 | 1.11 ± 0.61 | 0.026 |
| AST/ALT ratio higher risk* score (%) | 72.3 | 34 (69.4) | 29 (78.4) | 0.473 |
| APRI score (mean ± SD) | 0.34 ± 0.26 | 0.33 ± 0.27 | 0.34 ± 0.22 | 0.935 |
| APRI higher risk* score (%) | 19 | 5 (10.9) | 5 (13.5) | 0.713 |
| Instrumental evaluation of fibrosis | (n = 54) | no-DPN (n =34) | DPN (n = 20) | P |
| Mean LSM (kPa) | 6.83 ± 4.04 (2.8-22) | 6.56 ± 4.23 | 7.12 ± 3.58 | 0.619 |
| With LSM | 25.9 | 17.5 | 40 | 0.073 |
Associations between fibrosis indices and LSM, and the neurological clinical evaluation performed with MNSI-Q, DNI, and MDNS
Then, we stratified the neurological clinical evaluation (performed with MNSI-Q, DNI, MDNS) according to FIB-4, AST/ALT ratio risk scores and LSM [Table 3]. Subjects with LSM > 7 kPa had higher MNSI-Q scores (P = 0.05) and MDNS scores (P = 0.006), as well as a higher prevalence of abnormal MDNS results (P = 0.05), abnormal vibration sensation at the great toe (P = 0.025), and abnormal reflex testing of the upper and lower limbs (P = 0.042). Moreover, we studied the prevalence of the combination of high risk of having liver fibrosis (evaluated by FIB-4 score and AST/ALT ratio) and one abnormal neurological examination according to the clinical diagnosis of DPN [Table 4]. DPN+ individuals showed higher risk FIB-4 score + abnormal vibration sensation (P = 0.047), higher risk FIB-4 + abnormal reflexes (P = 0.013), higher risk AST/ALT ratio + abnormal vibration sensation (P < 0.001), higher risk AST/ALT ratio + abnormal reflexes
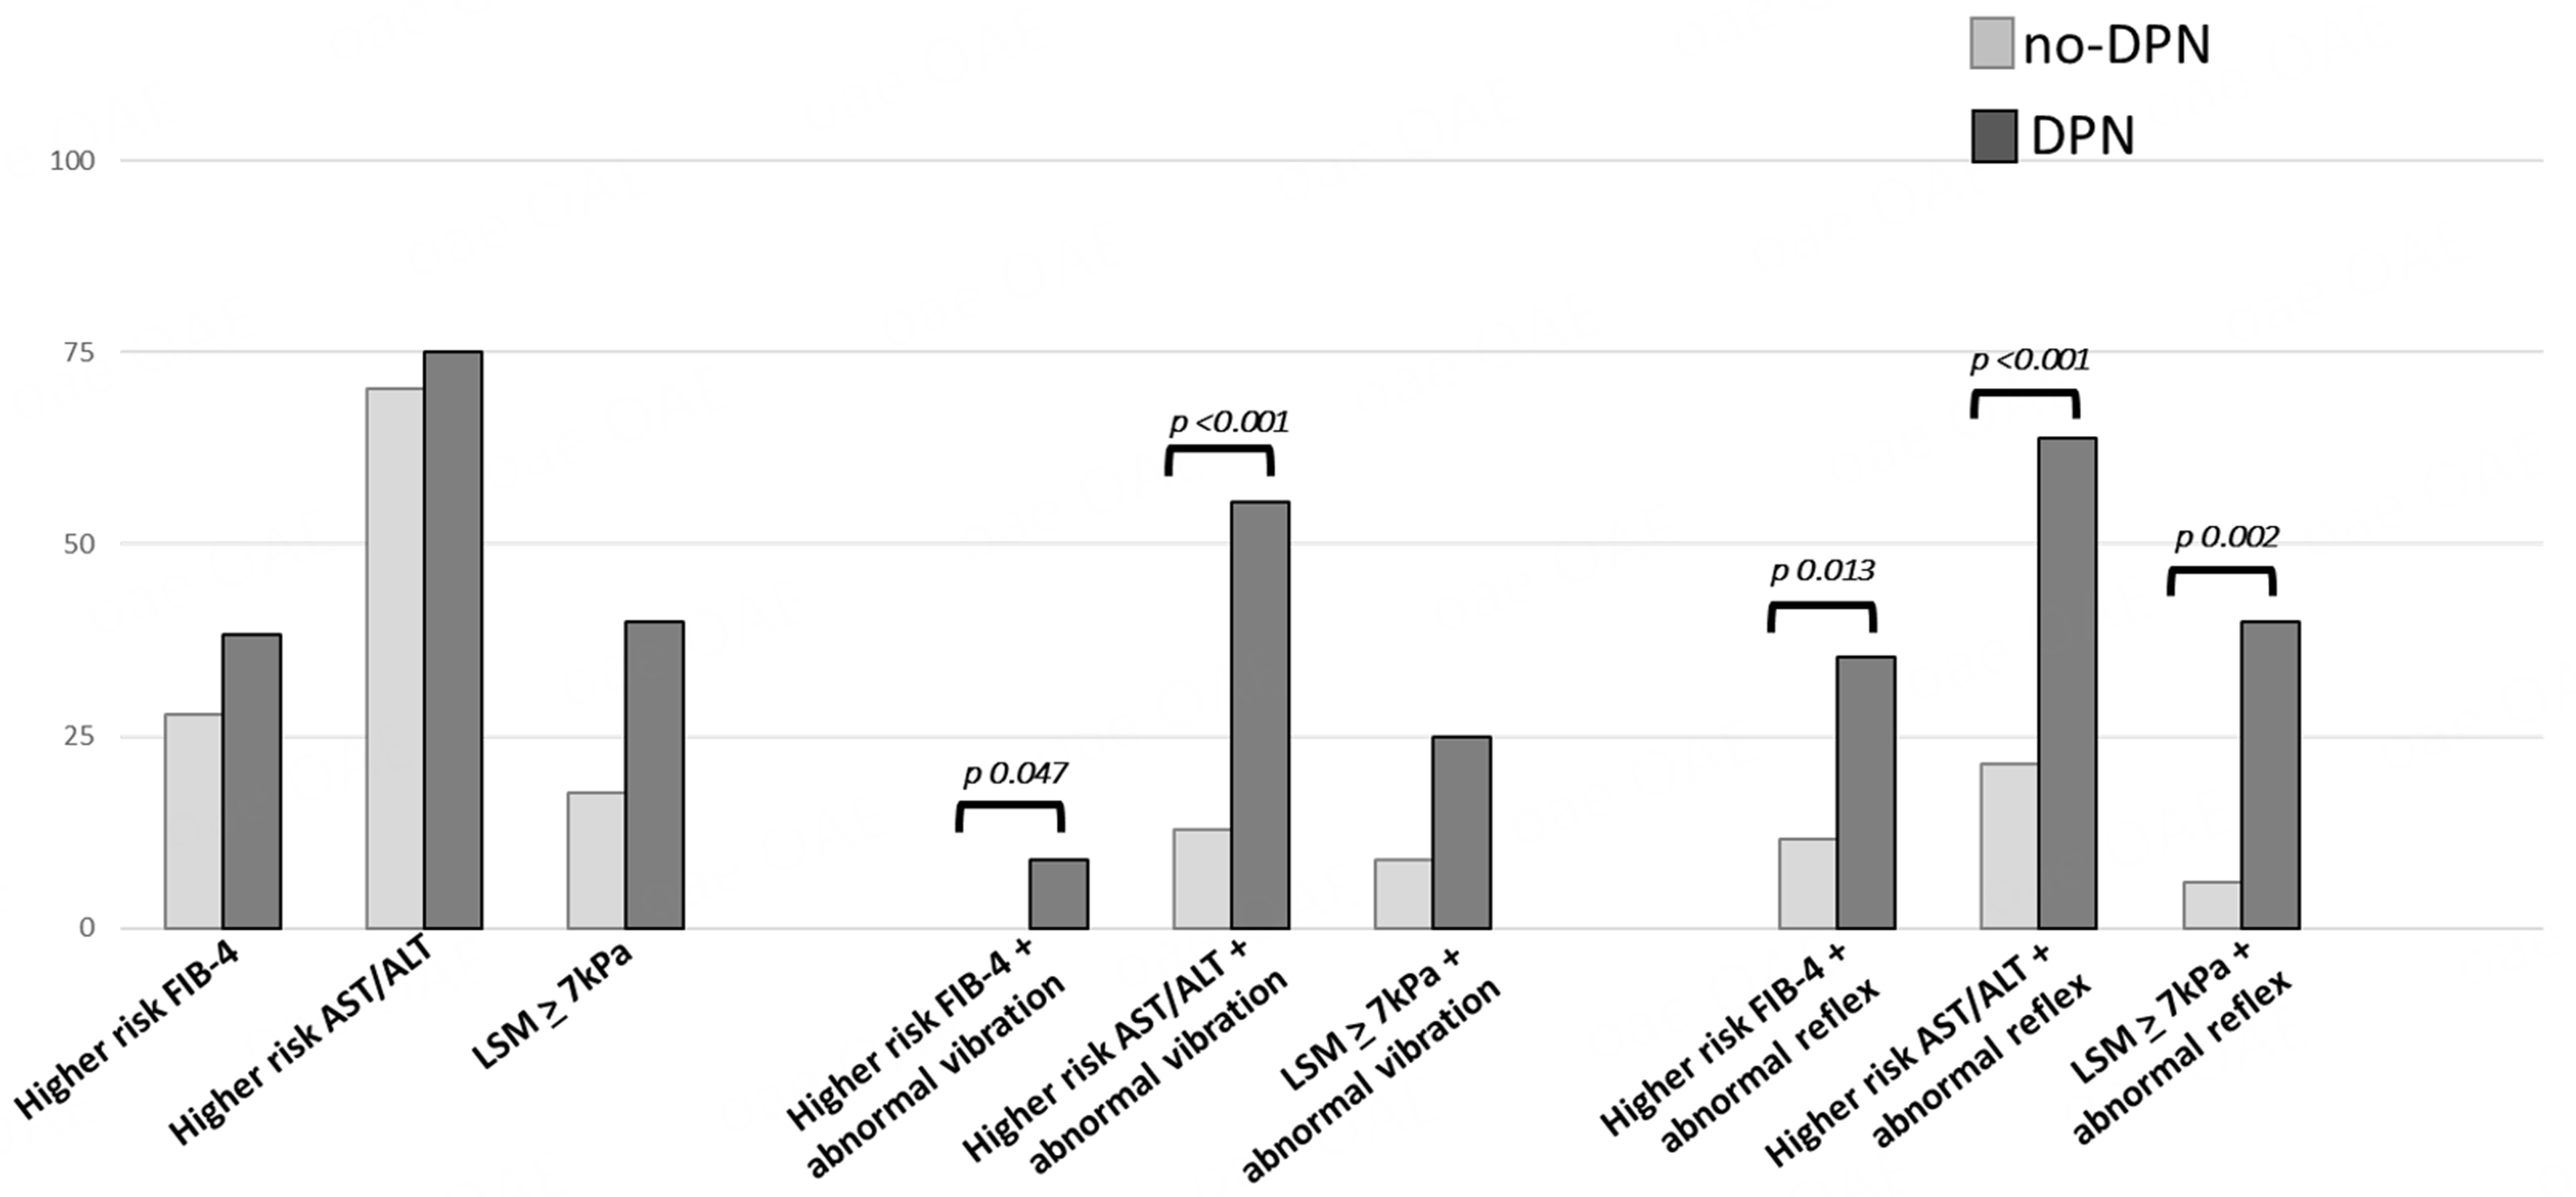
Figure 1. Prevalence of combination of high risk of liver fibrosis (evaluated by FIB-4 score and AST/ALT ratio)/ LSM > 7 kPa and abnormal neurological examination (vibration perception and tendon reflexes) according to the clinical diagnosis of DPN. Statistical method: Fisher’s exact test. FIB-4: Fibrosis-4; AST/ALT: aspartate aminotransferase/alanine aminotransferase ratio; DPN: diabetic peripheral neuropathy; LSM: liver stiffness measurement; kPa: kilopascals.
Neurological clinical evaluation stratified by FIB-4 and AST/ALT risk scores and liver stiffness measurement
| Low risk FIB-4 score (n = 55) | Higher risk* FIB-4 score (n = 26) | P | Low risk AST/ALT (n = 23) | Higher risk* AST/ALT (n = 63) | P | LSM < 7 kPa (n = 40) | LSM (n = 14) | P | |
| With DPN (%) | 22 (40) | 14 (53.8) | 0.336 | 8 (34.8) | 29 (46) | 0.629 | 12 (30) | 8 (57.1) | 0.073 |
| MNSI-Q score | 1.02 ± 1.49 | 1.68 ± 1.84 | 0.96 | 0.7 ± 1.10 | 1.45 ± 1.77 | 0.061 | 1.05 ± 1.39 | 1.00 ± 1.24 | 0.050 |
| MNSI-Q abnormal (%) | 4 (7.3) | 4 (15.4) | 0.263 | 1 (4.3) | 8 (12.7) | 0.239 | 3 (7.5) | 1 (7.1) | 0.484 |
| DNI score | 1.81 ± 1.69 | 2.20 ± 1.77 | 0.351 | 1.85 ± 1.88 | 1.95 ± 1.74 | 0.815 | 1.42 ± 1.76 | 2.21 ± 1.87 | 0.161 |
| DNI abnormal (%) | 18 (32.7) | 12 (46.15) | 0.259 | 8 (34.8) | 23 (36.5) | 0.765 | 10 (25) | 6 (42.9) | 0.083 |
| MDNS | 4.81 ± 5.20 | 6.40 ± 5.87 | 0.231 | 5.09 ± 5.30 | 5.35 ± 5.46 | 0.843 | 3.63 ± 4.38 | 7.93 ± 6.14 | 0.006 |
| MDNS abnormal (%) | 14 (25.45) | 10 (38.5) | 0.246 | 7 (30.4) | 18 (28.6) | 0.969 | 7 (17.5) | 6 (42.9) | 0.050 |
| Abnormal vibration sensation at great toe (%) | 23 (41.8) | 12 (46.15) | 0.756 | 10 (43.5) | 26 (41.3) | 0.990 | 11 (27.5) | 8 (57.1) | 0.025 |
| Abnormal 10 g monofilament test at great toe (%) | 6 (11) | 4 (15.4) | 0.586 | 2 (8.7) | 8 (12.7) | 0.561 | 2 (5) | 4 (28.6) | 0.063 |
| Abnormal pinprick test (%) | 5 (9.1) | 2 (7.7) | 0.817 | 4 (17.4) | 4 (6.3) | 0.138 | 2 (5) | 2 (14.3) | 0.301 |
| Abnormal strength evaluation (%) | 6 (11) | 4 (15.4) | 0.586 | 3 (13) | 8 (12.7) | 0.972 | 2 (5) | 2 (14.3) | 0.101 |
| Abnormal reflex test at upper and lower limbs (%) | 30 (54.5) | 17 (65.4) | 0.385 | 17 (73.9) | 33 (52.4) | 0.115 | 18 (45) | 10 (71.4) | 0.042 |
Prevalence of combination of high risk of liver fibrosis (evaluated by FIB-4 score and AST/ALT ratio)/LSM > 7 kPa and abnormal neurological examination according to the clinical diagnosis of DPN
| no-DPN | DPN | P | |
| Higher* risk FIB-4 + abnormal vibration sensation (%) | 0 | 8.83 | 0.047 |
| Higher* risk FIB-4 + abnormal reflex (%) | 11.6 | 35.3 | 0.013 |
| Higher* risk AST/ALT + abnormal vibration sensation (%) | 12.8 | 55.6 | < 0.001 |
| Higher* risk AST/ALT+ abnormal reflex (%) | 21.3 | 63.9 | < 0.001 |
| LSM | 8.8 | 25 | 0.126 |
| LSM | 5.9 | 40 | 0.02 |
Correlation between fibrosis indices and symptoms and signs of DPN
Finally, MNSI score was significantly directly related to AST/ALT ratio (Rho: 0.27, P = 0.013), while MDNS was significantly directly related to LSM (Rho: 0.304, P = 0.026) [Table 5]. Given the relationship between most NITs and age, BMI, duration of diabetes and HbA1c, a multivariate regression analysis was also performed including these measurements as independent variables. In this analysis, the correlation between the MNSI-Q score and the AST/ALT ratio remained significant [Table 5].
Correlation between liver fibrosis indices and LSM, and symptoms and signs of DPN
| MNSI score | DNI score | MDNS score | FIB-4 score | AST/ALT score | LSM | ||
| MNSI score | Rho | --- | 0.243 | 0.413 | 0.184 | 0.270 | 0.043 |
| P-value | --- | 0.024 | < 0.001 | 0.109 | 0.013* | 0.760 | |
| DNI score | Rho | 0.243 | --- | 0.731 | 0.158 | 0.094 | 0.108 |
| P-value | 0.024 | --- | < 0.001 | 0.170 | 0.399 | 0.439 | |
| MDNS score | Rho | 0.413 | 0.731 | --- | 0.183 | 0.120 | 0.304 |
| P-value | < 0.001 | < 0.001 | --- | 0.112 | 0.281 | 0.026 | |
| FIB-4 score | Rho | 0.184 | 0.158 | 0.183 | --- | 0.615 | 0.197 |
| P-value | 0.109 | 0.170 | 0.112 | --- | < 0.001 | 0.185 | |
| AST/ALT score | Rho | 0.270 | 0.094 | 0.120 | 0.615 | --- | 0.277 |
| P-value | 0.013 | 0.399 | 0.281 | < 0.001 | --- | 0.049 | |
| LSM | Rho | 0.043 | 0.108 | 0.304 | 0.197 | 0.277 | --- |
| P-value | 0.760 | 0.439 | 0.026 | 0.185 | 0.049 | --- | |
DISCUSSION
In this study, we investigated the association between liver fibrosis (evaluated by fibrosis indices and measurement of stiffness) and DPN. Liver fibrosis detected by LSM seems more prevalent in DPN+ subjects, even if this result is not statistically significant, maybe because of the small sample size (40% vs. 17.5%, P = 0.073). Moreover, the fibrosis indices (FIB-4 score and AST/ALT ratio) were higher in DPN+ population, suggesting an association between risk of fibrosis and DPN. Indeed, higher MNSI-Q score (P = 0.05) and MDNS (P = 0.006), abnormal result in MDNS (P = 0.05), abnormal vibration sensation at the great toe (P = 0.025), and abnormal reflexes test at upper and lower limbs (P = 0.042) were associated with an LSM >
The association between liver fibrosis and DPN was already described in literature: a multicenter study on 442 subjects with T2DM demonstrated that significant liver fibrosis is associated with an increased likelihood of having myocardial infarction [adjusted-odds ratio (OR) 6.61, 95%CI: 1.66-37.4], peripheral polyneuropathy (adjusted-OR 4.55, 95%CI: 1.25-16.6), CKD (adjusted-OR 4.54, 95%CI: 1.24-16.6), or retinopathy (adjusted-OR 1.81, 95%CI: 1.62-1.97), independently of cardiometabolic risk factors, diabetes-related variables, and other potential confounders[33]. Moreover, Williams et al. (2015) reported an association between elevated lower-limb vibration perception threshold (VPT) and non-invasive measures of liver fibrosis[34]. In detail, higher VPT was associated with high risk NFS in type 1 diabetes mellitus (T1DM) and T2DM and with liver fibrosis evaluated by LSM in T2DM[34]. This result is in line with our findings. Furthermore, Huang et al. confirmed the correlation between DPN and liver fibrosis in a cohort of 520 individuals with T2DM undergoing a nerve conduction study for neuropathy and FibroTouch for liver steatosis and fibrosis diagnosis[35]. Finally, an Italian study demonstrated that liver fibrosis is associated with macrovascular and microvascular complications (in particular CKD and retinopathy)[36].
Considering possible etiopathological implications, pathogenetic pathways implicated in DPN share with metabolic liver disease risk factors and etiological aspects including hyperglycaemia, insulin resistance and dyslipidaemia. Further, liver fibrosis per se might also be involved in DPN pathogenesis. In detail, bile acids, synthesized from cholesterol in the liver, may function as signaling molecules through various receptors to regulate their own synthesis and other metabolic processes, including glucose, lipid, and energy homeostasis, and have been implicated in the development of liver fibrosis[37]. Takeda G-protein-coupled receptor 5 (TGR5), one of the receptors of bile acid, is widely distributed and expressed in neurons[37], and might mediate its role in the pathogenesis of DPN through inflammation. Indeed, TGR5 plays a key role in different cellular functions by affecting multiple pathways including extracellular signal-regulated kinases (ERK), nuclear factor kB (NF-kB), signal transducer and activator of transcription 3 (STAT3), and protein kinase B (Akt)[38,39]. Indeed, interacting with TGR5, bile acids would inhibit NF-kB activation, leading to an anti-inflammatory effect[37]. Besides, TGR5 activation stimulates cyclic adenosine monophosphate (cAMP)-related pathways[40,41], resulting in a promising agent for inducing myelination in the development of peripheral nerves or remyelination[42]. In an experimental model in vivo, treatment with a TGR5 agonist markedly improved nerve regeneration and functional recovery in sciatic nerve crush-injured mice[43].
Considering a retrospective and observational design of this study, it cannot produce generalisable or transferable findings. Indeed, our clinical observations are not able to prove the causality of the association between PDN and liver fibrosis. However, the findings may indicate trends and associations and can be used to generate hypotheses. A further limitation of this study is the small size of the sample. Considering the prevalence of liver fibrosis and PND in people with T2DM based on previous literature, the sample size was calculated from n = 62 to n = 100 using a sample size calculator set to a two-sided alpha cutoff of 5% (0.05) and a power of 80% and a two-sided alpha cutoff of 5% (0.05) and a power of 95%, respectively. However, the non-significant difference in LSM ≥ 7 kPa between the DPN+ and DPN- groups (40% vs. 17.5%, P = 0.073) in this cohort of 86 subjects may partly reflect the need for a larger sample size, particularly in the subgroup that underwent FibroScan, which so far includes only 54 measurements. Further consideration should be made regarding the LSM cutoff for the definition of liver fibrosis. According to recent ADA and EASD guidelines[44,45], individuals with an LSM ≥ 8.0 kPa should be considered for referral to liver specialty clinics (gastroenterology or hepatology) for additional assessment, including imaging-based methods such as magnetic resonance elastography (MRE) or multi-parametric magnetic resonance imaging (MRI)-derived iron-corrected T1 (cT1). On the other hand, liver biopsy is generally considered when non-invasive assessments are inconclusive or when alternative diagnoses are suspected. However, in our clinical practice, we commonly adopt a lower cutoff of LSM (> 7 kPa) to early identify patients who could benefit from management by a specific interprofessional team, more intensive treatment of risk factors and more active monitoring of the condition of fibrosis and comorbidities. Given this clinical bias, we used the lowest LSM value as the screening cutoff in our analyses. Using an LSM value > 8 kPa led to a further reduction in the sample size, making the trend in the results even more inconsistent. Other limitations are the absence of data about autonomic neuropathy and the lack of liver biopsy (gold standard for the diagnosis of liver fibrosis).
The strength of our study is the well-characterized T2DM population. Moreover, among the strengths of the study, we report the adequate exclusion of possible liver disease from excessive alcohol consumption. Indeed, in the anamnesis collection, alcohol consumption habits were appropriately investigated in order to exclude subjects with a likely alcohol-related liver disease (ALD). Specifically, alcohol consumption of less than 20 g per day in females or less than 30 g per day in males is typically considered acceptable[45]. Another strength of the study is represented by the accurate investigation according to the standard procedures for the clinical diagnosis of PND. Regarding the clinical diagnosis of DPN, it required the presence of at least one abnormality, defined as symptoms with an MNSI-Q cutoff > 4 and/or signs with a DNI cutoff > 2 or an MDNS cutoff > 7. Altered vibration perception or abnormal reflexes alone, although important components of the clinical assessment, are not sufficient for a DPN diagnosis in the absence of overall positivity on the DNI and/or MDNS. On the other hand, the analysis of our observations highlights that in subjects at high risk of liver fibrosis, even a single detected alteration in vibratory sensitivity and/or osteotendinous reflexes is sufficient and accurate to identify the neurological complication.
Despite these limitations, this study suggests the need for special attention to DPN in individuals with T2DM and liver disease. This finding requires validation in larger cohorts, and future studies investigating the molecular mechanisms underlying the association between liver fibrosis and DPN are necessary.
In conclusion, we documented an association between higher fibrosis indices and the presence of DPN; specifically, higher FIB-4 scores and AST/ALT ratios were associated with DPN. The presence of liver fibrosis was particularly associated with signs of DPN, especially abnormal vibration sensation at the great toe and abnormal reflex testing of the upper and lower limbs, indicative of large nerve fiber involvement. Moreover, an indeterminate or high risk on the FIB-4 score or AST/ALT ratio, or an LSM > 7 kPa, in combination with at least one sign of DPN - either abnormal vibration sensation at the great toe or abnormal reflex testing of the upper and lower limbs - was associated with the presence of DPN. In clinical practice, for subjects with T2DM and liver fibrosis or at risk of liver fibrosis (as assessed by the FIB-4 score or AST/ALT ratio), it can be useful to assess vibration sensation at the great toe and reflexes to identify individuals with DPN.
Therefore, this cross-sectional study systematically investigates, for the first time, the screening value of combining non-invasive liver fibrosis indicators (FIB-4 and AST/ALT ratio) with vibration perception or reflex tests for DPN in T2DM patients with MASLD. These findings support the proposal of a combined screening model of “high-risk liver fibrosis + abnormal simple neurological signs,” which may have potential clinical utility.
DECLARATIONS
Authors’ contributions
Conception or design: Greco C
Drafting or revising the work: Zanni E, Coluccia S, Boni S, Colzani M, Sueri R, Nascimbeni F, Greco C
Final approval of the manuscript: Zanni E, Coluccia S, Boni S, Colzani M, Sueri R, Nascimbeni F, Greco C
Availability of data and materials
Derived data supporting the findings of this study are available from the corresponding author upon request.
Financial support and sponsorship
None.
Conflicts of Interest
Lugari S, Nascimbeni F, and Greco C are Junior Editorial Board Members of the journal Metabolism and Target Organ Damage. They were not involved in any steps of the editorial process, notably including reviewers' selection, manuscript handling or decision-making. The other authors declare that there are no conflicts of interest.
Ethical approval and consent to participate
This study was performed in accordance with the Declaration of Helsinki. Source documents of research material in the form of paper files and electronic files, and all data sets are deposited at the Unit of Endocrinology of Azienda Ospedaliero-Universitaria of Modena (Italy) and are available upon request. The Institutional Review Board of Modena and the Ethical Committee of Modena approved this study (Prot. Azienda Ospedaliero-Universitaria 533/2021). According to the Ethics Committee recommendations and considering the retrospective study design, informed consent was waived since data were collected anonymously.
Consent for publication
Not applicable.
Copyright
© The Author 2025.
REFERENCES
1. Rinella ME, Lazarus JV, Ratziu V, et al; NAFLD Nomenclature consensus group. A multisociety Delphi consensus statement on new fatty liver disease nomenclature. J Hepatol. 2023;78:1966-86.
2. Forlano R, Stanic T, Jayawardana S, et al. A prospective study on the prevalence of MASLD in people with type-2 diabetes in the community. Cost effectiveness of screening strategies. Liver Int. 2024;44:61-71.
3. Targher G, Byrne CD, Tilg H. MASLD: a systemic metabolic disorder with cardiovascular and malignant complications. Gut. 2024;73:691-702.
4. Chan WK, Chuah KH, Rajaram RB, Lim LL, Ratnasingam J, Vethakkan SR. Metabolic dysfunction-associated steatotic liver disease (MASLD): a state-of-the-art review. J Obes Metab Syndr. 2023;32:197-213.
5. Mantovani A, Petracca G, Beatrice G, Tilg H, Byrne CD, Targher G. Non-alcoholic fatty liver disease and risk of incident diabetes mellitus: an updated meta-analysis of 501 022 adult individuals. Gut. 2021;70:962-9.
6. Wongtrakul W, Charatcharoenwitthaya N, Charatcharoenwitthaya P. Metabolic dysfunction-associated steatotic liver disease and the risk of mortality in individuals with type 2 diabetes: a systematic review and meta-analysis. Eur J Gastroenterol Hepatol. 2024;36:351-8.
7. Targher G, Lonardo A, Byrne CD. Nonalcoholic fatty liver disease and chronic vascular complications of diabetes mellitus. Nat Rev Endocrinol. 2018;14:99-114.
8. Mantovani A, Csermely A, Petracca G, et al. Non-alcoholic fatty liver disease and risk of fatal and non-fatal cardiovascular events: an updated systematic review and meta-analysis. Lancet Gastroenterol Hepatol. 2021;6:903-13.
9. Mantovani A, Zaza G, Byrne CD, et al. Nonalcoholic fatty liver disease increases risk of incident chronic kidney disease: a systematic review and meta-analysis. Metabolism. 2018;79:64-76.
10. Deravi N, Dehghani Firouzabadi F, Moosaie F, et al. Non-alcoholic fatty liver disease and incidence of microvascular complications of diabetes in patients with type 2 diabetes: a prospective cohort study. Front Endocrinol. 2023;14:1147458.
11. Zou Y, Zhao L, Zhang J, et al. Metabolic-associated fatty liver disease increases the risk of end-stage renal disease in patients with biopsy-confirmed diabetic nephropathy: a propensity-matched cohort study. Acta Diabetol. 2023;60:225-33.
12. Wen X, Zhou X, Chen D, Cheng J, Ji L. Association between non-alcoholic fatty liver disease and diabetes-related microvascular complications: a retrospective cross-sectional study of hospitalized patients. Endocr Pract. 2022;28:304-9.
13. Targher G, Bertolini L, Rodella S, et al. Non-alcoholic fatty liver disease is independently associated with an increased prevalence of chronic kidney disease and proliferative/laser-treated retinopathy in type 2 diabetic patients. Diabetologia. 2008;51:444-50.
14. Greco C, Nascimbeni F, Carubbi F, Andreone P, Simoni M, Santi D. Association of nonalcoholic fatty liver disease (NAFLD) with peripheral diabetic polyneuropathy: a systematic review and meta-analysis. J Clin Med. 2021;10:4466.
15. Ebert T, Widman L, Stenvinkel P, Hagström H. Increased risk for microvascular outcomes in NAFLD-A nationwide, population-based cohort study. J Intern Med. 2023;294:216-27.
16. European Association for the Study of the Liver. EASL Clinical Practice Guidelines on non-invasive tests for evaluation of liver disease severity and prognosis - 2021 update. J Hepatol. 2021;75:659-89.
17. Cusi K, Isaacs S, Barb D, et al. American Association of Clinical Endocrinology Clinical Practice Guideline for the diagnosis and management of nonalcoholic fatty liver disease in primary care and endocrinology clinical settings: co-sponsored by the American Association for the Study of Liver Diseases (AASLD). Endocr Pract. 2022;28:528-62.
18. European Association for the Study of the Liver (EASL), European Association for the Study of Diabetes (EASD), European Association for the Study of Obesity (EASO). EASL-EASD-EASO Clinical Practice Guidelines for the management of non-alcoholic fatty liver disease. J Hepatol. 2016;59:1121-40.
19. Salomone F, Micek A, Godos J. Simple scores of fibrosis and mortality in patients with NAFLD: a systematic review with meta-analysis. J Clin Med. 2018;7:219.
20. De Vincentis A, Costanzo L, Vespasiani-Gentilucci U, et al. Association between non-invasive liver fibrosis scores and occurrence of health adverse outcomes in older people. Dig Liver Dis. 2019;51:1330-6.
21. Önnerhag K, Hartman H, Nilsson PM, Lindgren S. Non-invasive fibrosis scoring systems can predict future metabolic complications and overall mortality in non-alcoholic fatty liver disease (NAFLD). Scand J Gastroenterol. 2019;54:328-34.
22. Hagström H, Nasr P, Ekstedt M, Stål P, Hultcrantz R, Kechagias S. Accuracy of noninvasive scoring systems in assessing risk of death and liver-related endpoints in patients with nonalcoholic fatty liver disease. Clin Gastroenterol Hepatol. 2019;17:1148-56.e4.
23. Kim K, Oh TJ, Cho HC, et al. Liver fibrosis indices are related to diabetic peripheral neuropathy in individuals with type 2 diabetes. Sci Rep. 2021;11:24372.
24. Leite NC, Cardoso CRL, Salles GF. Importance of non-invasive liver fibrosis scores for mortality and complications development in individuals with type 2 diabetes. J Diabetes Complications. 2021;35:107879.
25. ElSayed NA, Aleppo G, Aroda VR, et al. 2. classification and diagnosis of diabetes: standards of care in diabetes-2023. Diabetes Care. 2023;46:S19-40.
26. Feldman EL, Stevens MJ, Thomas PK, Brown MB, Canal N, Greene DA. A practical two-step quantitative clinical and electrophysiological assessment for the diagnosis and staging of diabetic neuropathy. Diabetes Care. 1994;17:1281-9.
27. Fedele D, Comi G, Coscelli C, et al. A multicenter study on the prevalence of diabetic neuropathy in Italy. Italian Diabetic Neuropathy Committee. Diabetes Care. 1997;20:836-43.
28. Dyck PJ, Albers JW, Andersen H, et al; Toronto Expert Panel on Diabetic Neuropathy. Diabetic polyneuropathies: update on research definition, diagnostic criteria and estimation of severity. Diabetes Metab Res Rev. 2011;27:620-8.
29. Sterling RK, Lissen E, Clumeck N, et al; APRICOT Clinical Investigators. Development of a simple noninvasive index to predict significant fibrosis in patients with HIV/HCV coinfection. Hepatology. 2006;43:1317-25.
30. Angulo P, Hui JM, Marchesini G, et al. The NAFLD fibrosis score: a noninvasive system that identifies liver fibrosis in patients with NAFLD. Hepatology. 2007;45:846-54.
31. Wai CT, Greenson JK, Fontana RJ, et al. A simple noninvasive index can predict both significant fibrosis and cirrhosis in patients with chronic hepatitis C. Hepatology. 2003;38:518-26.
32. Wong VW, Vergniol J, Wong GL, et al. Diagnosis of fibrosis and cirrhosis using liver stiffness measurement in nonalcoholic fatty liver disease. Hepatology. 2010;51:454-62.
33. Mikolasevic I, Rahelic D, Turk-Wensween T, et al. Significant liver fibrosis, as assessed by fibroscan, is independently associated with chronic vascular complications of type 2 diabetes: a multicenter study. Diabetes Res Clin Pract. 2021;177:108884.
34. Williams KH, Burns K, Constantino M, et al. An association of large-fibre peripheral nerve dysfunction with non-invasive measures of liver fibrosis secondary to non-alcoholic fatty liver disease in diabetes. J Diabetes Complications. 2015;29:1240-7.
35. Huang J, Li R, Liu N, et al. Liver fibrosis is independently associated with diabetic peripheral neuropathy in type 2 diabetes mellitus. J Diabetes Investig. 2021;12:2019-27.
36. Lombardi R, Airaghi L, Targher G, et al. Liver fibrosis by FibroScan® independently of established cardiovascular risk parameters associates with macrovascular and microvascular complications in patients with type 2 diabetes. Liver Int. 2020;40:347-54.
37. Arab JP, Karpen SJ, Dawson PA, Arrese M, Trauner M. Bile acids and nonalcoholic fatty liver disease: molecular insights and therapeutic perspectives. Hepatology. 2017;65:350-62.
39. Deutschmann K, Reich M, Klindt C, et al. Bile acid receptors in the biliary tree: TGR5 in physiology and disease. Biochim Biophys Acta Mol Basis Dis. 2018;1864:1319-25.
40. Hu X, Yan J, Huang L, et al. INT-777 attenuates NLRP3-ASC inflammasome-mediated neuroinflammation via TGR5/cAMP/PKA signaling pathway after subarachnoid hemorrhage in rats. Brain Behav Immun. 2021;91:587-600.
41. Lewis ND, Patnaude LA, Pelletier J, et al. A GPBAR1 (TGR5) small molecule agonist shows specific inhibitory effects on myeloid cell activation in vitro and reduces experimental autoimmune encephalitis (EAE) in vivo. PLoS One. 2014;9:e100883.
43. Liu X, Guan J, Wu Z, Xu L, Sun C. The TGR5 agonist INT-777 promotes peripheral nerve regeneration by activating cAMP-dependent protein kinase A in schwann cells. Mol Neurobiol. 2023;60:1901-13.
44. Cusi K, Abdelmalek MF, Apovian CM, et al. Metabolic dysfunction-associated steatotic liver disease (MASLD) in people with diabetes: the need for screening and early intervention. A consensus report of the American Diabetes Association. Diabetes Care. 2025;48:1057-82.
45. European Association for the Study of the Liver (EASL), European Association for the Study of Diabetes (EASD), European Association for the Study of Obesity (EASO). EASL-EASD-EASO Clinical Practice Guidelines on the management of metabolic dysfunction-associated steatotic liver disease (MASLD). J Hepatol. 2024;81:492-542.
Cite This Article
How to Cite
Download Citation
Export Citation File:
Type of Import
Tips on Downloading Citation
Citation Manager File Format
Type of Import
Direct Import: When the Direct Import option is selected (the default state), a dialogue box will give you the option to Save or Open the downloaded citation data. Choosing Open will either launch your citation manager or give you a choice of applications with which to use the metadata. The Save option saves the file locally for later use.
Indirect Import: When the Indirect Import option is selected, the metadata is displayed and may be copied and pasted as needed.
About This Article
Special Topic
Copyright

Data & Comments
Data
0


Comments
Comments must be written in English. Spam, offensive content, impersonation, and private information will not be permitted. If any comment is reported and identified as inappropriate content by OAE staff, the comment will be removed without notice. If you have any queries or need any help, please contact us at [email protected].