


The global burden of diabetes-related chronic kidney disease from 1990 to 2021, with projections to 2036
 0
0 Abstract
Aim: Diabetes-related chronic kidney disease (CKD) is a major cause of both CKD and end-stage renal disease. This study aimed to examine updated global trends in the burden of diabetes-related CKD from 1990 to 2021, stratified by location, age, and sex.
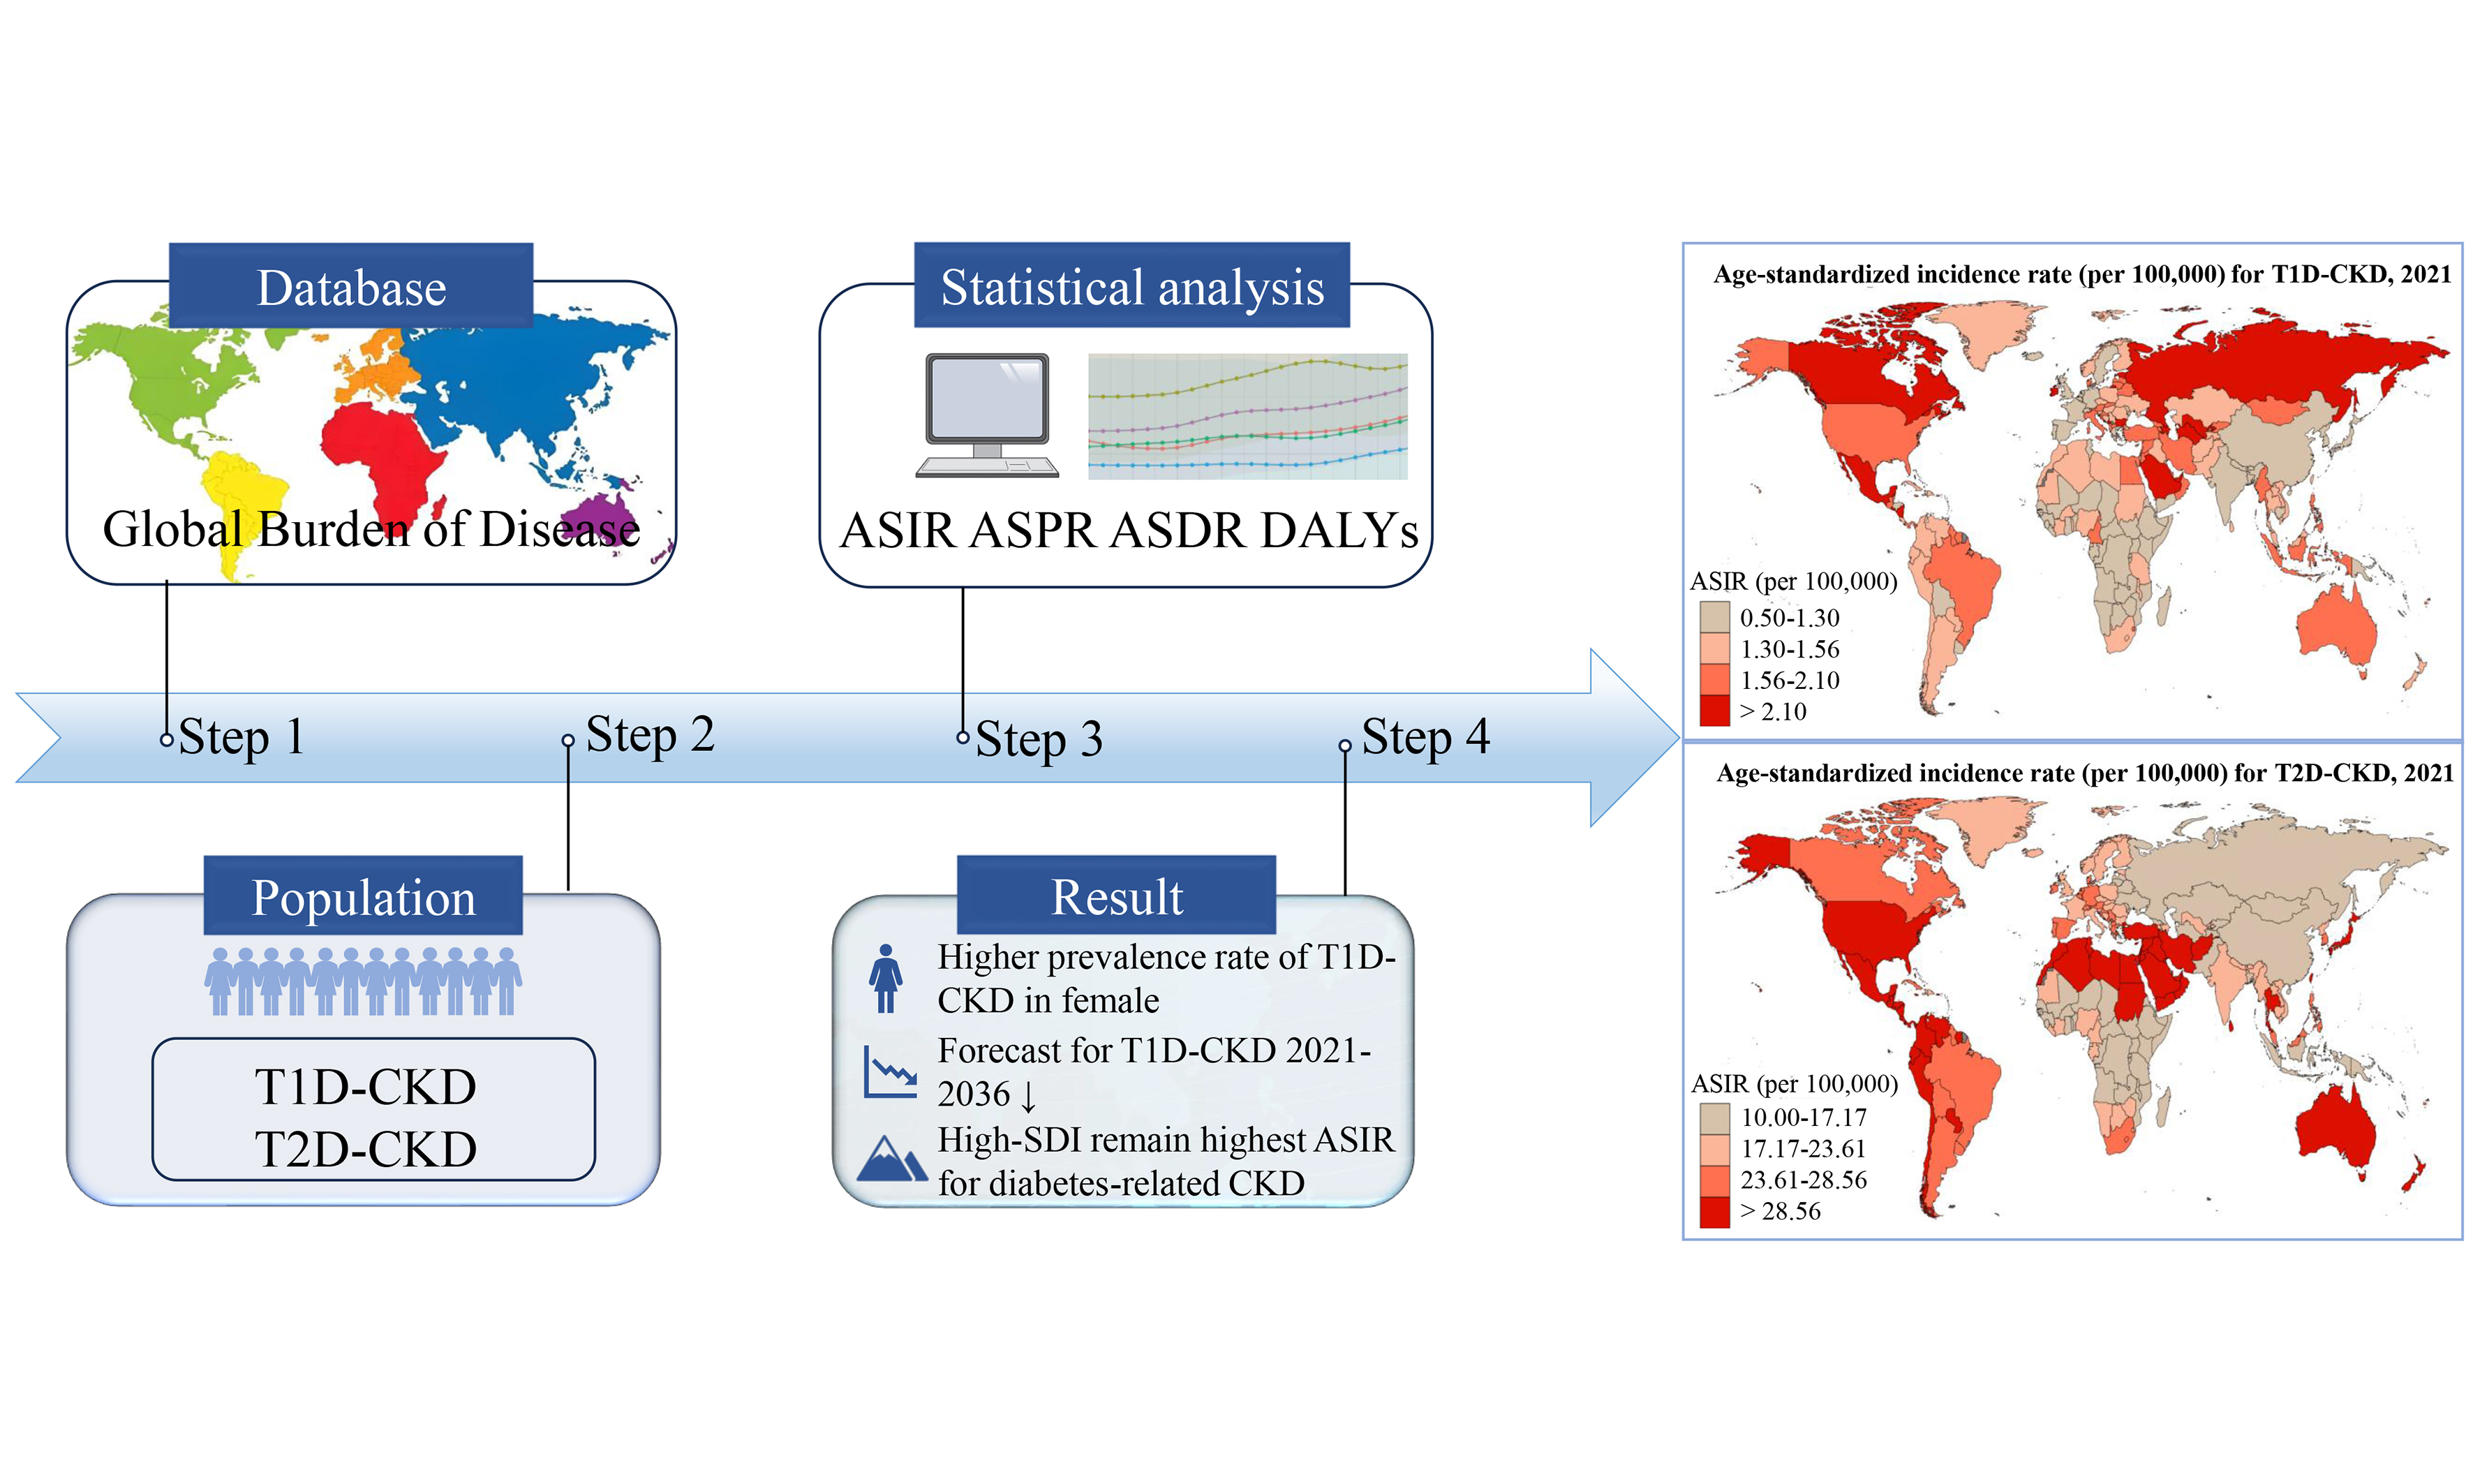
Methods: Using data from the Global Burden of Disease (GBD) 2021 dataset, we quantified the burden of CKD worldwide, including prevalence, incidence, mortality, and disability-adjusted life years (DALYs).
Results: From 1990 to 2021, global surveillance revealed a persistent increase in the burden of diabetes-related CKD, with age-standardized incidence rates (ASIRs) rising significantly across socio-demographic index (SDI) quintiles. Forecasted ASIR for type 2 diabetes-related CKD (T2D-CKD) shows a consistent pattern of escalation, whereas type 1 diabetes-related CKD (T1D-CKD) is expected to decrease from 2021 to 2036. Across all SDI quintiles, ASIR for diabetes-related CKD increased progressively, with high-SDI regions showing the highest rates. Moreover, the global DALY burden peaked in the 50-54 age group for T1D-CKD and in the 65-69 age group for T2D-CKD in the Southeast Asia, East Asia, and Oceania super-region. Overall, the burden of diabetes-related CKD was higher in males, while the prevalence of T1D-CKD was higher in females.
Conclusion: The global burden of diabetes-related CKD increased substantially between 1990 and 2021 across diverse geographic regions. Target strategies are urgently needed to reduce the burden of diabetes-related CKD and address this growing public health challenge.
Keywords
INTRODUCTION
The prevalence rates of type 1 diabetes (T1D) and type 2 diabetes (T2D), the two most common forms of the disease, have been rising steadily worldwide. According to estimates from the Global Burden of Disease (GBD), Injuries, and Risk Factors Study 2021, approximately 529 million people currently live with diabetes, and this number is projected to exceed 1.31 billion by 2050, creating substantial challenges for healthcare systems worldwide[1]. The global prevalence of diabetes among adults is about 8%, with nearly 90% of cases being T2D and ~10% being T1D[2]. Over time, approximately half of individuals with T2D and 30% of those with T1D develop chronic kidney disease (CKD), and diabetes mellitus has been identified as the leading global cause of CKD[3,4]. Among the long-term complications of diabetes, CKD imposes the greatest burden, with diabetic kidney disease (DKD) accounting for nearly one-third of disability-adjusted life-years (DALYs), a key measure of overall disease burden[5].
Diabetes-related CKD is characterized by progressive kidney damage mainly driven by chronic hyperglycemia and encompasses a spectrum of renal abnormalities ranging from albuminuria to end-stage renal disease (ESRD)[6]. In the next two decades, the number of people living with diabetes is expected to increase by 50%, reaching nearly 700 million worldwide[7,8]. Age and sex are major modifiers of diabetes-related CKD risk[9,10]. Females with diabetes tend to have a higher prevalence of advanced CKD and more renal risk factors than males, with these sex-related disparities most pronounced among the elderly[11]. Furthermore, epidemiological data from the GBD Study reveal a substantial increase in CKD burden attributable to T2D between 1990 and 2019[12]. Thus, diabetes-related CKD is a major cause of morbidity and mortality among people with diabetes, posing substantial challenges to healthcare systems worldwide. Beyond estimating the current and future burden of diabetes, it is crucial to identify and characterize high-risk patient populations to develop more targeted prevention strategies.
Accordingly, this large-scale study aimed to describe the global epidemiological characteristics of diabetes-related CKD by analyzing data from the publicly available GBD 2021 database. Specifically, we assessed worldwide trends in disease burden from 1990 to 2021, projected forecasts to 2036, and examined differences across countries, regions, sexes, and age groups.
METHODS
Data sources
The data for this study were obtained from the GBD 2021 study, a comprehensive and publicly available database that consistently provides regularly updated global, regional, and national estimates of the burden of diseases, injuries, and risk factors over time. In this analysis, we quantified the burden of T1D-related CKD and T2D-related CKD over the past three decades (from 1990 to 2021) using the Global Health Data Exchange query tool (GHDx, https://vizhub.healthdata.org/gbd-results/). Within the GBD 2021 framework, etiological factors are organized into a four-tier hierarchy, with diabetes-related CKD (T1D-related and T2D-related CKD) classified as a Level 3 condition under non-communicable diseases. Specifically, we extracted data on: (1) the prevalence and mortality rates by location, reported as absolute numbers and age-standardized rates (ASRs) (per 100,000 population) in 2021; (2) the incidence rates by socio-demographic index (SDI) and ASRs (per 100,000 population) from 1990 to 2021; (3) the prevalence, incidence, and mortality rates (per 100,000 population) across sexes within five SDI categories in 2021; and (4) the number of DALYs by super-region in 2021.
Definitions
DALYs quantify the overall burden of disease by reflecting the total years of healthy life lost due to illness, disability, or premature death within a population. Widely used in public health, DALYs enable comparison of the impact of different diseases and conditions. They are calculated as the sum of years of life lost (YLL) due to premature mortality and years lived with disability (YLD), thus providing an integrated measure of health loss in a population[13,14]. YLL is calculated by subtracting the age at death from a standard life expectancy. To ensure comparability across regions and over time, the GBD study applies a fixed standard for life expectancy, thereby avoiding biases related to local variations[15]. YLD is estimated as the product of disability weight and the duration of disability. Disability weights range from 0 (full health) to 1 (death) and reflect the severity of a health condition. These weights are derived from large-scale population surveys and expert consensus. The duration of disability is estimated using epidemiological data (e.g., incidence, remission, and mortality rates), accounting for the natural history of the disease and the effects of interventions[16].
SDI is a summary measure of a population’s social and economic development. It is expressed as a composite score scaled from 0 to 1, with 0 representing the theoretical minimum level of development and 1 representing the theoretical maximum[13,14]. The SDI is calculated as the geometric mean of normalized values for three components: per capita income, mean years of education, and total fertility rate. Based on SDI, countries and regions are stratified into five developmental tiers: low, low-middle, middle, high-middle, and high.
In the GBD 2021 database, diabetes-related CKD was classified using ICD-9 codes (250.4-250.43) and ICD-10 codes (E10.2-E10.29 and E11.2-E11.29). Diabetes was defined as a fasting plasma glucose concentration ≥ 126 mg/dL (≥ 7 mmol/L), or a 2 h post-load glucose concentration ≥ 200 mg/dL (≥ 11.1 mmol/L), or use of any glucose-lowering medication[17]. Diabetes-related CKD, a subtype of CKD attributable to diabetes, was primarily identified by a urinary albumin/creatinine ratio > 30 mg/g and/or an estimated glomerular filtration rate (eGFR) < 60 mL/min/1.73m2.
Statistical analysis
The GBD database provides data on 459 health outcomes and risk factors from 204 countries and territories, as well as numerous subnational locations, allowing for analysis of temporal trends at regional, national, and local levels[18]. Countries were grouped into 21 clusters based on epidemiological indicators and geographical criteria, and further classified into five quintiles according to the SDI[5]. Using the standardized methodology of GBD 2021, we calculated absolute counts and ASRs per 100,000 person-years for three core metrics: (1) period prevalence; (2) annual incidence; and (3) mortality, all reported with 95% uncertainty intervals (UIs) using Monte Carlo simulation techniques. To evaluate temporal trends in the incidence of diabetes-related CKD globally, we estimated age-standardized incidence rates (ASIRs) per 100,000 population, along with corresponding 95%UIs, using joinpoint regression analysis across different SDI levels from 1990 to 2021. Joinpoint regression identifies inflection points in temporal trends over the study period. Forecasting was performed using an autoregressive integrated moving average model, which combines autoregressive and moving average models. This model assumes that the time series data are autocorrelated random variables, allowing future values to be predicted based on historical trends, as described previously[19]. We also performed comparisons across age groups (in 5-year intervals: < 14, 15-19, 20-24, 25-29, 30-34, 35-39, 40-44, 45-49, 50-54, up to > 95 years), sex, and geographic location to estimate the global burden of disease. All statistical analyses were conducted using R software (version 4.2.1).
RESULTS
Global trends and burden of diabetes-related CKD
Epidemiological profiling identified 6 million (95%UI: 5-7 million) globally prevalent cases of T1D-related CKD, with 94,000 (95%UI: 71-119 thousand) attributable deaths in 2021 [Supplementary Table 1]. In comparison, T2D-related CKD affected 107 million individuals (95%UI: 99-115 million), resulting in 477,000 deaths (95%UI: 401-565 thousand) in the same year [Supplementary Table 2]. Within the SDI framework, peak absolute prevalence of T1D-CKD [1.8 million (95%UI: 1.6-2.2 million)] and T2D-CKD [36 million (95%UI: 33-39 million)] was observed in populations with middle SDI levels, following an inverse U-shaped relationship between prevalence and SDI. Mortality patterns mirrored these findings, with middle SDI regions showing the highest deaths for T1D-CKD [42,000 (95%UI: 32-54 thousand)] and T2D-CKD [182,000 (95%UI: 151 to 216 thousand)] [Supplementary Tables 1 and 2]. At the national level, in 2021, T1D-related CKD prevalence was highest in India (1 million; 95%UI: 0.8-1.3), followed by Indonesia (0.5 million; 95%UI: 0.37-0.67) and China (0.49 million; 95%UI: 0.41-0.58) [Supplementary Table 1]. For T2D-related CKD, prevalence was highest in China (20.91 million; 95%UI: 19-22), followed by India (20.83 million; 95%UI: 18-22) [Supplementary Table 2].
Country-level variation in ASRs revealed the highest ASIR for T1D-related CKD in the Russian Federation and for T2D-related CKD in Qatar [Figure 1]. ASIR trends by SDI quintiles showed a gradual increase over time [Figure 2], with both T1D-related CKD and T2D-related CKD peaking in high SDI regions and reaching lowest levels in low SDI regions. Notably, low SDI regions exhibited periods of stagnation, while all other SDI quintiles showed progressive increases, albeit at varying rates. For T1D-related CKD, the middle SDI quintile showed a notable ASIR increase from 1.10 (95%UI: 0.83-1.47) to 1.35 (95%UI: 1.06-1.72), while the low SDI quintile showed minimal temporal changes, ranging from 0.95 (95%UI: 0.65-1.42) to 1.10 (95%UI: 0.78-1.56) between 1990 and 2021 [Figure 2A]. For T2D-related CKD, the middle SDI quintile experienced the largest ASIR increase from 17.13 (95%UI: 15.38-18.97) to 22.95 (95%UI: 21.15-24.58), whereas the high SDI quintile exhibited the smallest change, from 25.59 (95%UI: 23.30-27.81) to 28.34 (95%UI: 26.19-30.30) [Figure 2B]. Globally, T1D-related CKD ASIR increases from 1990 to 2021 but is projected to decline from 2021 to 2036 [Figure 3A]. In contrast, T2D-related CKD ASIR is projected to increase steadily from 1990 to 2036 [Figure 3B].
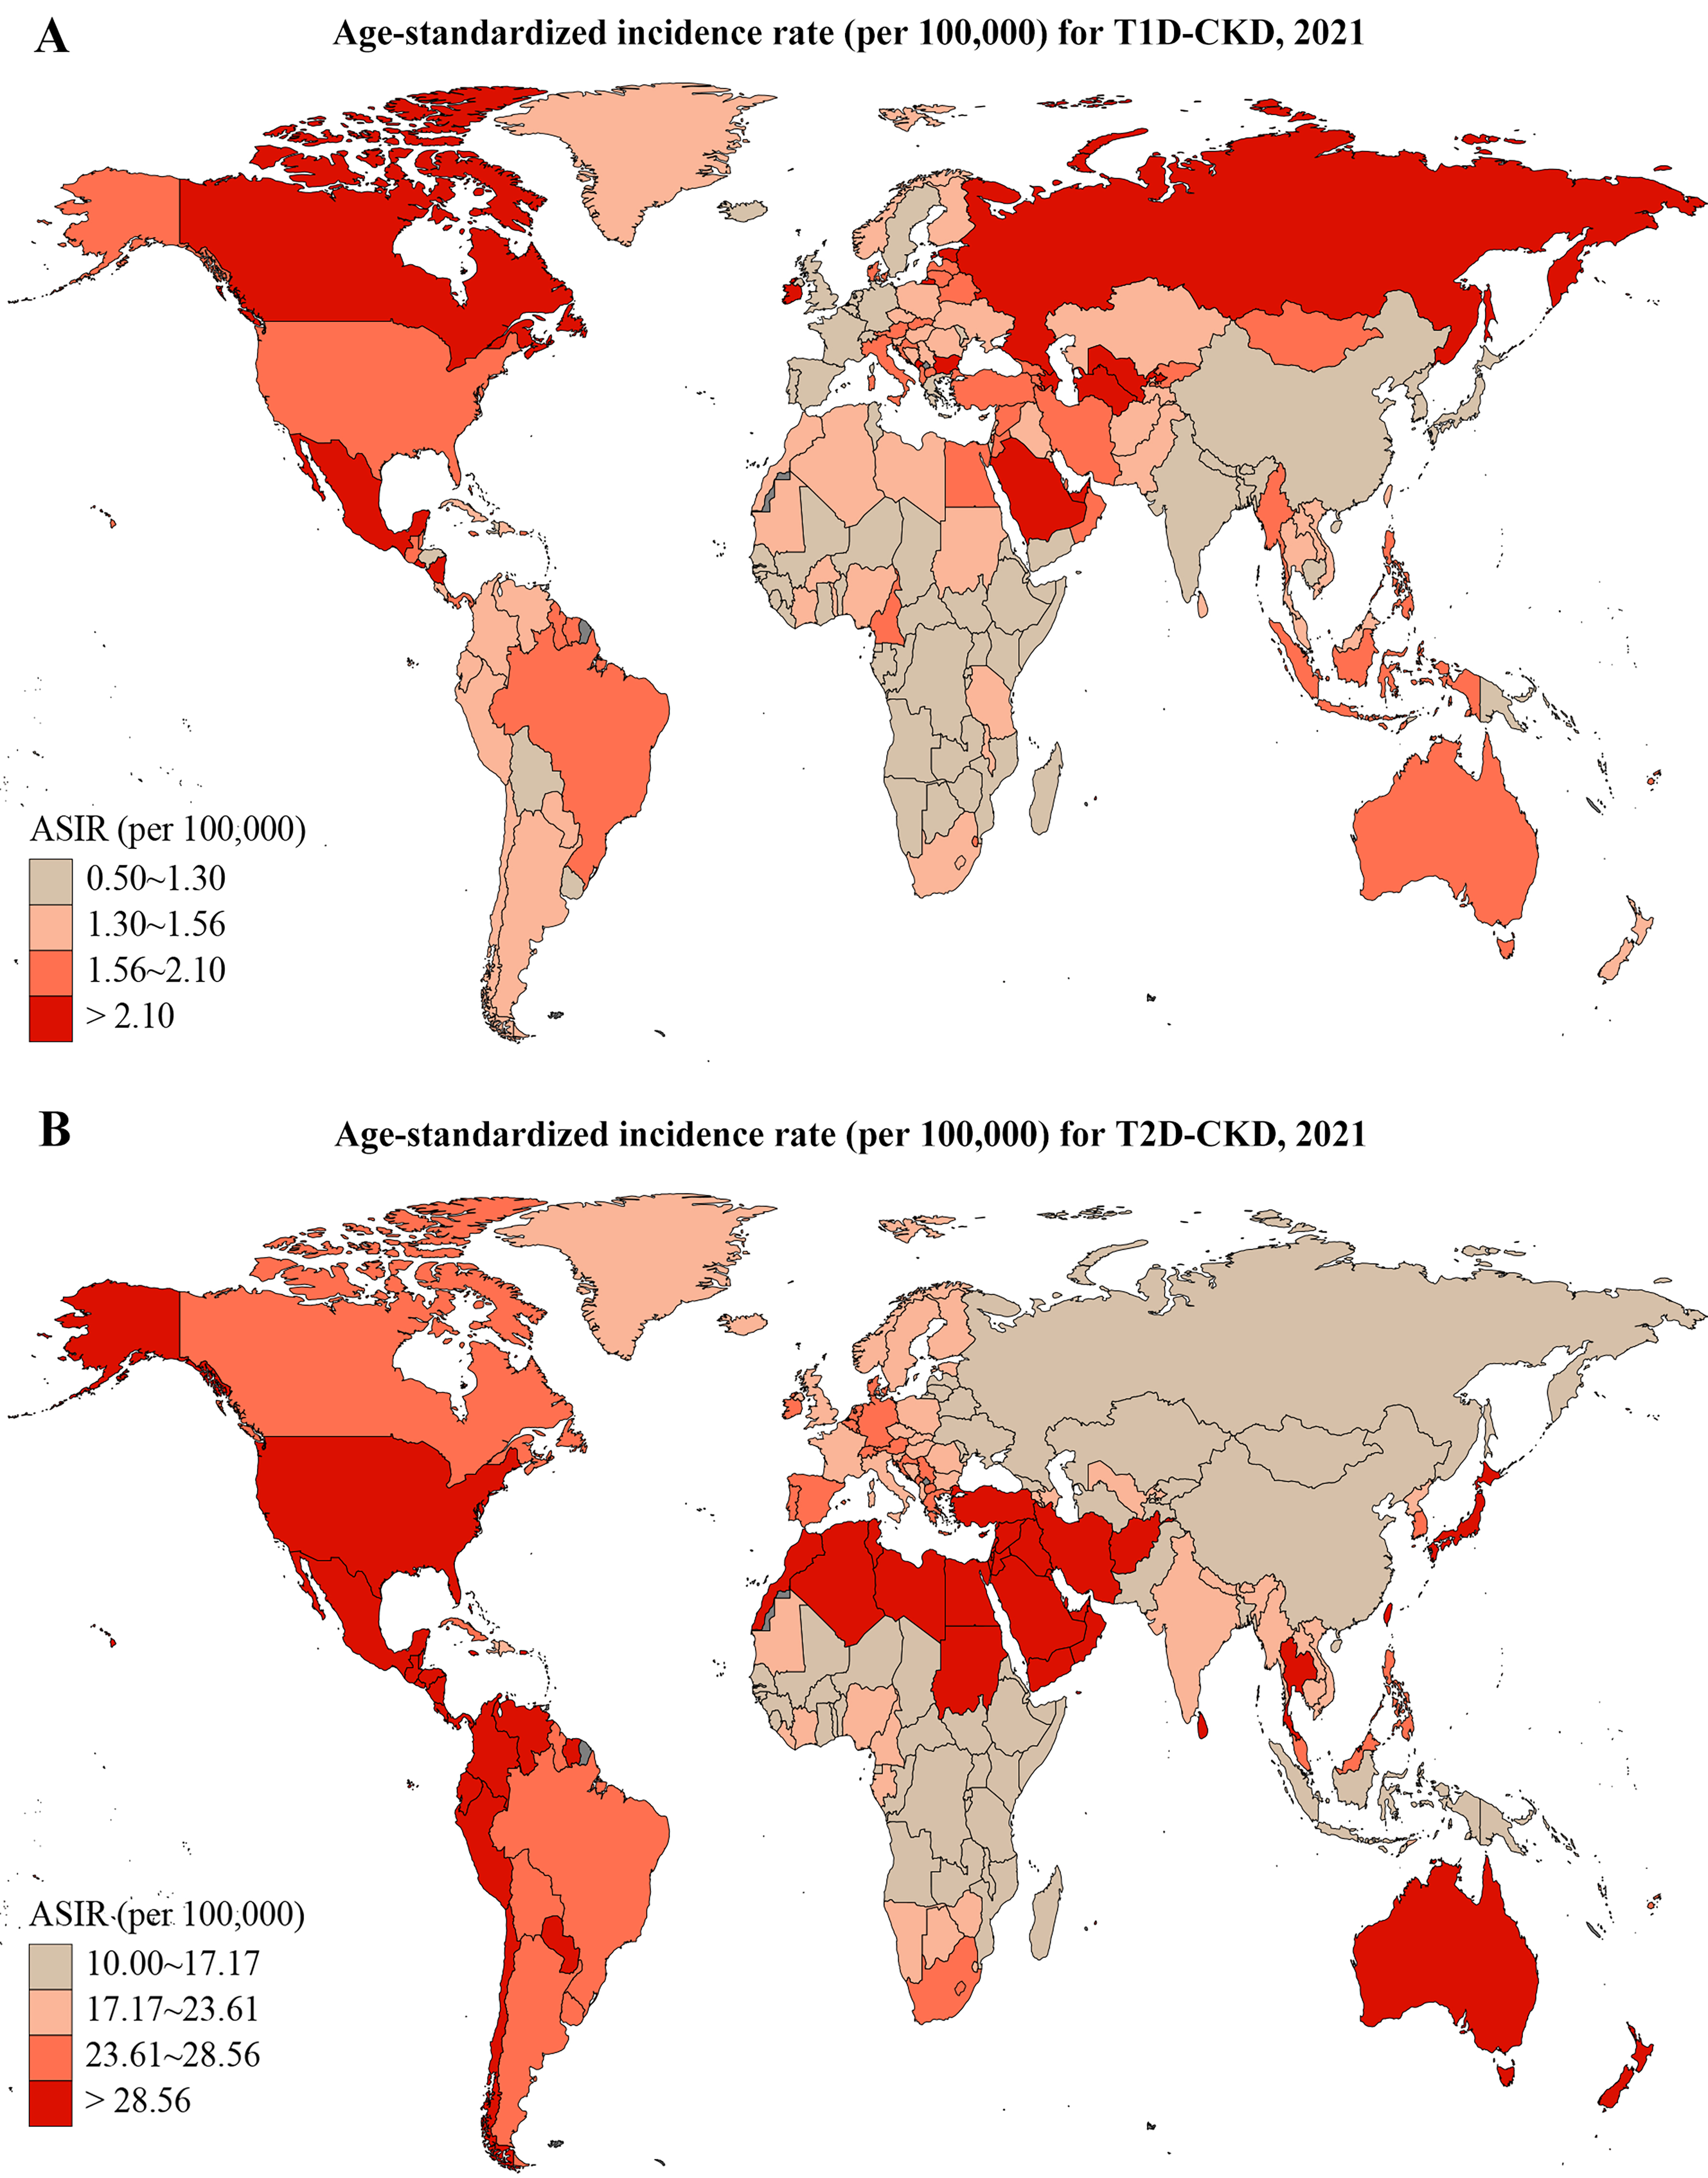
Figure 1. Global ASIR of T1D-related CKD (A) and T2D-related CKD (B) in 2021. T1D-CKD: Type 1 diabetes-related CKD; T2D-CKD: type 2 diabetes-related CKD; ASIR: age-standardized incidence rate; CKD: chronic kidney disease.
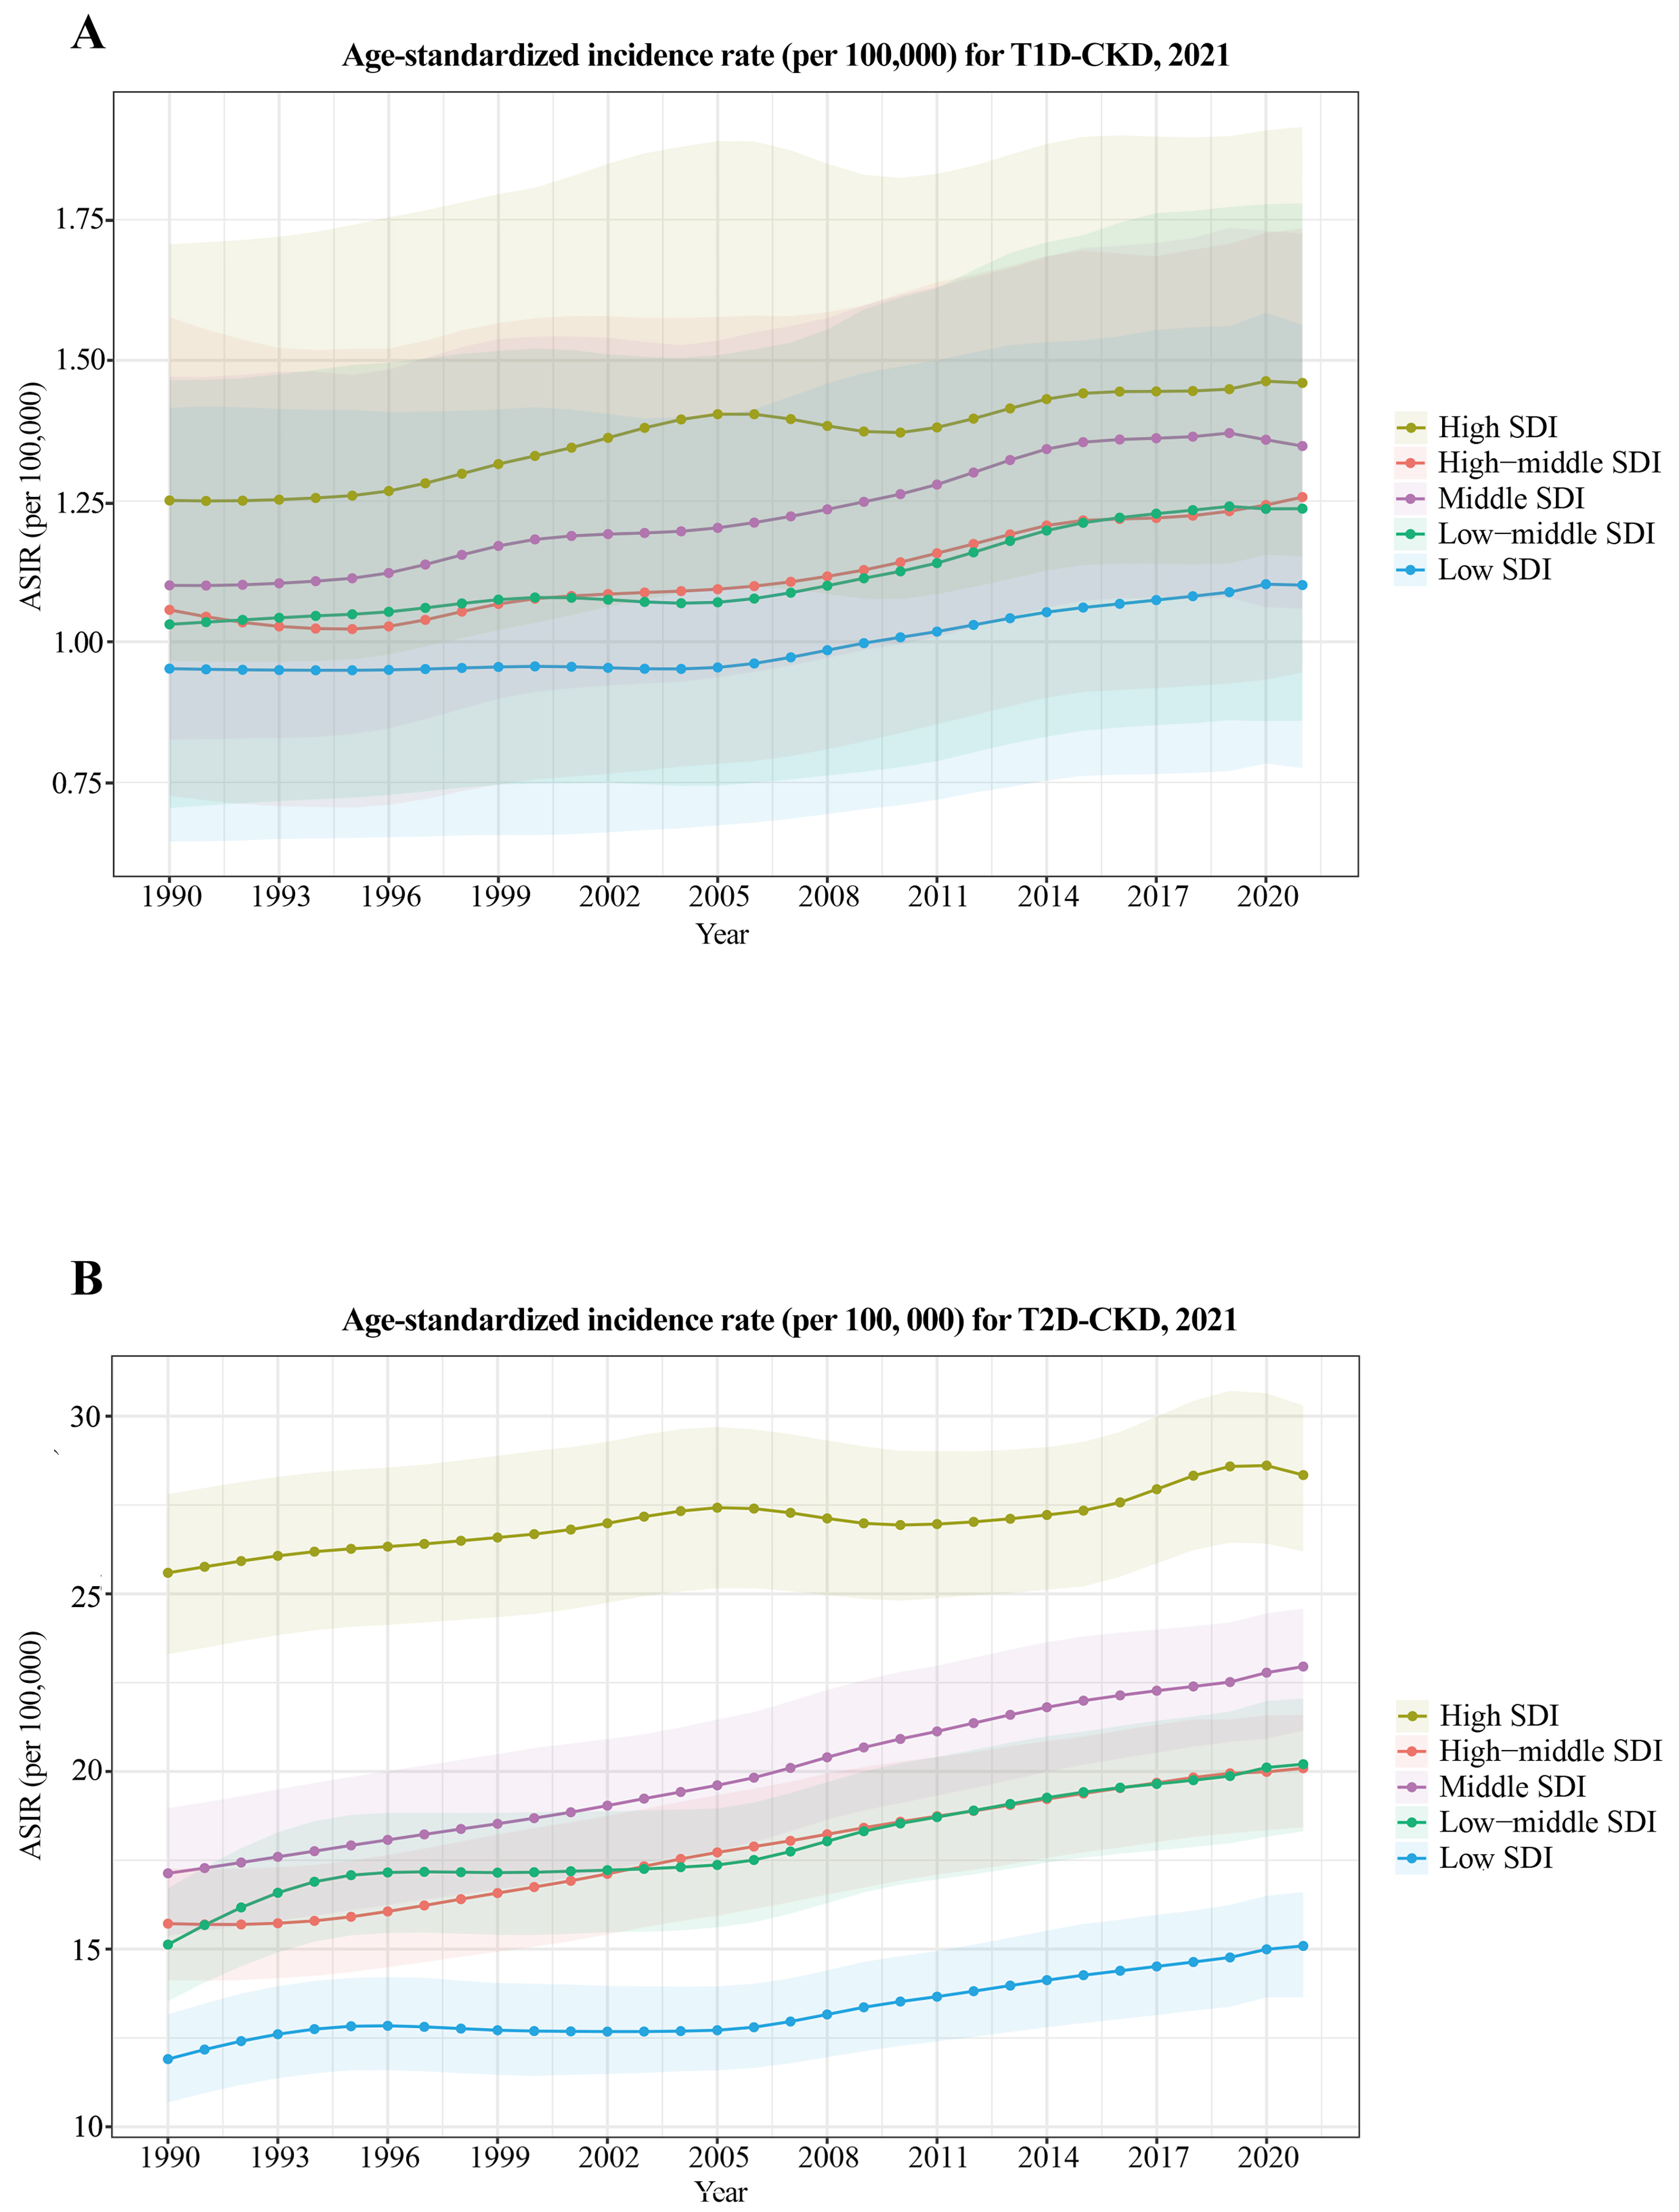
Figure 2. ASIR of T1D-related CKD (A) and T2D-related CKD (B) by SDI quintiles, 1990-2021. T1D-CKD: Type 1 diabetes-related CKD; T2D-CKD: type 2 diabetes-related CKD; SDI: socio-demographic index; ASIR: age-standardized incidence rate; CKD: chronic kidney disease.
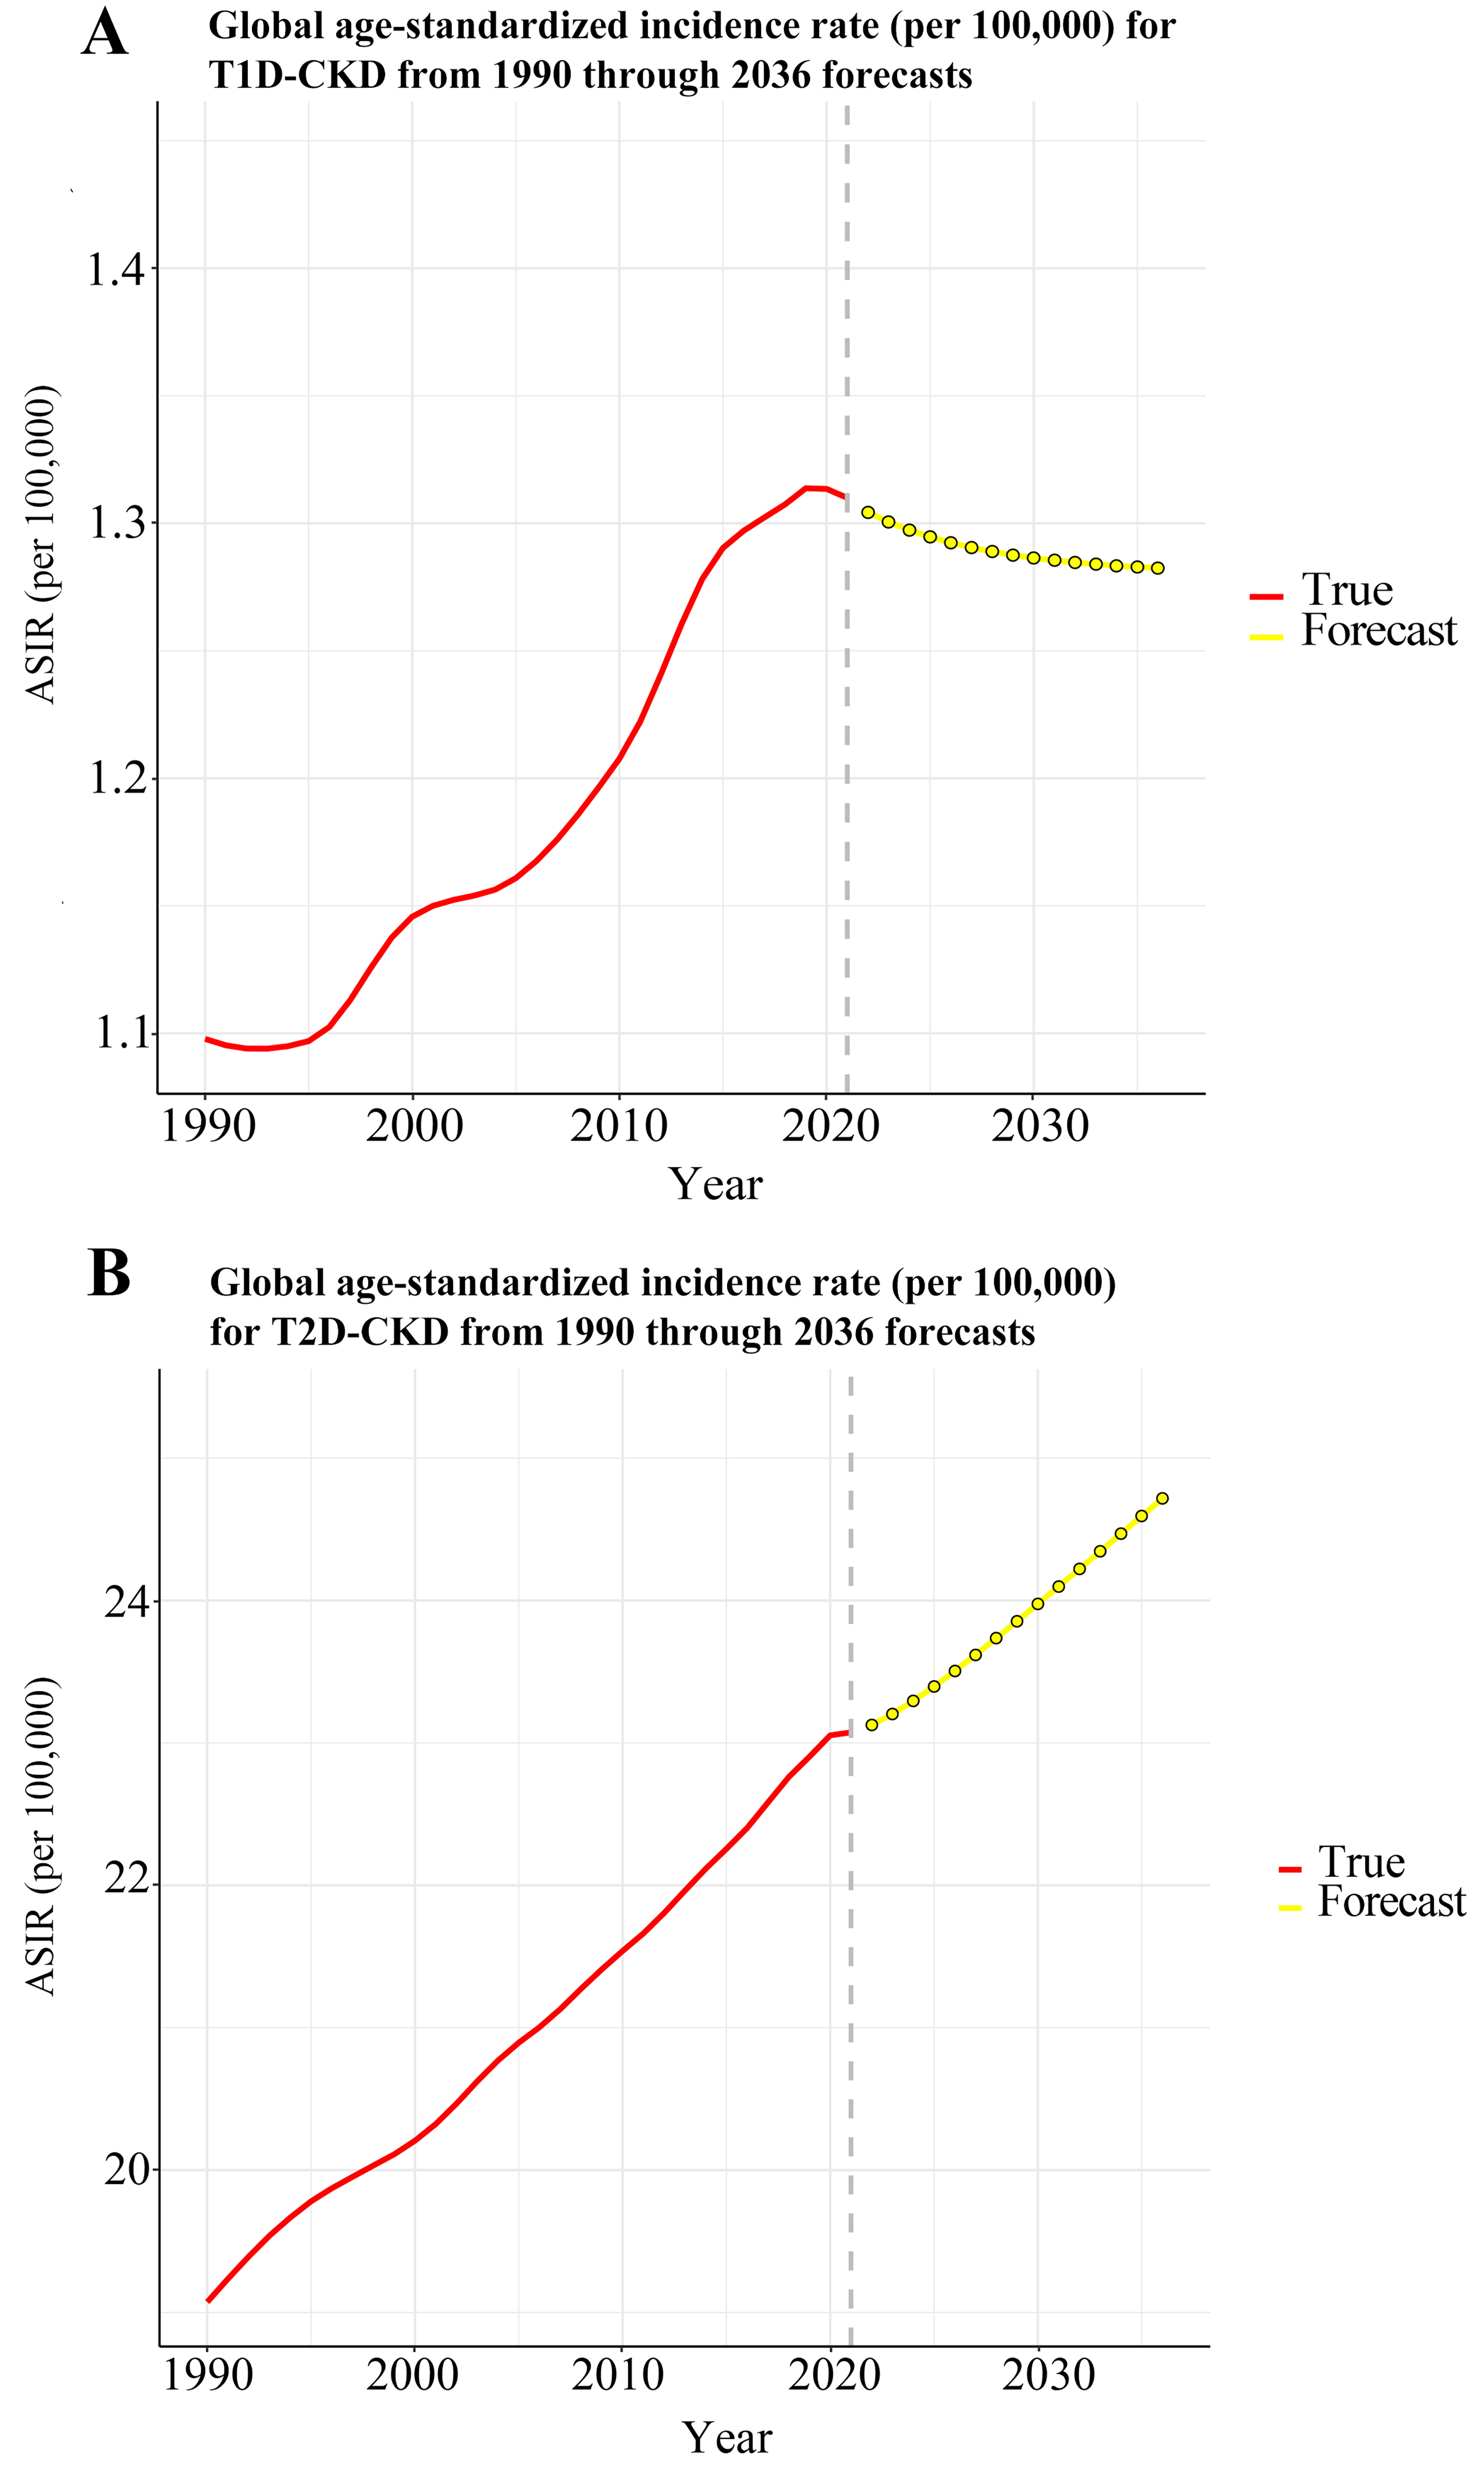
Figure 3. Global ASIR of T1D-related CKD (A) and T2D-related CKD (B) from 1990 to 2036 (observed and forecasted). T1D-CKD: Type 1 diabetes-related CKD; T2D-CKD: type 2 diabetes-related CKD; ASIR: age-standardized incidence rate; CKD: chronic kidney disease.
Burden of diabetes-related CKD by region and age
In 2021, the global burden of diabetes-related CKD showed considerable age-specific variation [Figure 4A]. For T1D-related CKD, DALYs peaked at 624,000 (95%UI: 372-914 thousand) in individuals aged 50-54 years. In this age group, DALYs were highest in Southeast Asia, East Asia, and Oceania [276,000 (95%UI: 166-387 thousand)] and lowest in Central Europe, Eastern Europe, and Central Asia [11,000 (95%UI: 7-16 thousand)] [Figure 4A]. For T2D-related CKD, DALYs peaked at 1.7 million (95%UI: 1.3 to 2.1 million) in the 65-69 age group. The highest T2D-related CKD burden occurred in Southeast Asia, East Asia, and Oceania, while the lowest was observed in Central Europe, Eastern Europe, and Central Asia [695,000 (95%UI: 537-855 thousand) vs. 37,000 (95%UI: 25-50 thousand)]. Except in high-income regions, where DALYs peaked at 70-74 years, all other super-regions peaked at 65-69 years. Notably, the high-income super-region had the highest DALYs in individuals older than 85 years [Figure 4B].
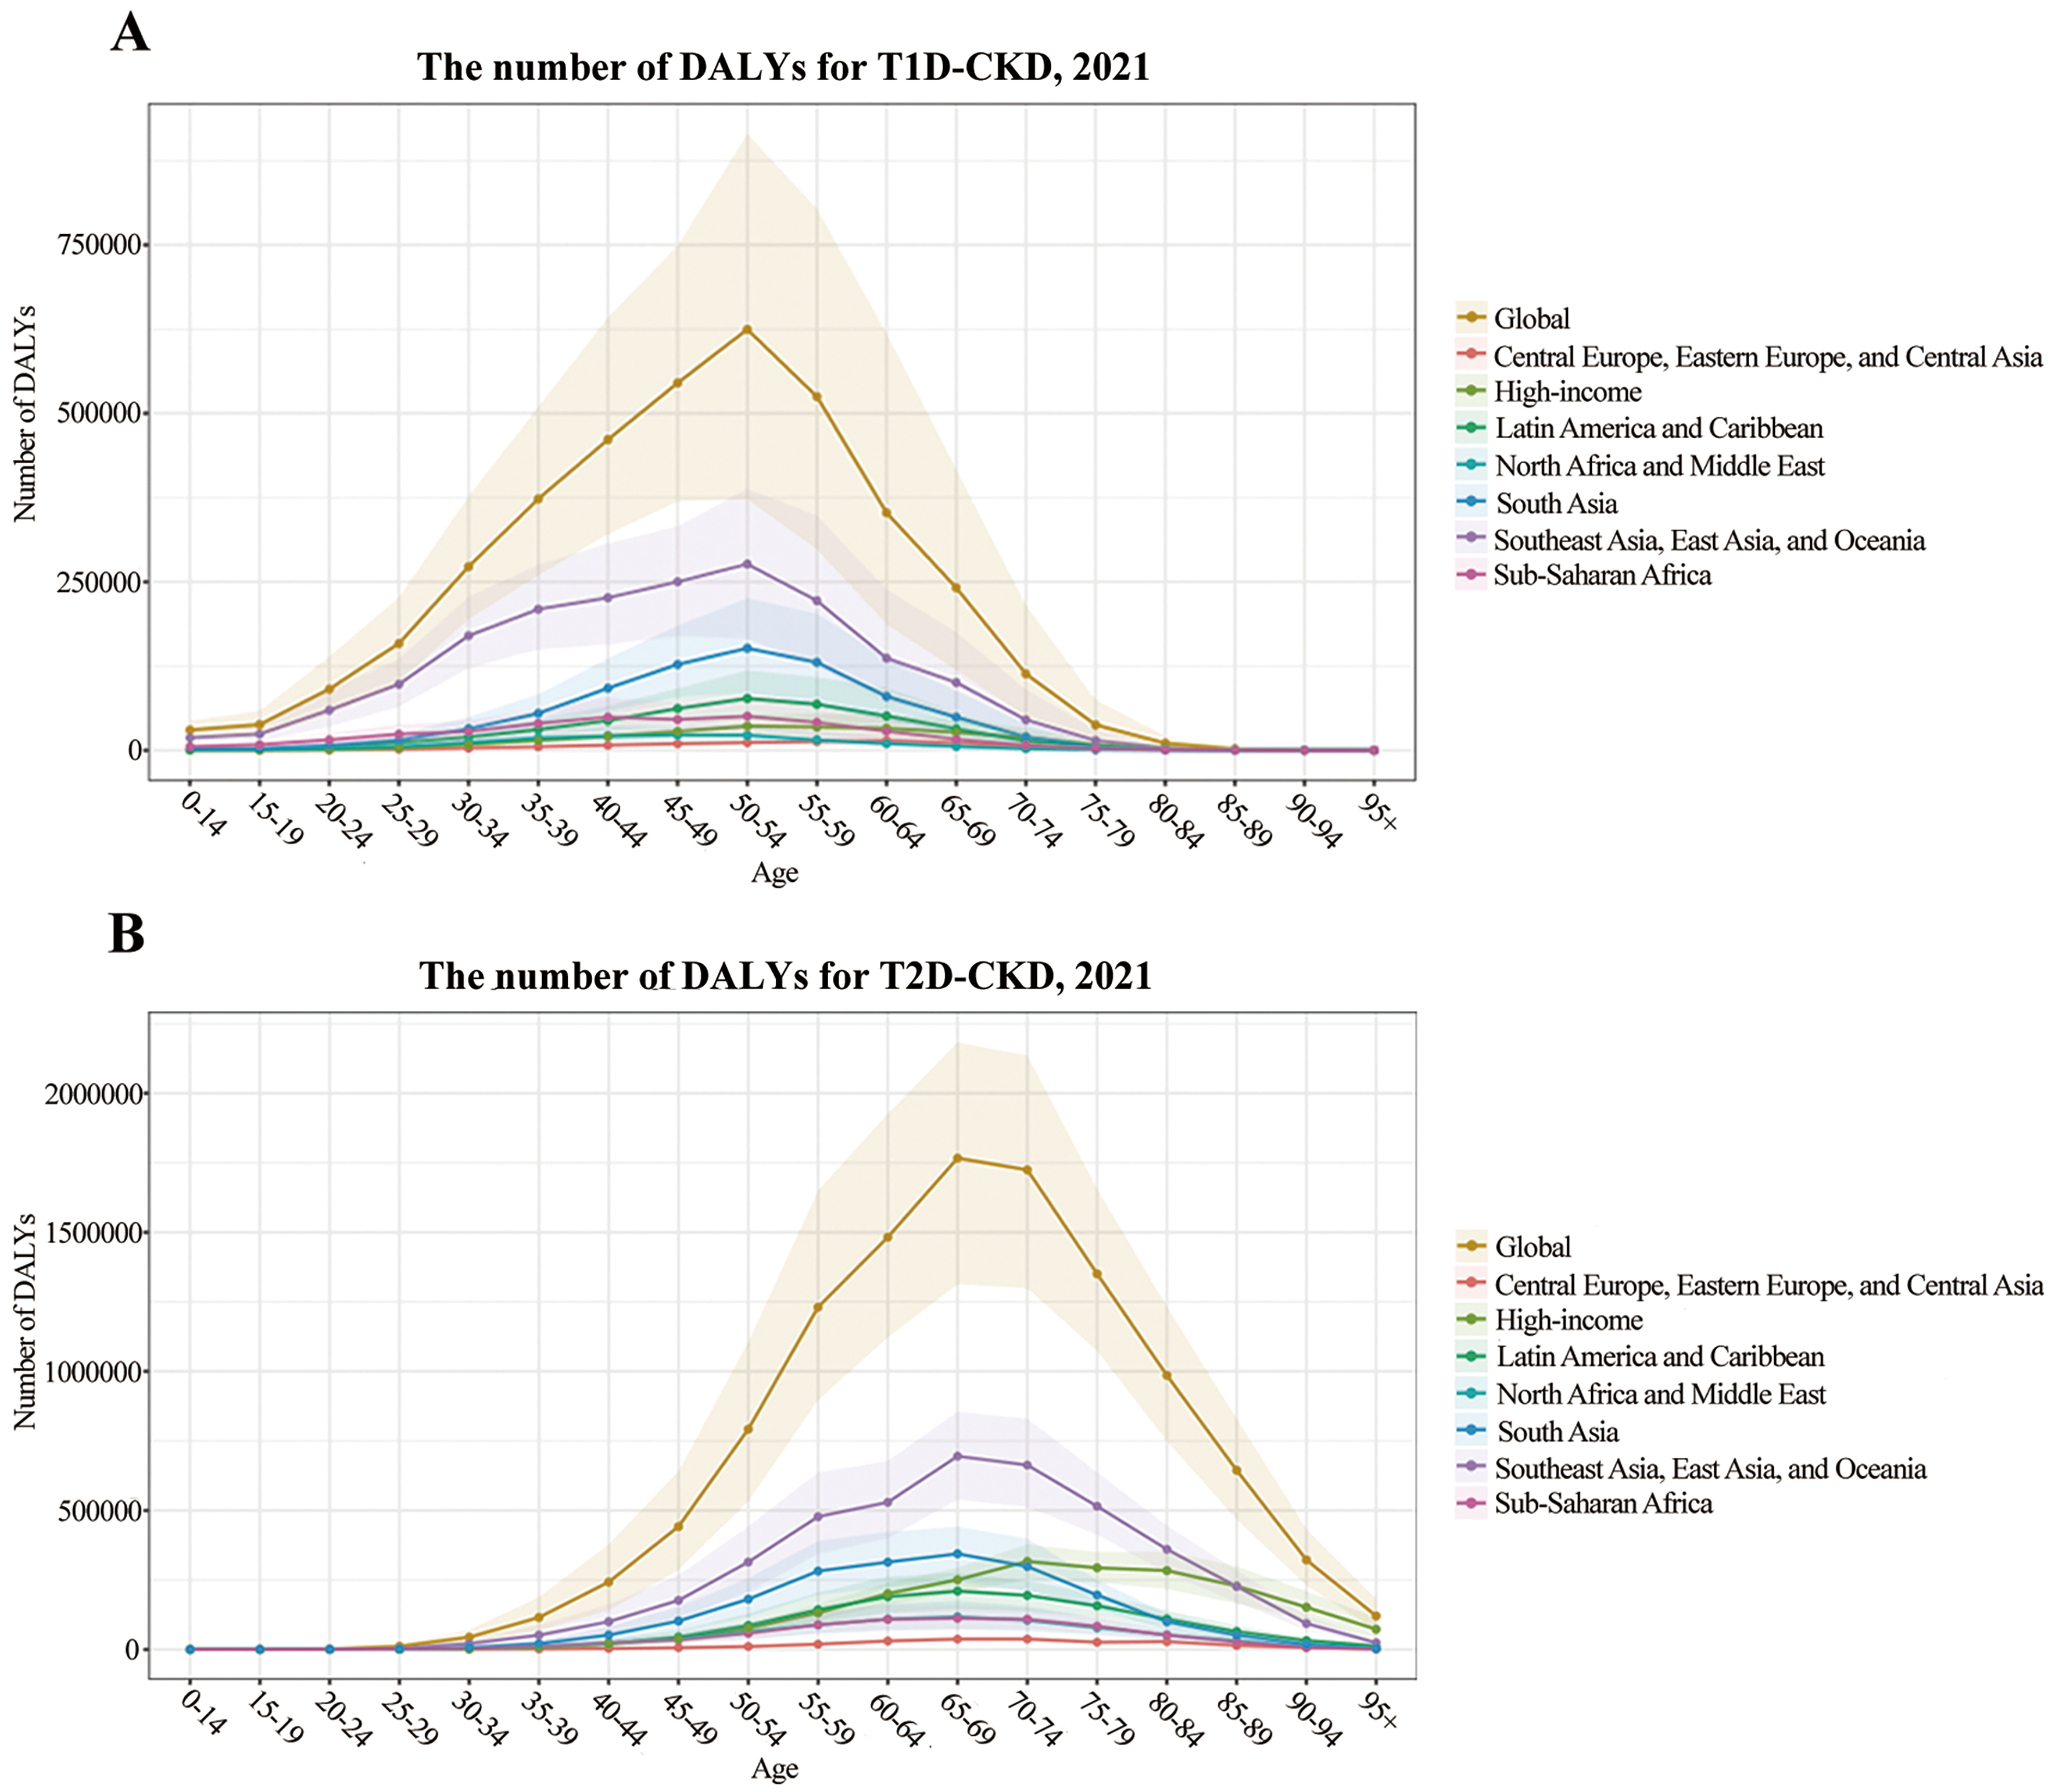
Figure 4. Number of DALYs due to T1D-related CKD (A) and T2D-related CKD (B) by age group and super-region in 2021. T1D-CKD: Type 1 diabetes-related CKD; T2D-CKD: type 2 diabetes-related CKD; DALYs: disability-adjusted life years; CKD: chronic kidney disease.
Sex and age differences in diabetes-related CKD by SDI levels
In 2021, global incidence and death rates of T1D-related CKD were higher in males, whereas prevalence was higher in females [Figure 5]. By SDI level, incidence was highest and death rates lowest in the high SDI quintile [Figure 5A and C]. Due to its early onset, T1D-related CKD incidence was most prominent in the 0-14 age group [Figure 5A]. Prevalence peaks varied by sex: in females, it was highest at 20-29 years (low SDI: 30-34 years), and in males, at 40-49 years (high-middle SDI: 20-24 years) [Figure 5B]. Death from T1D-related CKD mainly occurred in middle-aged and older adults (55-69 years) [Figure 5C]. For T2D-related CKD in 2021, global incidence, prevalence, and death rates were higher in males [Figure 6]. Incidence was particularly pronounced in older people (70-84 years), with males showing higher susceptibility. The high SDI quintile had the highest incidence, peaking at 80-84 years [Figure 6A], whereas prevalence was highest in the low-middle SDI quintile and deaths peaked in the middle SDI quintile
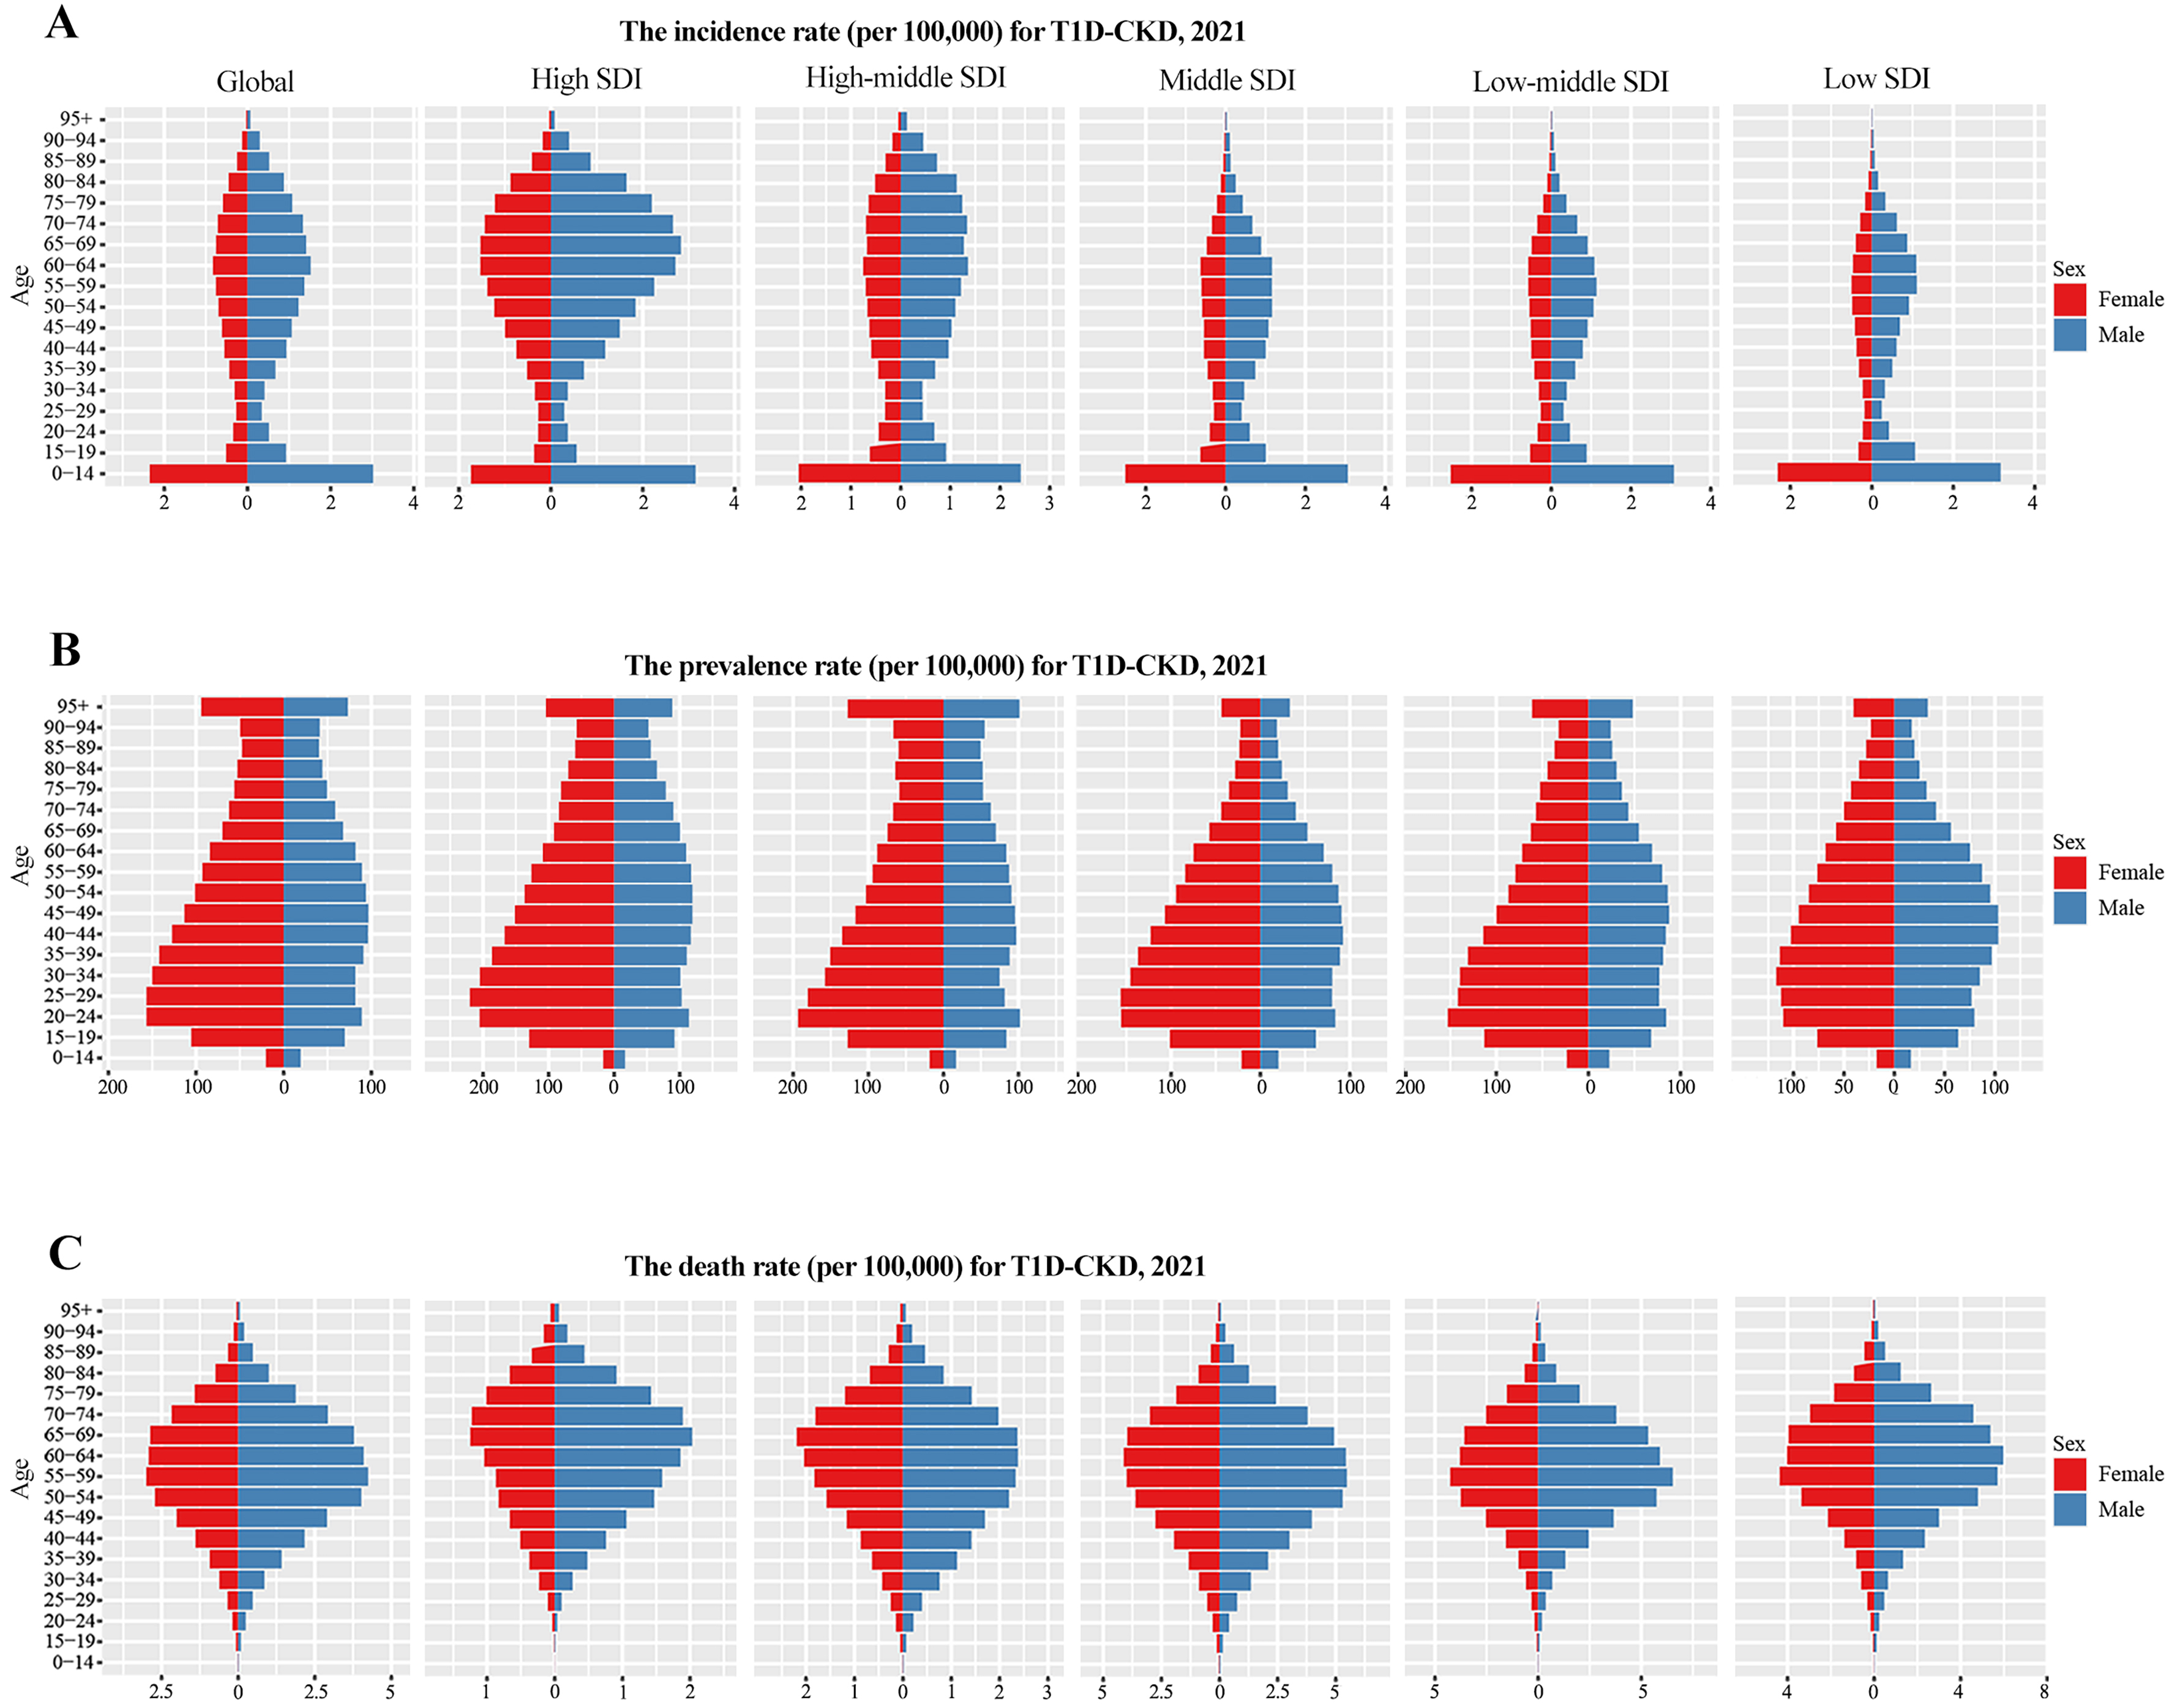
Figure 5. Incidence (A), prevalence (B), and mortality (C) rates of T1D-related CKD from 1990 to 2021 across different age groups and SDI areas. T1D-CKD: Type 1 diabetes-related CKD; SDI: socio-demographic index; CKD: chronic kidney disease.
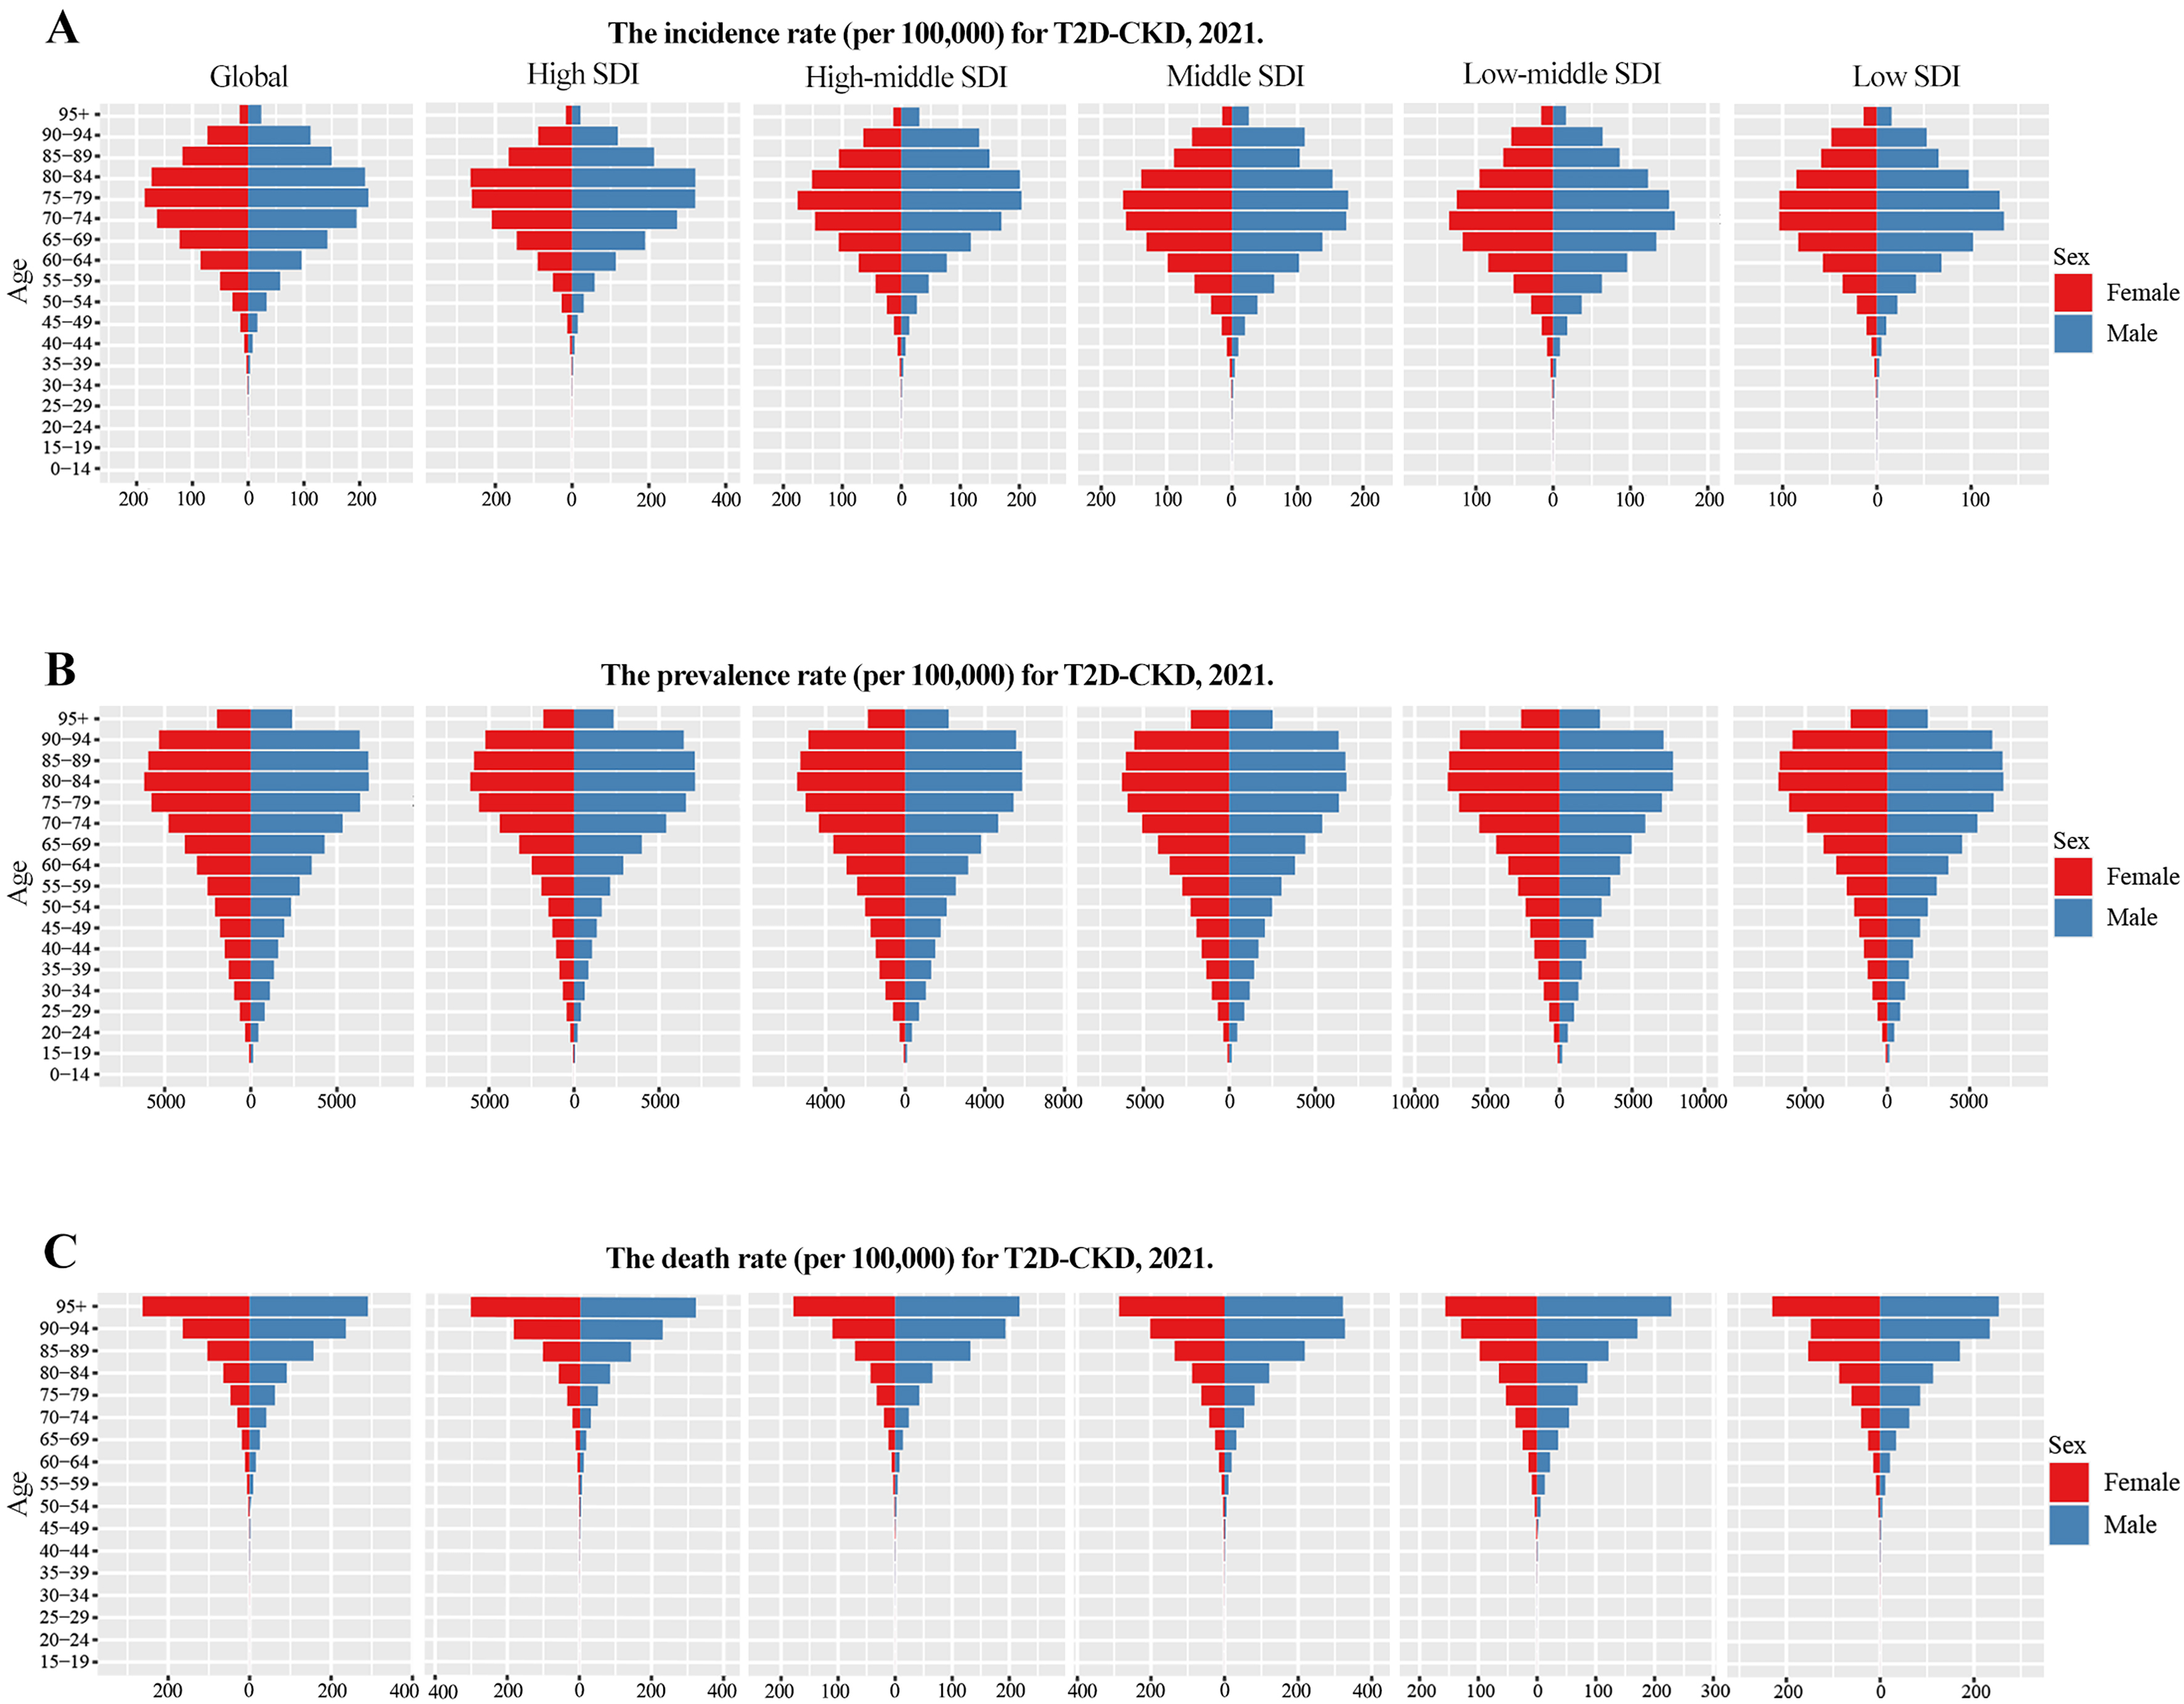
Figure 6. Incidence (A), prevalence (B), and mortality (C) rates of T2D-related CKD from 1990 to 2021 across different age groups and SDI areas. T2D-CKD: Type 2 diabetes-related CKD; SDI: socio-demographic index; CKD: chronic kidney disease.
DISCUSSION
Diabetes accounts for the majority of CKD cases, and its prevalence continues to rise steadily. Current projections estimate that 1.3 billion individuals will develop diabetes by 2050, highlighting the potential for an escalating burden of diabetes-related CKD[1]. Moreover, the burden of diabetes-related CKD varies considerably across geographic regions, particularly in middle SDI quintiles between 1990 and 2019, with elevated systolic blood pressure and increased body mass index (BMI) emerging as the main population-attributable risk factors[9,20,21]. Using the updated GBD 2021 database, our study provides a comprehensive reassessment of the global burden of T1D- and T2D-related CKD, complementing prior studies[22]. In 2021, there were globally 113 million prevalent cases, 2.1 million incident cases, and 0.57 million deaths due to diabetes-related CKD.
Across all SDI quintiles, the ASIRs of both T1D- and T2D-related CKD have increased steadily over the past three decades (1990-2021), driven by demographic aging and the rising prevalence of obesity. High SDI countries exhibited higher incidence rates of diabetes-related CKD than other regions, likely due to increasing diabetes prevalence, population growth, aging, and sustained increases in obesity, all contributing to the rising global burden. Conversely, mortality from T1D- and T2D-related CKD was lower in high SDI countries, likely reflecting greater healthcare access, higher educational levels, increased disease awareness, and more effective treatment options. Our analysis indicates that the prevalence, incidence, and DALYs of T1D-related CKD and T2D-related CKD in middle SDI countries, Southeast Asia, East Asia, and the Oceania super-region contribute significantly to the overall global CKD burden. India, with rapid population growth making it the world’s second most populous country, exemplifies this trend. Genetic predisposition in South Asian populations, including Indians, promotes visceral fat accumulation and insulin resistance at lower BMI thresholds, increasing the risk of diabetes and related complications even in younger and leaner individuals[22]. India has the highest prevalence of diabetes among Asian countries, with peak incidence occurring nearly a decade earlier than in Chinese and Japanese populations[23]. Moreover, the incidence and progression of diabetes-related CKD are significantly higher in South Asians with T2D compared to Dutch-European cohorts, indicating a genetic susceptibility in Indians[24]. While the global diabetes pandemic is largely centered in India, high SDI countries exhibit the highest ASIR. Notably, HLA-DR3 and HLA-DR4 genotypes strongly increase the risk of T1D, accounting for 40%-50% of familial clustering, with the highest carrier frequency observed in Northern European populations[25].
GBD 2021 data also indicate that elevated BMI and systolic hypertension are the predominant modifiable risk factors for T2D-CKD progression, consistent with previous GBD analyses[20]. The prevalence of microalbuminuria increases with BMI, ranging from 9.5% in normal-weight individuals to 29.3% in obese males, highlighting adiposity-driven nephropathy[26]. Similarly, Framingham Heart Study data demonstrate that obesity is significantly associated with increased CKD risk[27]. Hypertension remains a critical comorbidity in diabetes-related CKD and an established risk factor for ESRD; effective management can slow disease progression[28,29]. However, an Indonesian study found that only 36.2% of hypertensive participants received anti-hypertensive prescriptions, and only 21.7% adhered to therapy[30]. Therefore, controlling blood glucose, body weight, and blood pressure is essential for preventing or slowing diabetes-related CKD progression.
Our analysis further revealed that global prevalence, incidence, and mortality rates of diabetes-related CKD are higher in males than in females, likely reflecting hormonal, genetic, and lifestyle factors[31,32]. Males tend to accumulate more visceral fat and have lower insulin sensitivity, contributing to higher T2D prevalence. Postmenopausal females, however, experience increased risk due to declining estrogen levels, which promote abdominal fat redistribution and insulin resistance, narrowing sex differences in later life[33]. Additional factors, such as differences in muscle mass and protein intake, may also play a role[34]. Sex-specific analyses indicate faster progression to ESRD in males, potentially linked to androgen-mediated overexpression in renal fibroblasts. Premenopausal estrogen confers renal protection through modulation of oxidative stress, fibrosis markers[35], the renin-angiotensin system, and proinflammatory pathways, but its loss after menopause accelerates CKD progression in females, reducing the sex-based gap in outcomes[11].
Ethnic and racial disparities also influence diabetes-related CKD risk[36,37]. Socioeconomic status can further affect diabetes development, particularly in female[38]. South Asians have higher prevalence, faster progression, and earlier onset of diabetes-related CKD compared to White Europeans and Afro-Caribbean individuals with T2D[39]. African Americans also experience higher kidney disease rates, with APOL1 G1 and G2 variants contributing to non-diabetic CKD risk and potentially exacerbating diabetes-related nephropathy under hyperglycemic conditions[40].
Our findings suggest that the global CKD burden could be mitigated through coordinated diabetes-related CKD prevention, screening, treatment, and rehabilitation. GBD data enable subnational quantification of prevalence, incidence, mortality, and DALYs, supporting evidence-based policymaking. Interventions such as community-based diabetes awareness campaigns, promotion of healthy diets (e.g., reduced sodium and increased plant-based foods), regular physical activity, and routine medical check-ups could reduce diabetes, hypertension, and diabetes-related CKD. Comparative analyses across demographic groups (ethnicity, sex, age) reveal systemic inequities and guide policies targeting vulnerable populations. Strengthening healthcare infrastructure, increasing specialized provider availability, and improving access to treatments, including affordable SGLT2 inhibitors, are crucial in high-prevalence regions like India and Indonesia. Cross-national collaborations can harmonize guidelines and share best practices in nephropathy management.
However, our study has inherent limitations associated with the GBD database. First, in regions with weak CKD surveillance, particularly low-income countries and marginalized populations, estimates rely on statistical modeling, predictive covariates, and meta-regression of limited primary data. While these methods enhance global comparability, they may obscure local epidemiological details. Second, determining CKD etiology remains a key challenge. GBD algorithms rely on ICD coding, clinical assumptions, and probabilistic redistribution of unspecified nephropathy cases, which may inadequately account for comorbid conditions such as hypertension, obesity, and cardiovascular disease. Third, heterogeneity in eGFR introduces systematic bias. Despite standardization (e.g., < 60 mL/min/1.73m2 for CKD staging), formula selection and race-adjusted coefficients vary, and creatinine assay standardization is inconsistent, particularly in resource-limited regions. Consequently, CKD prevalence may be overestimated in populations with high muscle mass or underestimated in elderly or sarcopenic individuals[41,42].
In conclusion, analysis of GBD data indicates that the global prevalence, incidence, and mortality of diabetes-related CKD have increased over the past three decades (1990-2021), with notable variations by region, SDI, sex, and ethnicity. Males generally experience higher rates, and the highest SDI quintile is associated with the highest ASIR. Asian countries, particularly India and China, bear the heaviest burden. Projections suggest that the ASIR of T2D-related CKD will continue to rise, whereas T1D-related CKD is expected to gradually decline from 2021 to 2036.
DECLARATIONS
Authors’ contributions
Project administration: Sun DQ, Zheng MH
Funding acquisition: Sun DQ, Targher G, Byrne CD
Supervision: Sun DQ, Zheng MH
Conceptualization: Sun DQ, Zheng MH
Writing - original draft: Chen WY
Visualization: Chen WY, Liu WY
Data curation: Liu WY, Zhang JH
Writing - review and editing: Targher G, Byrne CD, Misra A, Lonardo A
Availability of data and materials
Global Burden of Disease (GBD) study 2021 data resources are publicly available online through the Global Health Data Exchange (GHDx) query tool (http://ghdx.healthdata.org/gbd-results-tool).
Financial support and sponsorship
Sun DQ is supported in part by grants from the Top Talent Support Program for Young and Middle-Aged People of Wuxi Health Committee (BJ2023023), the Taihu Light Scientific and Technology Research Project (Y2032011), and the China Postdoctoral Science Foundation (2023M732681). Byrne CD is supported in part by the Southampton NIHR Biomedical Research Centre (NIHR 203319), UK. Targher G is supported in part by grants from the University School of Medicine of Verona, Italy.
Conflicts of interest
Targher G and Byrne CD are Honorary Editors-in-Chief of the journal Metabolism and Target Organ Damage. Lonardo A is the Editor-in-Chief & Founding Editor, Zheng MH is an Editorial Board member, and Sun DQ is a Junior Editorial Board member of the same journal. They were not involved in any steps of the editorial process for this manuscript, including reviewer selection, manuscript handling, or decision making. The other authors declared that there are no conflicts of interest.
Ethical approval and consent to participate
This study utilized publicly available data from the GBD 2021 Study conducted by the Institute for Health Metrics and Evaluation. As all data are de-identified and openly accessible, no additional ethical approval was required.
Consent for publication
Not applicable.
Copyright
© The Author(s) 2025.
Supplementary Materials
REFERENCES
1. 2021 Diabetes Collaborators. Global, regional, and national burden of diabetes from 1990 to 2021, with projections of prevalence to 2050: a systematic analysis for the Global Burden of Disease Study 2021. Lancet. 2023;402:203-34.
2. Katsarou A, Gudbjörnsdottir S, Rawshani A, et al. Type 1 diabetes mellitus. Nat Rev Dis Primers. 2017;3:17016.
4. Dong Z, Wang X, Pan S, et al. A multimodal transformer system for noninvasive diabetic nephropathy diagnosis via retinal imaging. NPJ Digit Med. 2025;8:50.
5. Chronic Kidney Disease Collaboration. Global, regional, and national burden of chronic kidney disease, 1990-2017: a systematic analysis for the Global Burden of Disease Study 2017. Lancet. 2020;395:709-33.
6. Gupta S, Dominguez M, Golestaneh L. Diabetic kidney disease: an update. Med Clin North Am. 2023;107:689-705.
7. Carlsson LM, Romeo S, Jacobson P, et al. The incidence of albuminuria after bariatric surgery and usual care in Swedish Obese Subjects (SOS): a prospective controlled intervention trial. Int J Obes. 2015;39:169-75.
8. Yim HE, Yoo KH. Obesity and chronic kidney disease: prevalence, mechanism, and management. Clin Exp Pediatr. 2021;64:511-8.
9. Deng Y, Li N, Wu Y, et al. Global, regional, and national burden of diabetes-related chronic kidney disease from 1990 to 2019. Front Endocrinol. 2021;12:672350.
10. Piani F, Melena I, Tommerdahl KL, et al. Sex-related differences in diabetic kidney disease: a review on the mechanisms and potential therapeutic implications. J Diabetes Complications. 2021;35:107841.
11. Giandalia A, Giuffrida AE, Gembillo G, et al. Gender differences in diabetic kidney disease: focus on hormonal, genetic and clinical factors. Int J Mol Sci. 2021;22:5808.
12. Liu W, Zhang D, Wang R, et al. Global trends in the burden of chronic kidney disease attributable to type 2 diabetes: an age-period-cohort analysis. Diabetes Obes Metab. 2024;26:602-10.
13. Dai H, Alsalhe TA, Chalghaf N, Riccò M, Bragazzi NL, Wu J. The global burden of disease attributable to high body mass index in 195 countries and territories, 1990-2017: an analysis of the Global Burden of Disease Study. PLoS Med. 2020;17:e1003198.
14. 2017 Risk Factor Collaborators. Global, regional, and national comparative risk assessment of 84 behavioural, environmental and occupational, and metabolic risks or clusters of risks for 195 countries and territories, 1990-2017: a systematic analysis for the Global Burden of Disease Study 2017. Lancet. 2018;392:1923-94.
15. 2019 Demographics Collaborators. Global age-sex-specific fertility, mortality, healthy life expectancy (HALE), and population estimates in 204 countries and territories, 1950-2019: a comprehensive demographic analysis for the Global Burden of Disease Study 2019. Lancet. 2020;396:1160-203.
16. 2017 Disease and Injury Incidence and Prevalence Collaborators. Global, regional, and national incidence, prevalence, and years lived with disability for 354 diseases and injuries for 195 countries and territories, 1990-2017: a systematic analysis for the Global Burden of Disease Study 2017. Lancet. 2018;392:1789-858.
17. Xie J, Wang M, Long Z, et al. Global burden of type 2 diabetes in adolescents and young adults, 1990-2019: systematic analysis of the Global Burden of Disease Study 2019. BMJ. 2022;379:e072385.
18. 2019 Diseases and Injuries Collaborators. Global burden of 369 diseases and injuries in 204 countries and territories, 1990-2019: a systematic analysis for the Global Burden of Disease Study 2019. Lancet. 2020;396:1204-22.
19. Li Y, Ning Y, Shen B, et al. Temporal trends in prevalence and mortality for chronic kidney disease in China from 1990 to 2019: an analysis of the Global Burden of Disease Study 2019. Clin Kidney J. 2023;16:312-21.
20. Xie D, Ma T, Cui H, et al. Global burden and influencing factors of chronic kidney disease due to type 2 diabetes in adults aged 20-59 years, 1990-2019. Sci Rep. 2023;13:20234.
21. Wang Y, Lin T, Lu J, et al. Trends and analysis of risk factor differences in the global burden of chronic kidney disease due to type 2 diabetes from 1990 to 2021: a population-based study. Diabetes Obes Metab. 2025;27:1902-19.
22. Unnikrishnan R, Anjana RM, Mohan V. Diabetes in South Asians: is the phenotype different? Diabetes. 2014;63:53-5.
23. Qiao Q, Hu G, Tuomilehto J, et al; DECODA Study Group. Age- and sex-specific prevalence of diabetes and impaired glucose regulation in 11 Asian cohorts. Diabetes Care. 2003;26:1770-80.
24. Chandie Shaw PK, Baboe F, van Es LA, et al. South-Asian type 2 diabetic patients have higher incidence and faster progression of renal disease compared with Dutch-European diabetic patients. Diabetes Care. 2006;29:1383-5.
25. Noble JA, Valdes AM. Genetics of the HLA region in the prediction of type 1 diabetes. Curr Diab Rep. 2011;11:533-42.
26. de Jong PE, Verhave JC, Pinto-Sietsma SJ, Hillege HL; PREVEND study group. Obesity and target organ damage: the kidney. Int J Obes Relat Metab Disord. 2002;26 Suppl 4:S21-4.
27. Foster MC, Hwang SJ, Larson MG, et al. Overweight, obesity, and the development of stage 3 CKD: the Framingham Heart Study. Am J Kidney Dis. 2008;52:39-48.
28. Østergaard MV, Secher T, Christensen M, et al. Therapeutic effects of lisinopril and empagliflozin in a mouse model of hypertension-accelerated diabetic kidney disease. Am J Physiol Renal Physiol. 2021;321:F149-61.
29. Perry HM Jr, Miller JP, Fornoff JR, et al. Early predictors of 15-year end-stage renal disease in hypertensive patients. Hypertension. 1995;25:587-94.
30. Hustrini NM, Susalit E, Rotmans JI. Prevalence and risk factors for chronic kidney disease in Indonesia: an analysis of the National Basic Health Survey 2018. J Glob Health. 2022;12:04074.
31. Shepard BD. Sex differences in diabetes and kidney disease: mechanisms and consequences. Am J Physiol Renal Physiol. 2019;317:F456-62.
32. Carrero JJ. Gender differences in chronic kidney disease: underpinnings and therapeutic implications. Kidney Blood Press Res. 2010;33:383-92.
33. Kautzky-Willer A, Harreiter J, Pacini G. Sex and gender differences in risk, pathophysiology and complications of type 2 diabetes mellitus. Endocr Rev. 2016;37:278-316.
34. Liu D, Li N, Zhou Y, et al. Sex-specific associations between skeletal muscle mass and incident diabetes: a population-based cohort study. Diabetes Obes Metab. 2024;26:820-8.
35. Kovesdy CP. Epidemiology of chronic kidney disease: an update 2022. Kidney Int Suppl. 2022;12:7-11.
36. Muthuppalaniappan VM, Yaqoob MM. Ethnic/race diversity and diabetic kidney disease. J Clin Med. 2015;4:1561-5.
37. Hayanga B, Stafford M, Bécares L. Ethnic inequalities in multiple long-term health conditions in the United Kingdom: a systematic review and narrative synthesis. BMC Public Health. 2023;23:178.
38. Insaf TZ, Strogatz DS, Yucel RM, Chasan-Taber L, Shaw BA. Associations between race, lifecourse socioeconomic position and prevalence of diabetes among US women and men: results from a population-based panel study. J Epidemiol Community Health. 2014;68:318-25.
39. Jadawji C, Crasto W, Gillies C, et al. Prevalence and progression of diabetic nephropathy in South Asian, white European and African Caribbean people with type 2 diabetes: a systematic review and meta-analysis. Diabetes Obes Metab. 2019;21:658-73.
40. Genovese G, Friedman DJ, Ross MD, et al. Association of trypanolytic ApoL1 variants with kidney disease in African Americans. Science. 2010;329:841-5.
41. Hundemer GL, White CA, Norman PA, et al. Performance of the 2021 race-free CKD-EPI creatinine- and cystatin C-based estimated GFR equations among kidney transplant recipients. Am J Kidney Dis. 2022;80:462-72.e1.
Cite This Article
How to Cite
Download Citation
Export Citation File:
Type of Import
Tips on Downloading Citation
Citation Manager File Format
Type of Import
Direct Import: When the Direct Import option is selected (the default state), a dialogue box will give you the option to Save or Open the downloaded citation data. Choosing Open will either launch your citation manager or give you a choice of applications with which to use the metadata. The Save option saves the file locally for later use.
Indirect Import: When the Indirect Import option is selected, the metadata is displayed and may be copied and pasted as needed.
About This Article
Copyright

Data & Comments
Data
0


Comments
Comments must be written in English. Spam, offensive content, impersonation, and private information will not be permitted. If any comment is reported and identified as inappropriate content by OAE staff, the comment will be removed without notice. If you have any queries or need any help, please contact us at [email protected].