


Prevalence and incidence of obesity among children and adolescents in Guangdong: a prospective analysis from 2019-2022
 0
0 Abstract
Aim: The prevalence of obesity among Chinese children and adolescents has been widely reported, but incidence data remain scarce. This study examined the prevalence and incidence of obesity in Guangdong amid ongoing economic and demographic transitions.
Methods: This study used data from the Surveillance for Common Diseases and Health Risk Factors in Students in Guangdong Province (2019-2022). We calculated the prevalence (n = 117,862) and incidence (n = 108,043) of obesity among children and adolescents aged 6-19 years, stratified by sex, age, educational level, ethnicity, and residence.
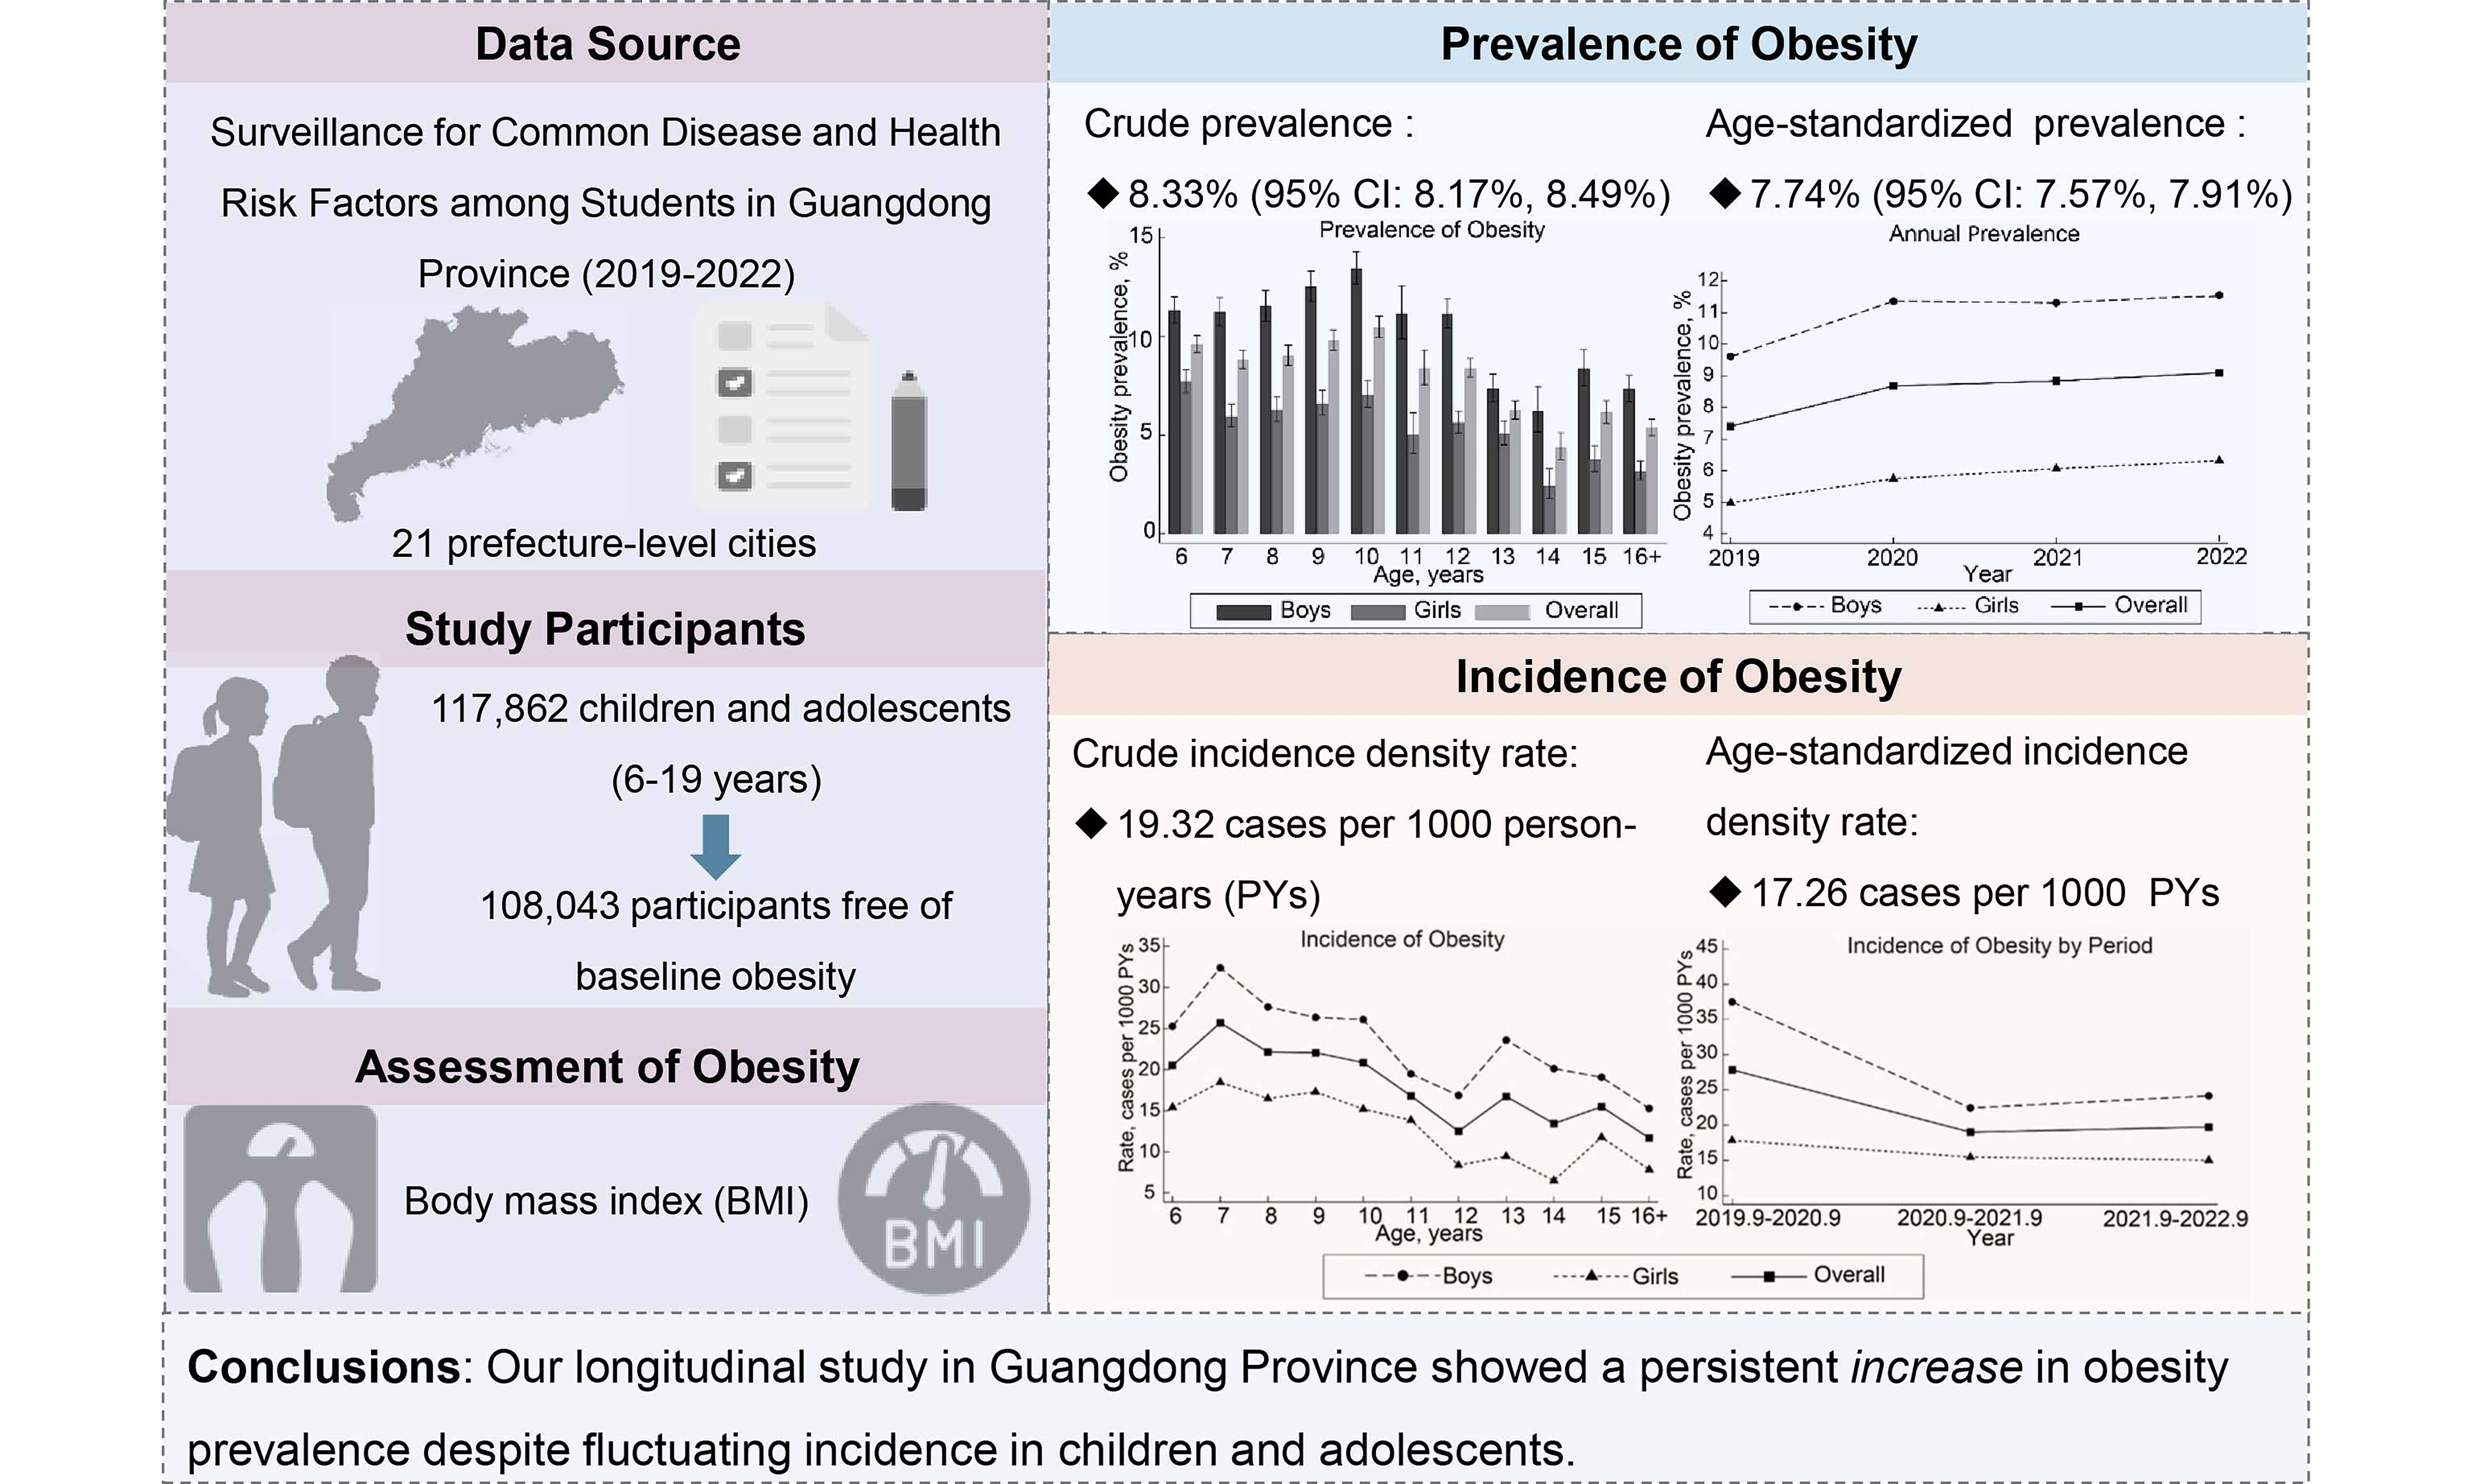
Results: The baseline crude prevalence was 8.33% [95% confidence interval (CI): 8.17%, 8.49%] for obesity and 10.86% (95%CI: 10.69%, 11.04%) for overweight. The crude prevalence of obesity increased from 7.41% (95%CI: 7.17%, 7.65%) in 2019 to 9.10% (95%CI: 8.89%, 9.31%) in 2022. The crude cumulative incidence was 3.03%, with an incidence density rate of 19.32 cases per 1,000 person-years (PYs). Incidence density rates declined from 2019-2020 (27.85 cases per 1,000 PYs) to 2020-2021 (19.01 cases per 1,000 PYs), followed by a slight, non-significant increase from 2020-2021 to 2021-2022 (19.74 cases per 1,000 PYs). Both the prevalence and incidence of overweight and obesity were higher in younger children and in boys than in their respective counterparts.
Conclusion: Our longitudinal study (2019-2022) in Guangdong Province showed a persistent increase in obesity prevalence, despite fluctuations in incidence among children and adolescents. The upward trend, particularly pronounced in younger children and boys, highlights the urgent need for targeted public health interventions.
Keywords
INTRODUCTION
The rising prevalence of obesity among children and adolescents poses a serious global public health challenge. As of 2022, 8% were affected worldwide[1]. This trend is particularly pronounced in East Asia, which has experienced the largest absolute increase in the number of obese children and adolescents over the past four decades[2]. China has undergone drastic socioeconomic changes since the 1990s, accompanied by a rapid rise in obesity prevalence[3]. For example, from 1995 to 2014, the prevalence of overweight and obesity increased from 5.3% to 20.5% among children and adolescents[4]. Despite extensive documentation of obesity prevalence (14 articles describing Chinese children and adolescents since 2019; Supplementary Table 1)[5-18], province-wide, representative data from southern China, particularly post-2019, remain sparse. Given the dynamic nature of this epidemic and evolving demographic profiles, ongoing surveillance is essential to understand the disease burden. Guangdong Province, one of China’s fastest-growing economic regions, can thus serve as a sentinel area for monitoring the obesity epidemic amid rapid economic transformation[19].
Moreover, while prevalence data provide insight into the current burden of overweight and obesity, incidence data are more informative for understanding the emergence of new cases over time. However, such data are predominantly from developed countries and remain relatively scarce in China. In a US cohort in 2010, the incidence of obesity from kindergarten through fifth grade was 16.2%[20], markedly higher than in Japan, where the rate was only 4.2% between ages 42 months and 12 years[21]. Additionally, a study from Sweden reported a lower obesity incidence of 10,799/948,062 (1.14%) among children aged 0-14 years from 2000 to 2010[22]. These variations highlight the influence of cultural, economic, and policy factors on obesity rates. In China, where rapid urbanization and economic development continue to reshape health profiles, comprehensive incidence data are lacking. We identified three studies reporting obesity incidence in children and adolescents in China: one based on the Chinese National Surveillance on Student Constitution and Health (CNSSCH)[13], and two conducted in more economically developed urban areas, namely Hong Kong[18] and Shanghai[8]. Reported incidence rates varied from 4.3% to 12.8% among children and adolescents aged 6-18 years. However, the reliability of these results may be limited by small sample sizes and short follow-up durations[8,13,18].
Our study utilized a large, representative sample from the Surveillance for Common Disease and Health Risk Factors among Students in Guangdong Province (2019-2022). By analyzing both prevalence and incidence rates of obesity, stratified by sex, age, educational level, ethnicity, and residence, we aim to provide a comprehensive view of obesity trends amid China’s ongoing economic and demographic transformations.
METHODS
Study population
Our study was based on the Surveillance for Common Disease and Health Risk Factors among Students in Guangdong Province (2019-2022), a comprehensive epidemiological initiative aimed at monitoring health trends among youth across Guangdong, China. A stratified multistage sampling method was used to ensure representativeness across the province’s diverse urban and rural landscapes. Initially, all 21 prefecture-level cities were included. For each city, one urban district and one county were selected through random sampling. Due to the lack of conventional urban districts in Dongguan and Zhongshan, the surveillance framework was adapted to align with the unique administrative divisions of these cities.
Within each selected urban district, eight schools were chosen: two each of elementary, middle, and regular high schools, plus one vocational high school and one university. In rural counties, five schools were randomly selected: two elementary schools, two middle schools, and one regular high school. The selection covered all educational stages from elementary through tertiary levels, specifically including students from the first to third year at universities. The sampling frame captured all children and adolescents from at least two classes per grade, ensuring broad coverage of the target population.
Schools selected at baseline were followed in subsequent annual surveillance rounds. Each year, new classes were included alongside previously selected classes that had not yet graduated, forming a dynamic cohort. Details of the survey design are provided in Supplementary Figure 1.
Demographic information was collected using structured questionnaires, including sex (boys, girls), age (6-9, 10-14, 15-19 years), educational level (grades 1-3 and 4-6 for elementary; 7-9 for middle school; 10-14 for high school and beyond), ethnicity (Han, others), and residence (urban, rural). Data collectors received rigorous training to ensure standardized questionnaire administration. Completed questionnaires underwent random checks for consistency and completeness, and a subset of responses was verified against source documents where available. The dataset was further validated to identify and correct discrepancies or outliers. Following data collection, all personal identifiers were removed to maintain participant anonymity, rendering the dataset de-identified. The study was granted exemption by the Medical Research Ethics Review Committee of the Guangdong Provincial Center for Disease Control and Prevention.
Assessment of obesity and its incidence
Anthropometric measurements were conducted by trained personnel following a standardized protocol. Children and adolescents, attired in light clothing and without footwear, had their height and weight measured to the nearest 0.1 centimeter and 0.1 kilogram, respectively. Detailed procedures are shown in the Supplementary Materials. Body mass index (BMI) was calculated by weight in kilograms divided by height in meters squared. The classification of obesity status followed the age- and sex-specific BMI criteria outlined in the WS/T 456 - 2014 standards for the screening of malnutrition[23] and the WS/T 586 - 2018 standards for the screening of obesity in Chinese children and adolescents[24]. Baseline obesity status (2019-2021) was categorized into four groups - normal weight, underweight, overweight, and obesity - based on the earliest recorded BMI. An incident case of obesity was defined as the first occurrence when a student’s BMI met or exceeded the established threshold.
Statistical analysis
The demographic and baseline characteristics of the study population were summarized using proportions. Chi-squared tests facilitated the comparison of categorical variables to identify significant differences at baseline. The prevalence of obesity and overweight from 2019 to 2021 was determined by calculating the proportion of obesity or overweight among all children and adolescents at baseline. Logistic regressions were used to examine the associations of baseline age with obesity and overweight, yielding odds ratios (ORs) and 95% confidence intervals (CIs). Annual prevalence rates were computed similarly, based on the number of cases within the cohort of children and adolescents assessed in each respective year (n = 45,874 for 2019, n = 64,611 for 2020, n = 91,447 for 2021, and n = 73,637 for 2022). Prevalence was presented as a percentage, with 95%CIs derived from logit transformations (https://www.stata.com/manuals14/rproportion.pdf).
Cumulative incidence rates were calculated by dividing the number of newly diagnosed students with obesity during follow-up by that of children and adolescents without obesity at baseline. The time at risk, expressed in person-years (PYs), was calculated from the initial anthropometric assessment to either the first recorded incidence of obesity or the last measurement below the obesity threshold, whichever occurred first. To account for variations in follow-up duration across the cohort, incidence density rates were calculated by dividing the number of new obesity diagnoses by the total PYs at risk. The study period was segmented into three equal intervals (September 2019-September 2020, September 2020-September 2021, and September 2021-September 2022) to assess temporal shifts in obesity incidence. Within each interval, only participants free from obesity at the onset were included and monitored until the subsequent year, resulting in cohorts of 35,947, 36,976, and 60,486 participants for each respective period. Incidence density rates were presented as cases per 1,000 PYs, with 95%CIs computed based on Poisson log-likelihood approximation using “stptime” command in Stata (version 17.0, StataCorp LLC, College Station, TX, US). Poisson regression was used to calculate sex-specific incidence rate ratios (IRRs), with adjustment for baseline demographics including educational levels, ethnicity and residence, as well as initial obesity status. Trends in incidence rates by age and period were also assessed using Poisson regression, with IRRs and 95%CIs estimated. Prevalence and incidence rates were directly standardized for age using data from the seventh national population census of China conducted in 2020 (National Bureau of Statistics data, http://www.stats.gov.cn/)[25].
Statistical analyses were performed using Stata version 17.0 (StataCorp LLC, College Station, TX, US). All statistical tests were two-sided, with P < 0.05 indicating statistical significance.
RESULTS
Supplementary Figure 1 shows the enrollment and follow-up of study participants. A total of 128,240 children and adolescents were enrolled at baseline in 2019-2021. Those under the age of 6 or over 19 years were excluded (n = 53), along with those with record errors (i.e., follow-up time < 0) (n = 211). After further excluding participants who were lost to follow-up or had missing baseline information (n = 10,114), 117,862 children and adolescents remained and were included in the prevalence calculation for 2019-2021. Additionally, after excluding those with baseline obesity (n = 9,819), a total of 108,043 children and adolescents, each with at least two repeated measurements, were included in the incidence rate calculation.
Prevalence of obesity and overweight
Supplementary Table 2 shows that, of 117,862 children and adolescents at baseline, 52.71% were boys and 47.29% were girls. The predominant age group is 6-9 years (48.07%), followed by 10-14 years (36.64%) and 15-19 years (15.30%). In terms of schooling, 39.38% were in elementary grades 1-3, 22.24% in elementary grades 4-6, 23.03% in middle school and 15.34% in high school or above. The participants were predominantly of Han ethnicity (98.47%) and nearly evenly split between urban (56.36%) and rural (43.64%) residents. Regarding obesity status, most students had a normal weight (68.99%) or were underweight (11.82%), while 10.86% were overweight, and 8.33% were obese. Boys had a higher prevalence of overweight and obesity compared to girls. Sex differences were observed in dietary and lifestyle behaviors
Table 1 shows that the baseline crude prevalence was 8.33% (95%CI: 8.17%, 8.49%) for obesity and 10.86% (95%CI: 10.69%, 11.04%) for overweight. The age-standardized prevalence was 7.74% (95%CI: 7.57%, 7.91%) for obesity and 10.97% (95%CI: 10.76%, 11.18%) for overweight. From grades 1-3 to 4-6, the prevalence of obesity (9.07% to 10.11%) and overweight (9.61% to 12.17%) increased, followed by a decline in middle and high school. The highest prevalence occurred among boys from grades 4-6, with 13.07% for obesity and 15.26% for overweight. Overall, boys had a higher prevalence than girls, and urban residents exhibited a higher prevalence than rural counterparts across most educational levels. Figure 1 and Supplementary Table 3 show a pattern of prevalence that initially increases and then decreases with age, peaking at age 10, with 10.45% for obesity. At most ages, boys exhibited higher prevalence of both obesity and overweight compared with girls.
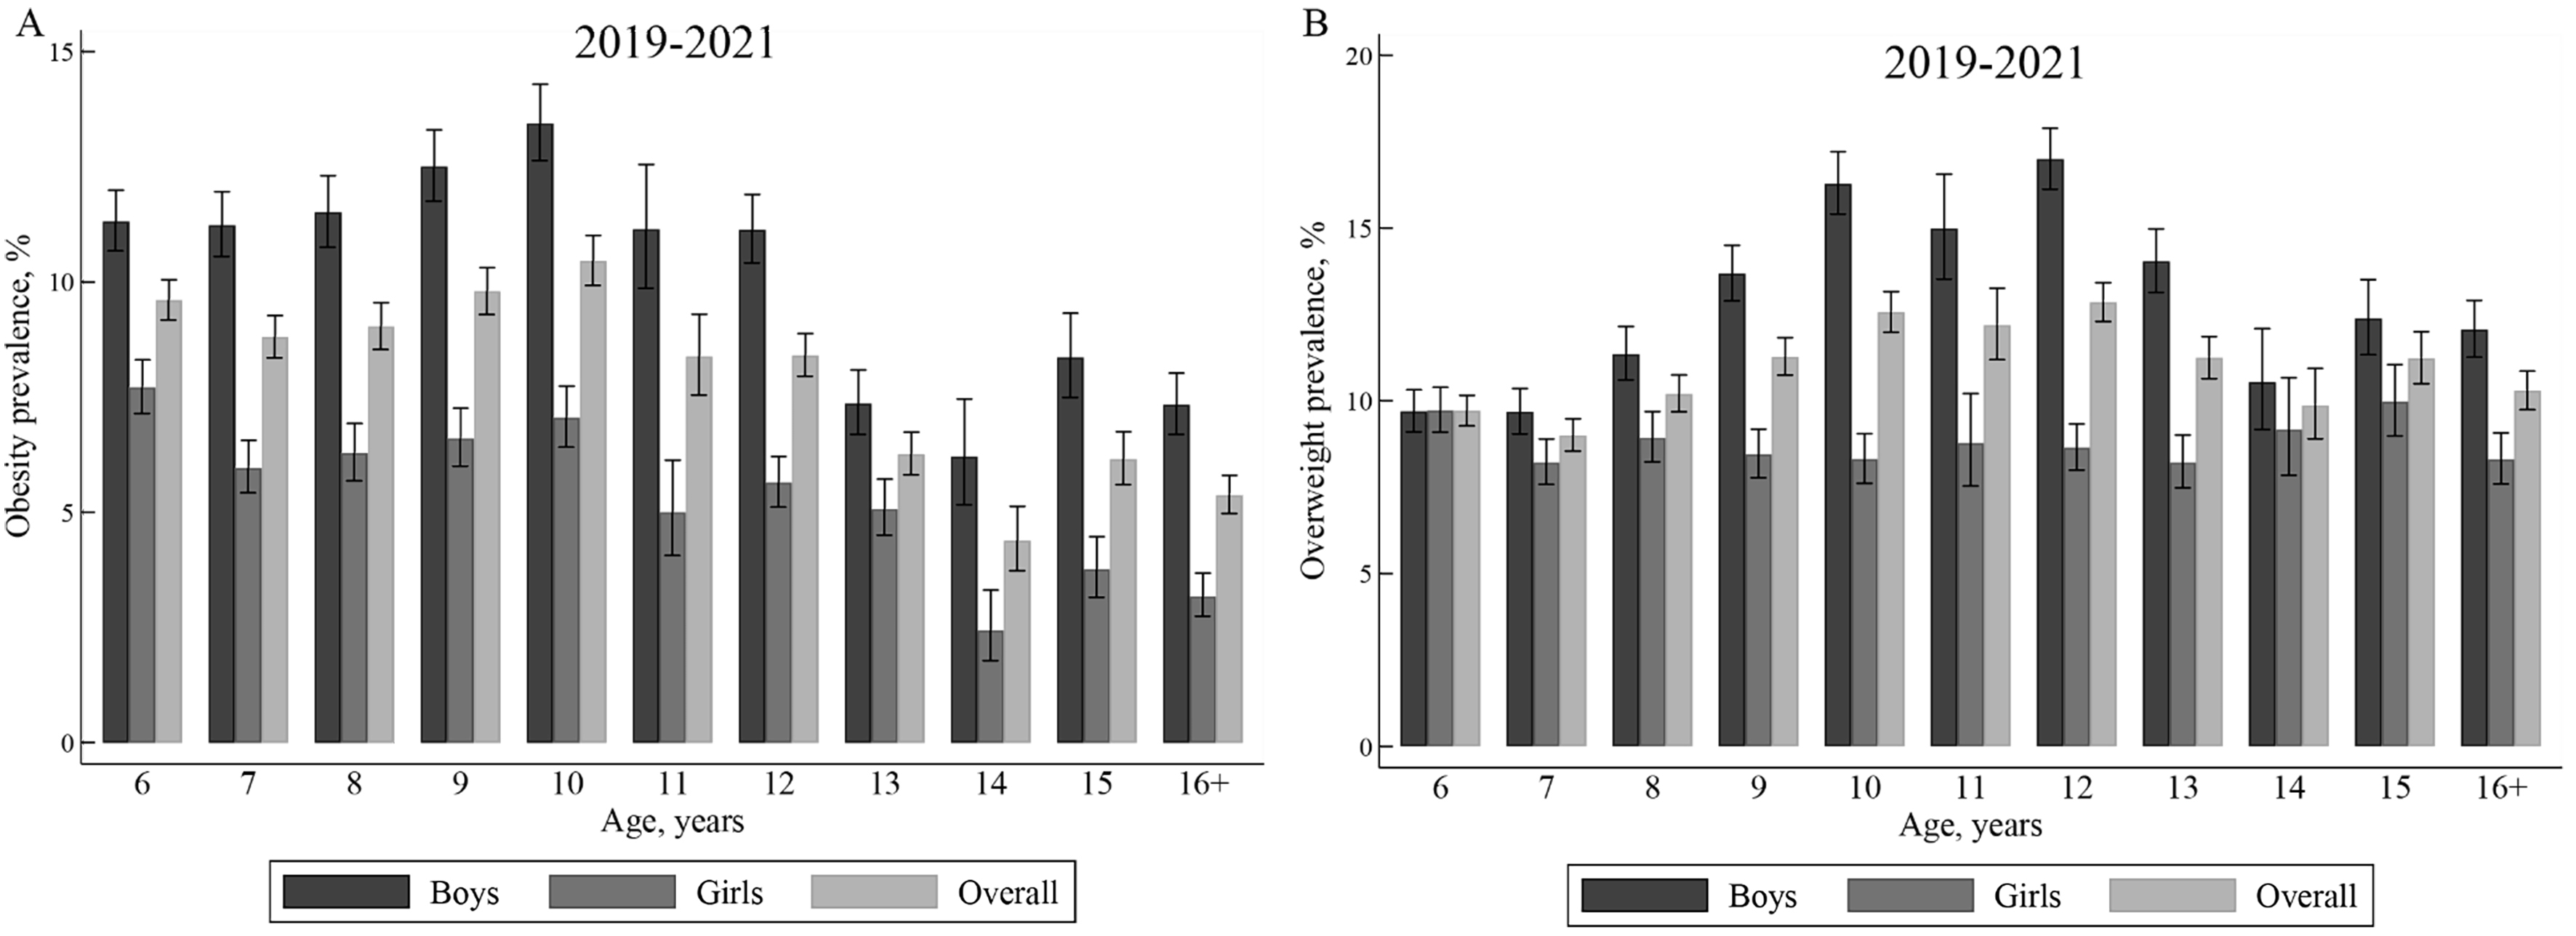
Figure 1. Age-specific prevalence of obesity and overweight for children and adolescents in 2019-2021 in Guangdong province. This figure shows the age-specific prevalence of obesity (A) and overweight (B) by sex for 117,862 children and adolescents. The black vertical lines represent 95% confidence intervals.
Prevalence of obesity and overweight by baseline characteristics on 117,862 children and adolescents aged from 6 to 19 years in 2019-2021 in Guangdong Province
| No. of cases | Overall prevalence, % (95%CI) | Educational levels Prevalence, % (95%CI) | ||||||
| Crude | Age-standardized prevalence rates † | Elementary school (1-3 grades) | Elementary school (4-6 grades) | Middle school (7-9 grades) | High school and above (10-14 grades) | |||
| Obesity | ||||||||
| Overall | 9819 | 8.33 (8.17, 8.49) | 7.74 (7.57, 7.91) | 9.07 (8.81, 9.33) | 10.11 (9.75, 10.48) | 7.11 (6.81, 7.43) | 5.70 (5.37, 6.04) | |
| Sex | Boys | 6596 | 10.62 (10.38, 10.86) | 9.98 (9.72, 10.25) | 11.16 (10.78, 11.56) | 13.07 (12.52, 13.63) | 9.08 (8.62, 9.57) | 7.79 (7.27, 8.35) |
| Girls | 3223 | 5.78 (5.59, 5.98) | 5.25 (5.06, 5.46) | 6.68 (6.36, 7.02) | 6.66 (6.23, 7.12) | 5.06 (4.70, 5.44) | 3.40 (3.03, 3.80) | |
| Ethnicity | Han | 9384 | 8.31 (8.15, 8.48) | 7.73 (7.56, 7.90) | 9.01 (8.75, 9.28) | 10.10 (9.74, 10.48) | 7.13 (6.82, 7.45) | 5.68 (5.35, 6.04) |
| Others | 179 | 10.21 (8.87, 11.71) | 9.69 (8.22, 11.36) | 12.21 (9.76, 15.18) | 10.30 (7.76, 13.57) | 9.32 (7.01, 12.30) | 7.59 (5.05, 11.25) | |
| Residence | Urban | 4401 | 8.47 (8.23, 8.71) | 8.27 (8.03, 8.52) | 9.12 (8.62, 9.65) | 11.14 (10.60, 11.70) | 7.73 (7.30, 8.18) | 6.11 (5.71, 6.54) |
| Rural | 2984 | 7.42 (7.17, 7.68) | 6.82 (6.55, 7.10) | 7.79 (7.27, 8.35) | 9.11 (8.63, 9.61) | 6.42 (6.00, 6.86) | 4.60 (4.05, 5.23) | |
| Overweight | ||||||||
| Overall | 12,802 | 10.86 (10.69, 11.04) | 10.97 (10.76, 11.18) | 9.61 (9.35, 9.89) | 12.17 (11.78, 12.57) | 11.80 (11.42, 12.19) | 10.75 (10.31, 11.21) | |
| Sex | Boys | 7926 | 12.76 (12.50, 13.02) | 12.98 (12.67, 13.3) | 10.24 (9.87, 10.63) | 15.26 (14.68, 15.87) | 15.01 (14.43, 15.62) | 12.29 (11.64, 12.96) |
| Girls | 4876 | 8.75 (8.52, 8.99) | 8.76 (8.49, 9.03) | 8.90 (8.53, 9.29) | 8.57 (8.09, 9.08) | 8.45 (7.99, 8.94) | 9.07 (8.48, 9.69) | |
| Ethnicity | Han | 12,258 | 10.86 (10.68, 11.04) | 10.98 (10.77, 11.20) | 9.60 (9.33, 9.88) | 12.15 (11.75, 12.56) | 11.89 (11.50, 12.29) | 10.74 (10.29, 11.21) |
| Others | 203 | 11.57 (10.16, 13.16) | 11.82 (10.12, 13.72) | 9.03 (6.93, 11.68) | 13.58 (10.65, 17.17) | 12.50 (9.81, 15.80) | 12.07 (8.79, 16.35) | |
| Residence | Urban | 6044 | 11.63 (11.36, 11.91) | 11.55 (11.26, 11.85) | 10.24 (9.72, 10.8) | 12.52 (11.96, 13.12) | 12.66 (12.13, 13.21) | 10.92 (10.39, 11.47) |
| Rural | 4260 | 10.59 (10.29, 10.89) | 10.35 (9.99, 10.71) | 8.72 (8.17, 9.31) | 11.83 (11.30, 12.39) | 10.81 (10.27, 11.36) | 10.23 (9.41, 11.11) | |
Table 2 and Supplementary Figure 2A show a general trend of gradual increase in prevalence from 2019 to 2022. The crude prevalence of obesity increased from 7.41% (95%CI: 7.17%, 7.65%) in 2019 to 9.10% (95%CI: 8.89%, 9.31%) in 2022. The age-standardized prevalence rates similarly increased from 6.79% (95%CI: 6.54%, 7.06%) in 2019 to 8.65% (95%CI: 8.43%, 8.87%) in 2022. The most pronounced annual increase was observed in the youngest age group, 6-9 years, which surged from 8.17% in 2019 to 9.98% in 2020, and in the earliest educational level, 1-3 grades, rising from 7.88% to 9.85% in the same interval. By 2022, the prevalence among boys had peaked at 11.55%.
The prevalence of obesity by demographic characteristics for 45,874 children and adolescents in 2019, 64,611 children and adolescents in 2020, 91,447 children and adolescents in 2021, and 73,637 children and adolescents in 2022
| Prevalence, % (95%CI) | ||||
| 2019 | 2020 | 2021 | 2022 | |
| All | 7.41 (7.17, 7.65) | 8.68 (8.47, 8.90) | 8.84 (8.66, 9.02) | 9.10 (8.89, 9.31) |
| Age standardized prevalence rates† | 6.79 (6.54, 7.06) | 8.11 (7.89, 8.33) | 8.35 (8.16, 8.55) | 8.65 (8.43, 8.87) |
| Sex | ||||
| Boys | 9.61 (9.25, 9.99) | 11.36 (11.03, 11.71) | 11.31 (11.03, 11.6) | 11.55 (11.23, 11.87) |
| Girls | 4.98 (4.70, 5.27) | 5.75 (5.49, 6.01) | 6.07 (5.85, 6.30) | 6.32 (6.07, 6.58) |
| Age, years | ||||
| 6-9 | 8.17 (7.82, 8.53) | 9.98 (9.61, 10.35) | 9.87 (9.57, 10.18) | 10.05 (9.67, 10.44) |
| 10-14 | 7.25 (6.87, 7.65) | 8.93 (8.60, 9.27) | 8.88 (8.60, 9.16) | 9.53 (9.23, 9.83) |
| 15-19 | 4.86 (4.34, 5.44) | 5.25 (4.86, 5.67) | 6.19 (5.81, 6.58) | 6.18 (5.78, 6.61) |
| Educational levels | ||||
| Elementary school (1-3 grades) | 7.88 (7.50, 8.27) | 9.85 (9.44, 10.27) | 9.45 (9.12, 9.79) | 9.82 (9.40, 10.26) |
| Elementary school (4-6 grades) | 8.93 (8.43, 9.45) | 10.48 (10.05, 10.92) | 10.70 (10.34, 11.07) | 10.69 (10.35, 11.05) |
| Middle school (7-9 grades) | 6.12 (5.66, 6.62) | 7.18 (6.77, 7.60) | 7.23 (6.88, 7.59) | 7.04 (6.64, 7.45) |
| High school and above (10-14 grades) | 4.89 (4.36, 5.48) | 5.23 (4.82, 5.68) | 6.23 (5.84, 6.65) | 6.17 (5.72, 6.66) |
| Ethnicity | ||||
| Han | 7.40 (7.16, 7.64) | 8.70 (8.48, 8.92) | 8.82 (8.64, 9.02) | 9.11 (8.90, 9.32) |
| Others | 8.66 (6.51, 11.44) | 10.88 (8.84, 13.3) | 11.10 (9.60, 12.80) | 11.40 (9.72, 13.31) |
| Residence | ||||
| Urban | 8.08 (7.74, 8.43) | 9.06 (8.74, 9.39) | 8.98 (8.70, 9.27) | 9.43 (9.11, 9.76) |
| Rural | 6.40 (6.05, 6.78) | 7.52 (7.19, 7.86) | 8.19 (7.89, 8.50) | 8.09 (7.74, 8.45) |
| No. of cases | 3397 | 5609 | 8082 | 6698 |
| No. of children and adolescents | 45,874 | 64,611 | 91,447 | 73,637 |
Incidence of obesity
Supplementary Table 4 shows that, from 2019 to 2022, among 108,043 children and adolescents, the overall crude cumulative incidence rate was 3.03%, with age-standardized rates slightly lower at 2.64%. In all age groups, boys had higher incidence rates than girls. The youngest age group (6-9 years) and the earliest educational level (elementary school grades 1-3) showed higher rates, as did participants of ethnic groups other than Han, and those residing in urban areas. The incidence rates were highest among overweight boys, at 20.31%, while the lowest rates were observed in underweight girls, at 0.34%.
Table 3 shows that, in all subgroups, boys had higher incidence density rates than girls. The overall crude and age-standardized incidence density rates were 19.32 and 17.26 cases per 1,000 PYs, respectively. A decremental trend was observed with advancing educational levels. Incidence density rates decreased by 25% in grades 4-6 (IRR: 0.75; 95%CI, 0.69 to 0.82), 48% in middle school (IRR: 0.52; 95%CI, 0.47 to 0.57) and 50% (IRR: 0.50; 95%CI, 0.44 to 0.57) in high school and above, compared with grades 1-3. Children and adolescents with overweight had a 23.08-fold higher risk of developing obesity than those with normal weight at baseline (IRR: 24.08; 95%CI, 21.94 to 26.43). Boys with overweight exhibited the highest incidence density rates (141.85 cases per 1,000 PYs), whereas underweight girls had the lowest (1.99 cases per 1,000 PYs).
Incidence density rates of obesity by baseline characteristics for 108,043 s in 2019-2021 and followed up till 2022 in Guangdong province
| Overall | Boys | Girls | ||||
| Rate, cases per 1,000 person-years (95%CI) | IRR (95%CI) | Rate, cases per 1,000 person-years (95%CI) | IRR (95%CI) | Rate, cases per 1,000 person-years (95%CI) | IRR (95%CI) | |
| Crude | 19.32 (18.67, 20.00) | 24.46 (23.44, 25.52) | 13.91 (13.13, 14.74) | |||
| ASIRs† | 17.26 (16.57, 17.97) | 22.03 (20.95, 23.16) | 12.26 (11.44, 13.12) | |||
| Educational levels, grade | ||||||
| 1-3 | 22.40 (21.38, 23.47) | Ref. (1.00) | 27.87 (26.30, 29.53) | Ref. (1.00) | 16.54 (15.30, 17.88) | Ref. (1.00) |
| 4-6 | 21.33 (19.82, 22.97) | 0.75 (0.69, 0.82)*** | 25.78 (23.50, 28.29) | 0.63 (0.56, 0.70)*** | 16.48 (14.60, 18.61) | 1.01 (0.87, 1.18) |
| 7-9 | 14.23 (13.03, 15.53) | 0.52 (0.47, 0.57)*** | 20.01 (18.02, 22.21) | 0.50 (0.44, 0.56)*** | 8.48 (7.23, 9.95) | 0.53 (0.44, 0.64)*** |
| 10-14 | 13.23 (11.78, 14.86) | 0.50 (0.44, 0.57)*** | 16.73 (14.48, 19.34) | 0.48 (0.41, 0.56)*** | 9.62 (7.92, 11.68) | 0.54 (0.44, 0.67)*** |
| Ethnicity | ||||||
| Han | 19.36 (18.70, 20.05) | Ref. (1.00) | 24.48 (23.44, 25.56) | Ref. (1.00) | 13.97 (13.17, 14.82) | Ref. (1.00) |
| Others | 23.44 (17.87, 30.77) | 1.20 (0.90, 1.61) | 30.74 (22.07, 42.81) | 1.22 (0.85, 1.74) | 15.75(9.79, 25.34) | 1.19 (0.72, 1.99) |
| Residence | ||||||
| Urban | 19.15 (18.21, 20.15) | Ref. (1.00) | 24.56 (23.07, 26.15) | Ref. (1.00) | 13.53 (12.42, 14.75) | Ref. (1.00) |
| Rural | 17.31 (16.28, 18.41) | 0.96 (0.89, 1.03) | 22.19 (20.58, 23.94) | 0.96 (0.87, 1.06) | 12.16 (10.95, 13.51) | 0.95(0.83, 1.08) |
| Obesity status | ||||||
| Normal | 5.88 (5.47, 6.31) | Ref. (1.00) | 7.56 (6.90, 8.27) | Ref. (1.00) | 4.29 (3.81, 4.82) | Ref. (1.00) |
| underweight | 2.75 (2.15, 3.52) | 0.45 (0.33, 0.60)*** | 3.29 (2.45, 4.42) | 0.44 (0.31, 0.62) *** | 1.99 (1.27, 3.12) | 0.40 (0.23, 0.71)** |
| Overweight | 131.87 (126.76, 137.19) | 24.08 (21.94, 26.43)*** | 141.85 (135.09, 148.95) | 20.33 (18.11, 22.83)*** | 116.30 (108.72, 124.41) | 29.36 (25.12, 34.31)*** |
Figure 2A and Supplementary Table 5 show a decline in incidence density rates with increasing age, a trend observed across both sexes. Figure 2B shows disparities in incidence rates based on baseline obesity status, with students who were overweight exhibiting substantially higher rates of developing obesity than their normal-weight or underweight peers across all age groups. Supplementary Table 5 shows that incidence density rates were greatest at age 7, with 32.39 cases per 1,000 PYs in boys and 204.61 cases per 1,000 PYs in overweight children and adolescents.
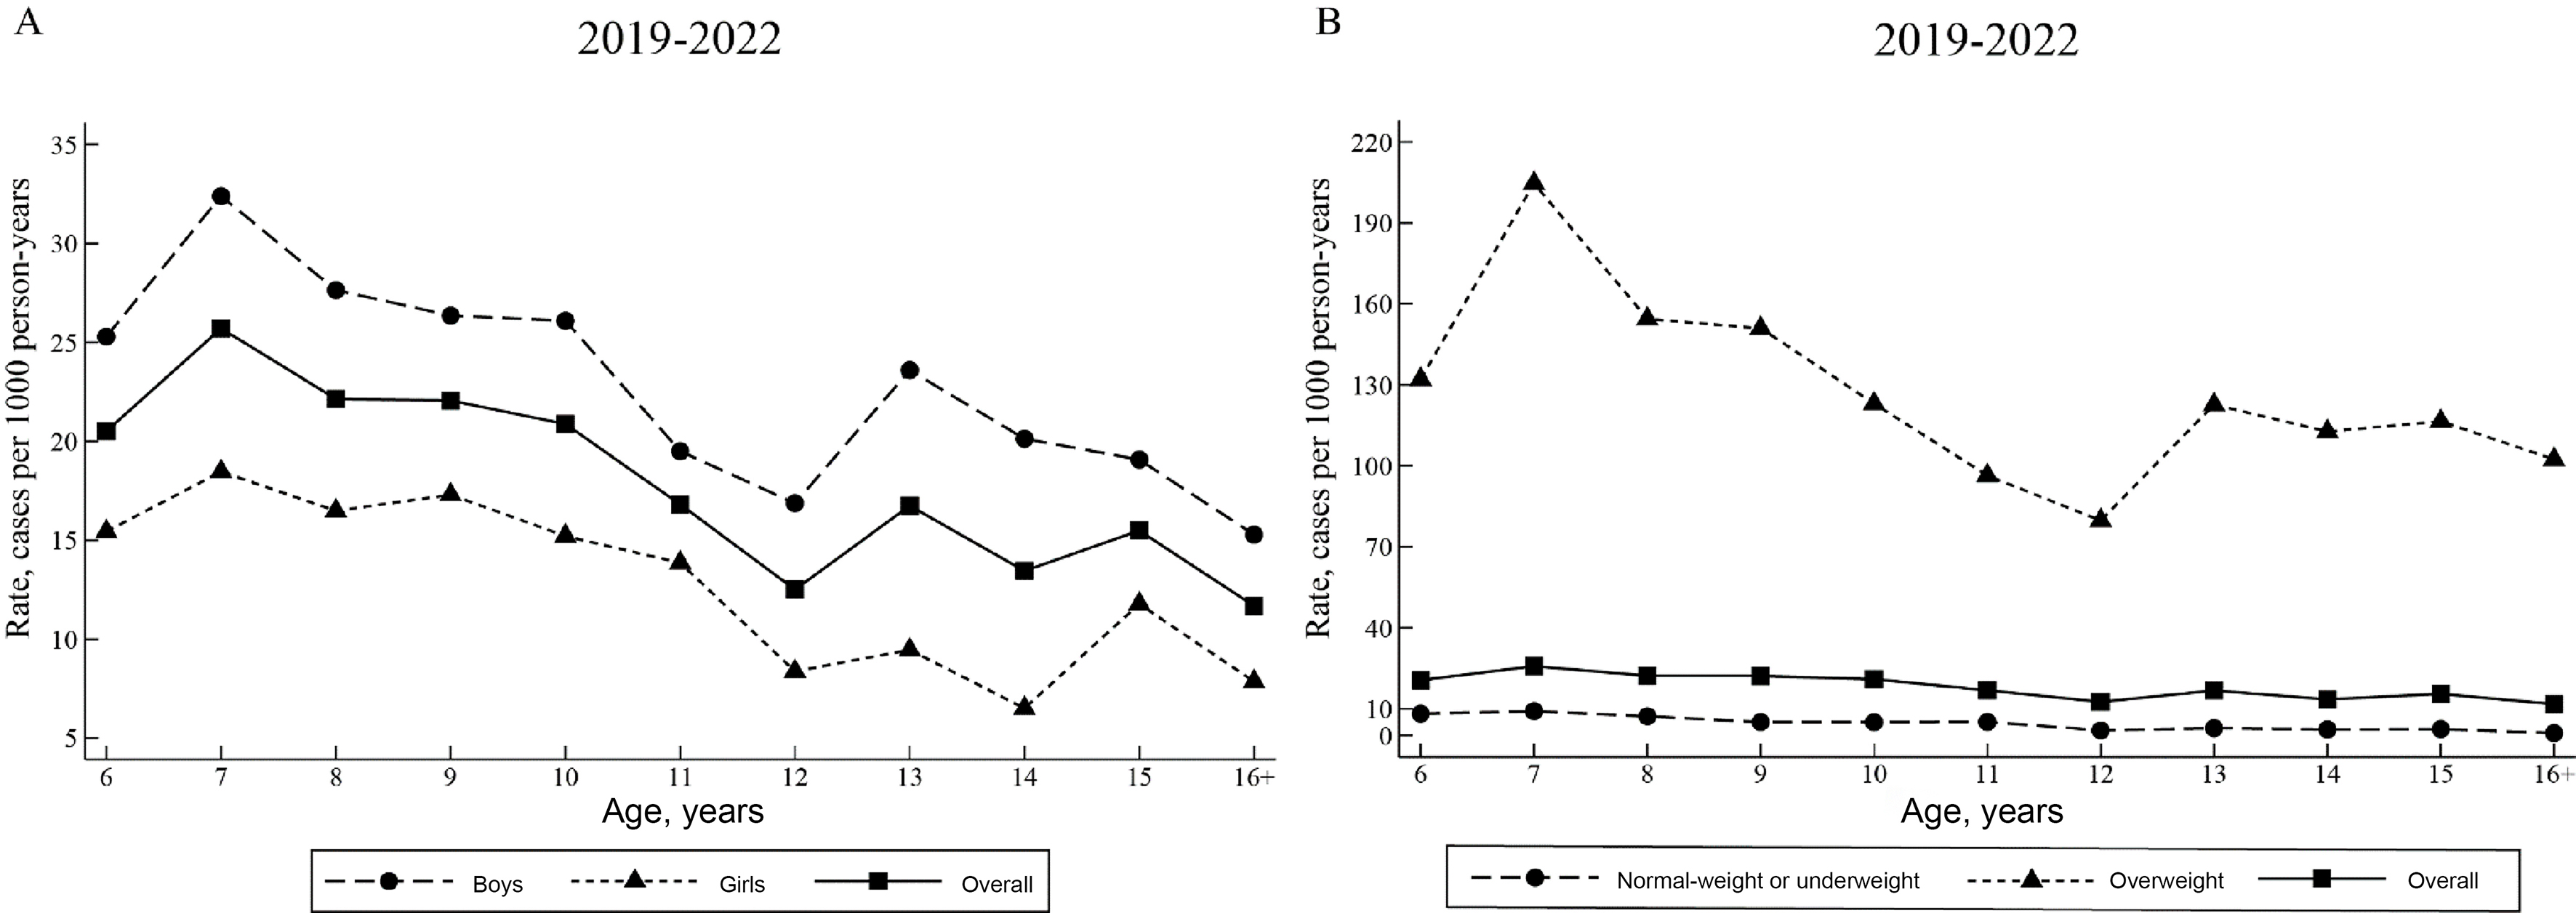
Figure 2. Age-specific incidence density rates of obesity for children and adolescents in 2019-2021 and followed up till 2022 in Guangdong Province. This figure shows age-specific incidence density rates by sex (A) and baseline obesity status (B) for 108,043 children and adolescents.
Supplementary Table 6 and Supplementary Figure 2B show a general trend of decreasing incidence density rates from September 2019-September 2020 (27.85 cases per 1,000 PYs) to September 2020-September 2021 (19.01 cases per 1,000 PYs), followed by a slight, non-significant increase from September 2020-September 2021 to September 2021-September 2022 (19.74 cases per 1,000 PYs). Incidence density rate of overweight children and adolescents was highest in September 2019-September 2020, reaching 210.52 cases per 1,000 PYs.
DISCUSSION
In this study, we address the gap in longitudinal research on obesity incidence among children and adolescents in China, where previous studies have largely focused on prevalence. Our comprehensive data from 2019 to 2022 for Guangdong Province provides a detailed report on both the prevalence and incidence of obesity. We found that the crude prevalence of obesity increased from 7.41% in 2019 to 9.10% in 2022, reflecting an upward trend. Moreover, the incidence of obesity was found to be 19.32 cases per 1,000 PYs, which was comparable to those observed in Japan (4.2%)[21] and Sweden (1.14%)[22], yet much lower than the US (16.2%)[20]. Notably, the data show higher rates of prevalence and incidence in boys, younger children and those residing in urban areas. These findings call for multifaceted public health strategies that incorporate cultural and socioeconomic factors to effectively combat this growing obesity epidemic.
The crude prevalence of 8.33% for obesity and 10.86% for overweight observed in our study are consistent with the combined prevalence of 19% for overweight and obesity reported by the most recent round of China Chronic Disease and Nutrition Surveillance (2015-2019)[26]. The prevalence align with findings from two national surveillance studies[12,13] and a study using data from 31 provinces in China[9], as well as studies conducted regionally: a cross-sectional[10] and a cohort study[17] in southwestern China (Chengdu), two cross-sectional studies in eastern China (Zhejiang[15] and Suzhou[5]), and a longitudinal study in southern China (Hong Kong)[18]. However, the prevalence in our population was slightly lower than previously reported figures, with obesity prevalence in other studies ranging from 7.67% in 2019 to 12.77% in 2020, and overweight and obesity prevalence ranging from 16.7% to 23.4% in 2019[5,9,10,12,13,15,17,18]. The prevalence of overweight and obesity in our study was also apparently lower than those observed in three cohort studies[11,14,16], one cross-sectional study[7] and one surveillance[8], with differences exceeding 5%, potentially because those studies primarily involved urban or developed regions in eastern (Shanghai[7,8,14] and Jiangsu[11]) or northern China (Beijing[16]). In contrast, a study in Yunnan showed a lower age-standardized obesity prevalence, i.e., 4.24% in 2019, possibly because 83.55% of participants of this Yunnan study were from rural areas[6]. Such regional disparities highlight the distinct profiles of obesity across China. Previous studies suggest that children from southern China, including Guangdong, traditionally had lower rates of overweight and obesity compared to those in northern and northeastern regions[12,27]. Previous national data from CNSSCH showed that Guangdong was among the provinces with the lowest prevalence of overweight and obesity among both boys (1985: 0.3%; 2005: 5.6%) and girls (1985: 0.5%; 2005: 3.2%) from 1985 to 2005, while Beijing was consistently the highest area among both boys (1985: 2.9%; 2005: 16.4%) and girls (1985: 3.0%; 2005: 10.1%)[28]. This variation may be influenced by differences in dietary and physical activity, as evidenced by nationally representative data from the China Health and Nutrition Survey (CHNS) (2015-2017). This indicated that the northern wheat-based dietary pattern was associated with a higher risk of overweight/obesity compared to the southern rice-based diet[29].
The rising prevalence of childhood obesity is driven by multiple factors. Evidence indicates that compared with the offspring who were free of parental overweight/obesity, those with both parental overweight/obesity had markedly higher odds of developing general, simple abdominal and compound obesity (ORs: 2.66, 1.72, and 4.04, respectively)[30]. This intergenerational association may reflect genetic susceptibility[31], shared familial lifestyle behaviors[32,33], or both[34]. These findings underscore the need for multifaceted, family-centered interventions that target lifestyle modification, and highlight the importance of integrated strategies combining individual and household engagement[35]. In addition, the role of environmental “obesogens” in the increasing prevalence of obesity is attracting more and more attention[36]. Currently, more than 50 chemicals with substantial human exposure have been identified as potential environmental obesogens capable of disrupting lipid metabolism and promoting adiposity[36]. As the food delivery industry expands rapidly, children and adolescents are becoming increasingly exposed to microplastics[37]. Evidence from both epidemiological and experimental studies suggests that exposure to microplastics is associated with metabolic disturbances and an increased risk of obesity[37-39]. These findings underscore the importance of implementing comprehensive public health measures to mitigate environmental pollution.
The crude cumulative incidence rate of obesity in our study was 3.03% among children and adolescents aged 6-19 years, including both boys and girls. This rate is lower than that previously reported in national data from the US (16.2%)[20] and Japan (4.2%)[21], but higher than in Sweden (1.14%)[22]. These differences can be explained by several factors: the longer follow-up periods in previous studies (at least 6 years), a high incidence of obesity among children born in the mid-2000s in the US, and potential underestimation of obesity incidence in Swedish adolescents, where the definition of obesity was based on hospital register data[20-22]. Moreover, the incidence in our study was slightly lower than the 4.3% reported by the Surveillance of Students’ Common Diseases and Health Influencing Factors in Shanghai[8], and significantly lower than that previously reported in CNSSCH (12.8%)[13]. These differences might be explained by variations in cultural preferences, social norms, and levels of urbanization across regions. Given the lack of large, long-term cohorts in China, our findings add to the literature by offering recent insights into obesity trends in Guangdong; however, further research is needed to fully understand the evolving patterns of obesity incidence across different regions of China.
The incidence of obesity was notably high from September 2019 to September 2020, consistent with significant weight gain among children and adolescents in California during the coronavirus disease 2019 (COVID-19) pandemic[40]. This increase was closely linked to lifestyle changes including reduced physical activity, increased sedentary behaviors, and longer screen and sleep time[41]. Although the incidence subsequently declined and stabilized over the next two years, the prevalence continued to rise. The persistent increase in obesity prevalence supports the assertion that China remains in the early stages of the obesity epidemic[42]. The rapid rise in prevalence during the COVID-19 pandemic (from 7.41% in 2019 to 8.68% in 2020) suggests that the prognosis of this epidemic is accelerating, highlighting the urgent need for effective public health interventions.
The higher prevalence of obesity in boys in our study was consistent with a previous review in China[43]. This gender disparity may stem from differences in genetics, hormones, body composition, dietary habits, and sociocultural attitudes towards weight[44,45]. Sex-specific behaviors observed in our study may help to explain the greater obesity prevalence in boys. Boys were more likely to consume sugar-sweetened beverages and fried food, and to smoke and drink alcohol, while girls reported higher intake of fruits and vegetables. In addition, inherent biological differences between sexes may also contribute to the observed disparity in obesity prevalence. For instance, women generally exhibit higher brown adipose tissue (BAT) activity than men[46]. BAT plays a key role in thermogenesis by dissipating energy as heat through uncoupling protein 1 (UCP1) instead of producing adenosine triphosphate (ATP), thereby promoting calorie expenditure[47]. In our study, the highest prevalence of overweight and obesity was observed among adolescents aged 10, which may be attributed to poor diet quality and low levels of physical activity within this age group[48]. Furthermore, we found that the incidence of obesity was higher in younger age groups, peaking between the ages of 6 and 7 years, which was consistent with studies from Spain and the US[49,50]. Of the 3,269 new obesity diagnoses in our study, 75% were overweight at baseline, underlining the importance of weight management in those who were overweight in preventing the development of obesity. Early identification and intervention of obesity might help to reduce obesity risk in children and adolescents.
Consistent with a previous study[43], we found that urban students had a higher prevalence of obesity than their rural counterparts. However, this urban-rural disparity in obesity prevalence is diminishing and, in some cases, reversing as urbanization progresses. Notably, a recent study showed a higher prevalence of obesity in rural women compared to urban women, suggesting shifting health challenges as lifestyle changes permeate rural areas[51]. This evolving pattern highlights the need for targeted public health interventions that take into account the complex interaction of geography, culture, and socioeconomic factors in addressing the obesity epidemic.
Strengths and limitations
The major strength of our study lies in its large sample size of children and adolescents aged 6 to 19 years with at least two repeated measurements. This representative sample enables us to provide recent estimates of prevalence and incidence of obesity in southern China. Despite these strengths, our study also has several limitations. First, the proportion of students aged 18 years and older was relatively low. However, the age-standardized prevalence and incidence were only marginally lower than the pre-standardized values, and the patterns across different subgroups and years remained consistent with the crude rates. Second, this study did not collect information on family-related factors or environmental pollution (e.g., exposure to microplastics), which may also influence the development of obesity in children and adolescents. Future studies including these factors are needed to provide a more comprehensive understanding of the risk factors underlying childhood obesity. Third, inherent biological traits that may contribute to sex differences in obesity were not captured. Although we provided sex-stratified baseline lifestyle characteristics and discussed potential biological mechanisms, future studies incorporating detailed biological measurements are warranted to better elucidate the observed sex disparities. Additionally, only 1.53% of the sample comprised students from ethnic groups other than Han, and the surveyed schools were limited to district- and county-level schools, excluding those at township- and village-level schools. This suggests a need for a broader sample to fully capture the diversity of obesity prevalence and incidence. Finally, due to regional variations, the findings from Guangdong may not be generalizable to other provinces.
Conclusion
In conclusion, this study of obesity trends in children and adolescents in Guangdong province showed an upward trend in prevalence from 2019 to 2022, marked by pronounced disparities across age, sex, and ethnicity. Our findings indicate that younger children and boys were particularly vulnerable, highlighting the need for targeted interventions. Moreover, the differences in obesity rates between urban and rural areas and among ethnic minorities highlight the complexity of the obesity epidemic in southern China. These findings underscore an urgent public health imperative to strengthen early prevention and implement comprehensive strategies to curb the growing burden of childhood obesity.
DECLARATIONS
Acknowledgements
The Graphic Abstract and Supplementary Figure 1 were created using Microsoft PowerPoint. The other figures [Figures 1 and 2, Supplementary Figure 2] were generated using Stata (Version 17.0). The authors would like to thank the students and staff who were involved in this study.
Authors’ contributions
Involved in the conception, design, acquisition of funding, and acquisition and interpretation of data: Li M, Zhang R, Lu T, Shen S, Chen Q, Liu R, Xu L, Wang J, Qu Y
Analyzed the data and wrote the first draft of the manuscript: Li M, Zhang R
Critically revised the article for important intellectual content: Li M, Wang J, Qu Y
The guarantors of this work and, as such, have full access to all the data in the study and take responsibility for the integrity of the data and the accuracy of the data analysis: Wang J, Qu Y
All authors reviewed and approved the final version of the manuscript.
Availability of data and materials
Data are not publicly available because the participants did not consent to data sharing.
Financial support and sponsorship
This work was supported by the Department of Education of Guangdong Province (grant number: YCKJ-2024-15) and the Science and Technology Projects in Guangzhou (202002030405).
Conflicts of interest
All authors declared that there are no conflicts of interest.
Ethical approval and consent to participate
The study was granted exemption by the Medical Research Ethics Review Committee of the Guangdong Provincial Center for Disease Control and Prevention because it used anonymized data from the “Surveillance for common disease and health risk factors among students” in Guangdong Province. Informed consent was obtained from the parents or legal guardians of any participants under 16 years of age.
Consent for publication
Not applicable.
Copyright
© The Author(s) 2025.
Supplementary Materials
REFERENCES
1. World Health Organization. Obesity and overweight. Available from: https://www.who.int/news-room/fact-sheets/detail/obesity-and-overweight. [Last accessed on 12 Dec 2025].
2. Risk Factor Collaboration (NCD-RisC). Worldwide trends in body-mass index, underweight, overweight, and obesity from 1975 to 2016: a pooled analysis of 2416 population-based measurement studies in 128·9 million children, adolescents, and adults. Lancet. 2017;390:2627-42.
3. Wang Y, Zhao L, Gao L, Pan A, Xue H. Health policy and public health implications of obesity in China. Lancet Diabetes Endocrinol. 2021;9:446-61.
4. Dong Y, Jan C, Ma Y, et al. Economic development and the nutritional status of Chinese school-aged children and adolescents from 1995 to 2014: an analysis of five successive national surveys. Lancet Diabetes Endocrinol. 2019;7:288-99.
5. Hu J, Liu J, Wang J, et al. Unfavorable progression of obesity in children and adolescents due to COVID-19 pandemic: a school-based survey in China. Obesity. 2021;29:1907-15.
6. Yang Y, Dai J, Huang S, et al. Secular trends of the prevalence of emaciation, overweight, and obesity among school-aged children in Yunnan province, 1985-2019: a serial cross-sectional surveillance study in China. Front Nutr. 2022;9:1037188.
7. Chen H, Wang LJ, Xin F, Liang G, Chen Y. Associations between sleep duration, sleep quality, and weight status in Chinese children and adolescents. BMC Public Health. 2022;22:1136.
8. Yang D, Luo C, Feng X, et al. Changes in obesity and lifestyle behaviours during the COVID-19 pandemic in Chinese adolescents: a longitudinal analysis from 2019 to 2020. Pediatr Obes. 2022;17:e12874.
9. Yang Y, Zhang M, Yu J, et al. Nationwide trends of pediatric obesity and BMI z-score from 2017-2021 in China: comparable findings from real-world mobile- and hospital-based data. Front Endocrinol. 2022;13:859245.
10. Jiang X, Zhao X, Zhou J, Zhang X, Song Y, Zhao L. The relationship between family function and the incidence of overweight/obesity in children and adolescents in Chengdu city, Sichuan province of China: based on latent profile analysis. BMC Public Health. 2023;23:2272.
11. Zhang X, Zhao G, Ma J, et al; ES-SCI Work Group. Design, methodology, and baseline of eastern China student health and wellbeing cohort study. Front Public Health. 2023;11:1100227.
12. Dong YH, Chen L, Liu JY, et al. [Epidemiology and prediction of overweight and obesity among children and adolescents aged 7-18 years in China from 1985 to 2019]. Zhonghua Yu Fang Yi Xue Za Zhi. 2023;57:11-9.
13. Dang JJ, Cai S, Zhong PL, et al. [Association of outdoor artificial light at night exposure with overweight and obesity among children and adolescents aged 9 to 18 years in China]. Beijing Da Xue Xue Bao Yi Xue Ban. 2023;55:421-8.
14. Liu Y, Sun X, Zhang E, et al. Association between types of screen time and weight status during the COVID-19 pandemic: a longitudinal study in children and adolescents. Nutrients. 2023;15:2055.
15. Dong WH, Gu TM, Zhu BQ, et al. Comparison of anthropometric parameters and laboratory test results before and after the COVID-19 outbreak among Chinese children aged 3-18 years. Front Public Health. 2023;11:1048087.
16. Shu W, Li M, Xiao H, et al. Validation of “Life’s essential 8” metrics with cardiovascular structural status in children: the PROC study in China. J Am Heart Assoc. 2023;12:e029077.
17. Peng L, Hu R, Feng Y, Shi W, Zhao L, Jiang L. The relationship between family diet consumption, family environment, parent anxiety and nutrition status children during the COVID-19 pandemic: a longitudinal study. Front Public Health. 2023;11:1228626.
18. Yip KM, So HK, Wong WHS, et al. Dynamics of childhood obesity in Hong Kong throughout the COVID-19 pandemic before and after the school closures: a 3-year longitudinal study. Public Health. 2024;226:80-3.
19. National Bureau of Statistics of China. Statistical yearbook of China. Available from: https://www.stats.gov.cn/english/Statisticaldata/yearbook/. [Last accessed on 12 Dec 2025].
20. Cunningham SA, Hardy ST, Jones R, Ng C, Kramer MR, Narayan KMV. Changes in the incidence of childhood obesity. Pediatrics. 2022;150:e2021053708.
21. Ikeda N, Nishi N. First incidence and associated factors of overweight and obesity from preschool to primary school: longitudinal analysis of a national cohort in Japan. Int J Obes. 2019;43:751-60.
22. Li X, Memarian E, Sundquist J, Zöller B, Sundquist K. Neighbourhood deprivation, individual-level familial and socio-demographic factors and diagnosed childhood obesity: a nationwide multilevel study from Sweden. Obes Facts. 2014;7:253-63.
23. National Health and Family Planning Commission of the PRC. Screening standard for malnutrition of school-age children and adolescents (WS/T 456-2014). Available from: https://www.ndcpa.gov.cn/jbkzzx/c100202/common/content/content_1666358027003695104.html. [Last accessed on 12 Dec 2025].
24. National Health and Family Planning Commission of the PRC. Screening for overweight and obesity among school-age children and adolescents (WS/T 586-2018). Available from: https://www.ndcpa.gov.cn/jbkzzx/c100202/common/content/content_1666364400852602880.html. [Last accessed on 12 Dec 2025].
25. Consonni D, Coviello E, Buzzoni C, Mensi C. A command to calculate age-standardized rates with efficient interval estimation. The Stata Journal: Promoting communications on statistics and Stata. 2012;12:688-701.
26. The State Council Information Office of the People’s Republic of China. Press briefing for the report on Chinese residents’ chronic diseases and nutrition (2020). Available from: http://www.scio.gov.cn/xwfb/gwyxwbgsxwfbh/wqfbh_2284/2020n_4408/2020n12y23rsw/. [Last accessed on 12 Dec 2025].
27. Zhang L, Chen J, Zhang J, et al. Regional disparities in obesity among a heterogeneous population of Chinese children and adolescents. JAMA Netw Open. 2021;4:e2131040.
28. Jia P, Ma S, Qi X, Wang Y. Spatial and temporal changes in prevalence of obesity among Chinese children and adolescents, 1985-2005. Prev Chronic Dis. 2019;16:E160.
29. Zhao R, Zhao L, Gao X, et al. Geographic variations in dietary patterns and their associations with overweight/obesity and hypertension in China: Findings from China Nutrition and Health Surveillance (2015-2017). Nutrients. 2022;14:3949.
30. Ma Q, Chen T, Liu J, et al. Influence of parental and offspring dietary behaviors on the association of overweight and obesity between two generations: results from a cross-sectional analysis of parent-offspring trios in China. Nutrients. 2022;14:4625.
31. Chami N, Preuss M, Walker RW, Moscati A, Loos RJF. The role of polygenic susceptibility to obesity among carriers of pathogenic mutations in MC4R in the UK Biobank population. PLoS Med. 2020;17:e1003196.
32. Lecorguillé M, Schipper M, O’Donnell A, et al. Parental lifestyle patterns around pregnancy and risk of childhood obesity in four European birth cohort studies. Lancet Glob Health. 2023;11:S5.
33. Qi Y, Lv R, Zhao M, et al. Associations between parental adherence to healthy lifestyles and risk of obesity in offspring: a prospective cohort study in China. Lancet Glob Health. 2023;11:S6.
34. Kim MS, Shim I, Fahed AC, et al. Association of genetic risk, lifestyle, and their interaction with obesity and obesity-related morbidities. Cell Metab. 2024;36:1494-503.e3.
35. Epstein LH, Wilfley DE, Kilanowski C, et al. Family-based behavioral treatment for childhood obesity implemented in pediatric primary care: a randomized clinical trial. JAMA. 2023;329:1947-56.
36. Wang X, Sun Z, Liu QS, Zhou Q, Jiang G. Environmental obesogens and their perturbations in lipid metabolism. Environ Health. 2024;2:253-68.
37. Hong Y, Feng Y, Yan T, et al. Take-out food enhances the risk of MPs ingestion and obesity, altering the gut microbiome in young adults. J Hazard Mater. 2024;476:135125.
38. Wei G, Zhang K, Shen FJ, et al. Low-dose polystyrene microplastics exposure increases susceptibility to obesity-induced MASLD via disrupting intestinal barrier integrity and gut microbiota homeostasis. Ecotoxicol Environ Saf. 2025;299:118310.
39. Zhai Z, Yang Y, Chen S, Wu Z. Long-term exposure to polystyrene microspheres and high-fat diet-induced obesity in mice: evaluating a role for microbiota dysbiosis. Environ Health Perspect. 2024;132:97002.
40. Woolford SJ, Sidell M, Li X, et al. Changes in body mass index among children and adolescents during the COVID-19 pandemic. JAMA. 2021;326:1434-6.
41. Jia P, Zhang L, Yu W, et al. Impact of COVID-19 lockdown on activity patterns and weight status among youths in China: the COVID-19 Impact on Lifestyle Change Survey (COINLICS). Int J Obes. 2021;45:695-9.
42. Xu L, Lam TH. Stage of obesity epidemic model: Learning from tobacco control and advocacy for a framework convention on obesity control. J Diabetes. 2018;10:564-71.
43. Pan XF, Wang L, Pan A. Epidemiology and determinants of obesity in China. Lancet Diabetes Endocrinol. 2021;9:373-92.
44. Wang VH, Min J, Xue H, et al. What factors may contribute to sex differences in childhood obesity prevalence in China? Public Health Nutr. 2018;21:2056-64.
45. Wisniewski AB, Chernausek SD. Gender in childhood obesity: family environment, hormones, and genes. Gend Med. 2009;6:76-85.
46. Pfannenberg C, Werner MK, Ripkens S, et al. Impact of age on the relationships of brown adipose tissue with sex and adiposity in humans. Diabetes. 2010;59:1789-93.
47. Nookaew I, Svensson PA, Jacobson P, et al. Adipose tissue resting energy expenditure and expression of genes involved in mitochondrial function are higher in women than in men. J Clin Endocrinol Metab. 2013;98:E370-8.
48. Reicks M, Banna J, Cluskey M, et al. Influence of parenting practices on eating behaviors of early adolescents during independent eating occasions: implications for obesity prevention. Nutrients. 2015;7:8783-801.
49. de Bont J, Díaz Y, Casas M, García-Gil M, Vrijheid M, Duarte-Salles T. Time trends and sociodemographic factors associated with overweight and obesity in children and adolescents in Spain. JAMA Netw Open. 2020;3:e201171.
50. Cunningham SA, Kramer MR, Narayan KM. Incidence of childhood obesity in the United States. N Engl J Med. 2014;370:403-11.
Cite This Article
How to Cite
Download Citation
Export Citation File:
Type of Import
Tips on Downloading Citation
Citation Manager File Format
Type of Import
Direct Import: When the Direct Import option is selected (the default state), a dialogue box will give you the option to Save or Open the downloaded citation data. Choosing Open will either launch your citation manager or give you a choice of applications with which to use the metadata. The Save option saves the file locally for later use.
Indirect Import: When the Indirect Import option is selected, the metadata is displayed and may be copied and pasted as needed.
About This Article
Special Topic
Copyright

Data & Comments
Data
0


Comments
Comments must be written in English. Spam, offensive content, impersonation, and private information will not be permitted. If any comment is reported and identified as inappropriate content by OAE staff, the comment will be removed without notice. If you have any queries or need any help, please contact us at [email protected].