


Lifestyle factors as mediators in the relationship between depression, obesity, and blood pressure in the post-pandemic era
 0
0 Abstract
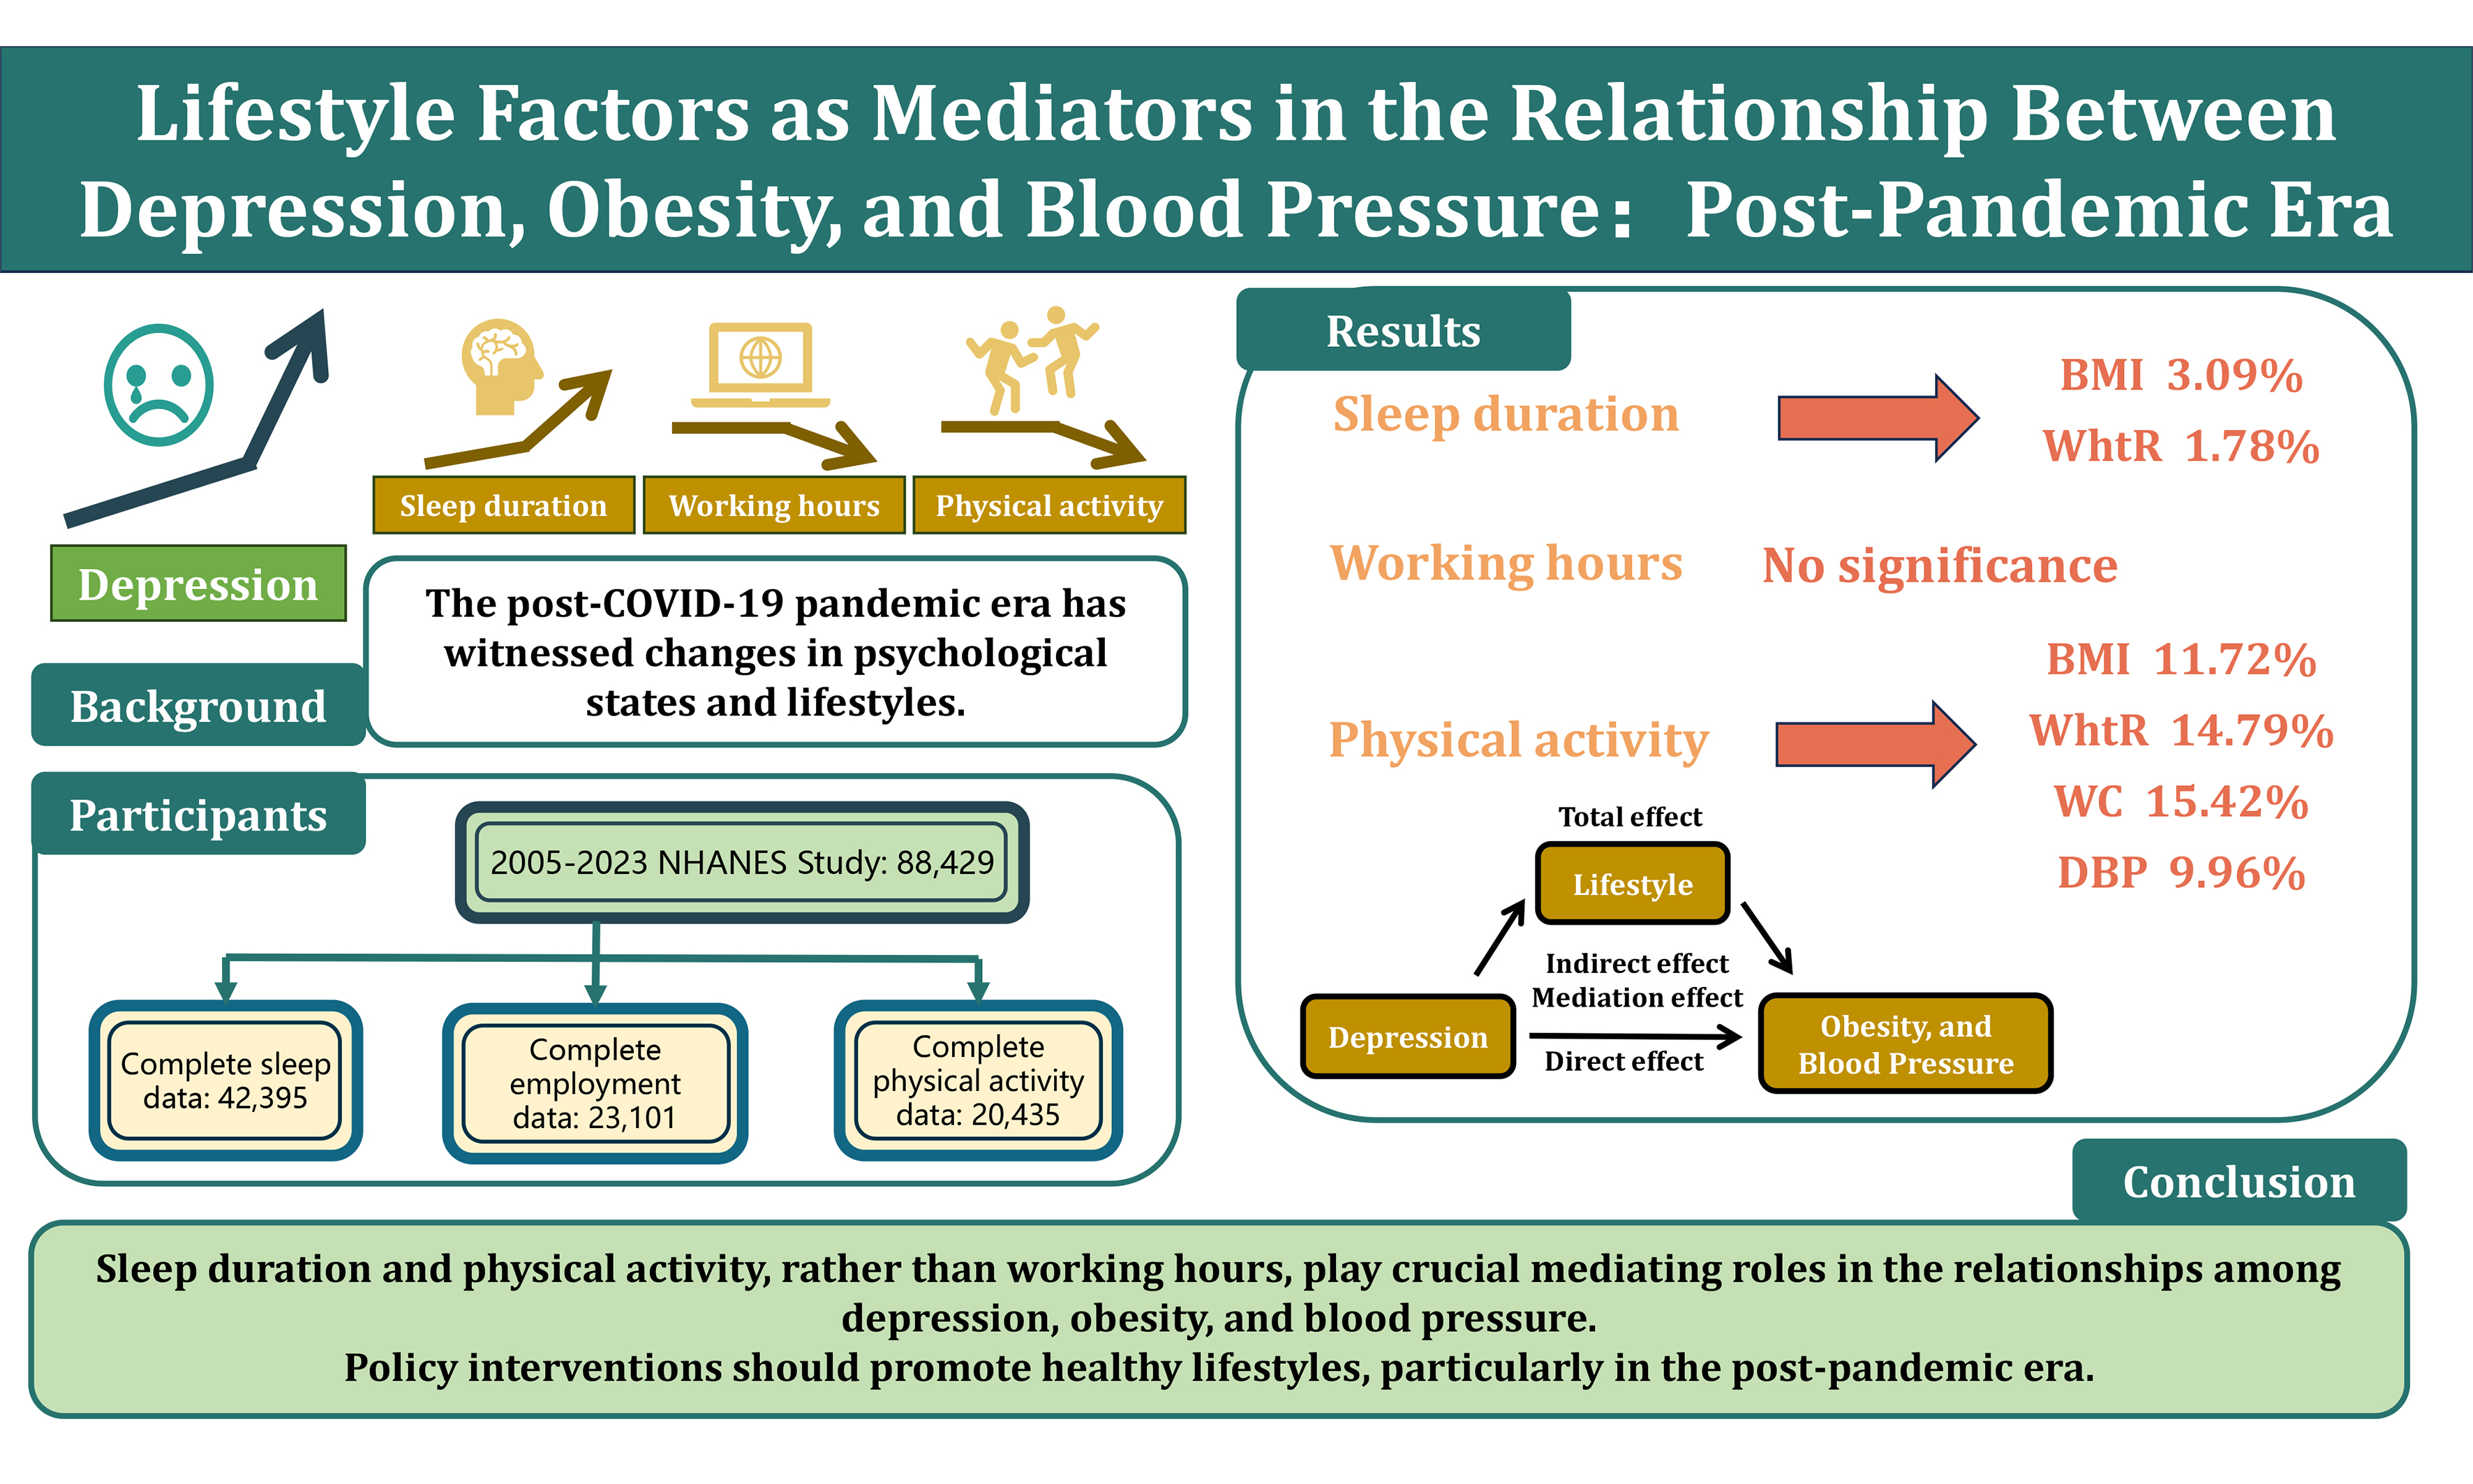
Aim: The post-COVID-19 pandemic era has witnessed changes in psychological states and lifestyles. This study aims to explore the associations between depression, obesity, and hypertension, and further assess the mediating effects of lifestyle factors such as sleep duration, working hours, and physical activity on these disease relationships.
Methods: Using data from the National Health and Nutrition Examination Survey (NHANES) from 2005 to 2023, we calculated long-term trends in depression, sleep duration, working hours, metabolic equivalent of exercise, obesity, and blood pressure. Data from 42,395 (sleep duration), 23,101 (working hours), and 20,435 participants (physical activity) were used to evaluate the relationships between lifestyle factors, depression, obesity, and blood pressure.
Results: Between 2021 and 2023, the average depression score in the U.S. increased to 4.13 (4.74), with prevalence rising to 13.2%. Over the past 18 years, national body mass index (BMI), waist circumference (WC), waist-to-height ratio (WHtR), and sleep duration increased (P < 0.001), while working hours decreased (P < 0.001) and physical activity declined post-pandemic (P < 0.001). Depression was positively correlated with BMI, WC, WHtR, and diastolic blood pressure (DBP) (P < 0.0001), and negatively correlated with systolic blood pressure, sleep duration, and physical activity (P < 0.0001). Sleep duration and physical activity mediated 1.72%-4.52% and 9.28%-14.79%, respectively, of the positive correlation between depression and obesity. Physical activity mediated 5.49%-9.96% of the positive correlation between depression and DBP. No mediating effect of working hours was found between depression and obesity or blood pressure (P = 0.500-0.936).
Conclusion: In the post-COVID-19 pandemic era, this study advocates for increased attention to lifestyle factors. Moderate extensions in sleep duration, reductions in working hours, and increased physical activity may help alleviate the burdens of depression, obesity, and blood pressure.
Keywords
INTRODUCTION
Depression has emerged as a major global health challenge. Over the past decade, the burden of depression has increased rapidly, significantly contributing to the global health burden. By 2021, approximately 332 million people worldwide were affected by depression, with this number continuing to rise[1]. The COVID-19 pandemic has further exacerbated the prevalence of depression[2-5]. During the pandemic, the prevalence of depression in the United States was more than three times higher than pre-pandemic levels[6]. Moreover, many COVID-19 survivors continue to face persistent mental health issues. A recent meta-analysis indicates that the prevalence of depression remains as high as 18% within two years post-COVID-19 infection[7]. Therefore, addressing the epidemic of depression and preventing the development of adverse psychological and physiological conditions is crucial, necessitating a multifaceted evaluation of feasible interventions.
Obesity and hypertension are significant chronic non-communicable diseases globally, affecting approximately 1 billion[8,9] and 1.28 billion[10,11] people, respectively. These conditions not only independently increase the risk of cardiovascular disease (CVD) but also frequently co-occur with depression[12,13]. The comorbidity of hypertension and depression, in particular, has been associated with increased cardiovascular mortality[14]. However, research has identified sleep disorders as a mediating factor between depression and obesity[15], while physical activity plays a crucial bridging role between depression and overweight/obesity[16,17]. Post-COVID-19 pandemic lifestyle changes may have profound implications for the onset and progression of mental health issues, obesity, and metabolic diseases such as hypertension[18-21]. Despite the significant economic and interventional potential in this field, related research remains relatively scarce.
This study aims to explore the mediating role of lifestyle factors in the relationship between depression, obesity, and blood pressure-related indicators in the post-COVID-19 pandemic context, utilizing National Health and Nutrition Examination Survey (NHANES) data from 2005 to 2023. Through this research, we hope to elucidate the potential of lifestyle factors in improving the interplay between mental health and metabolic diseases, providing a theoretical basis for clinical interventions and public health policies.
METHODS
Study design and study population
The NHANES is a nationally representative, long-term survey conducted over a two-year cycle for over 50 years to assess the physical health status of the U.S. population. The NHANES protocol was approved by the Ethics Review Board of the National Center for Health Statistics at the Centers for Disease Control and Prevention (CDC), and all participants provided written informed consent. Detailed methods of the NHANES design and data collection have been published elsewhere[22]. The study followed the Strengthening the Reporting of Observational Studies in Epidemiology (STROBE) reporting guideline. Since 2005, NHANES has included data on depression. A total of 88,429 participants were enrolled from 2005 to 2023. After excluding 43,264 participants with missing depression data, 1,550 participants with missing anthropometric data, and 1,055 participants with missing blood pressure data, 42,560 participants remained. To ensure adequate sample sizes, further exclusions for missing data on sleep, work, or physical activity resulted in three independent samples: 42,395, 23,101, and 20,435 participants, respectively [Figure 1].
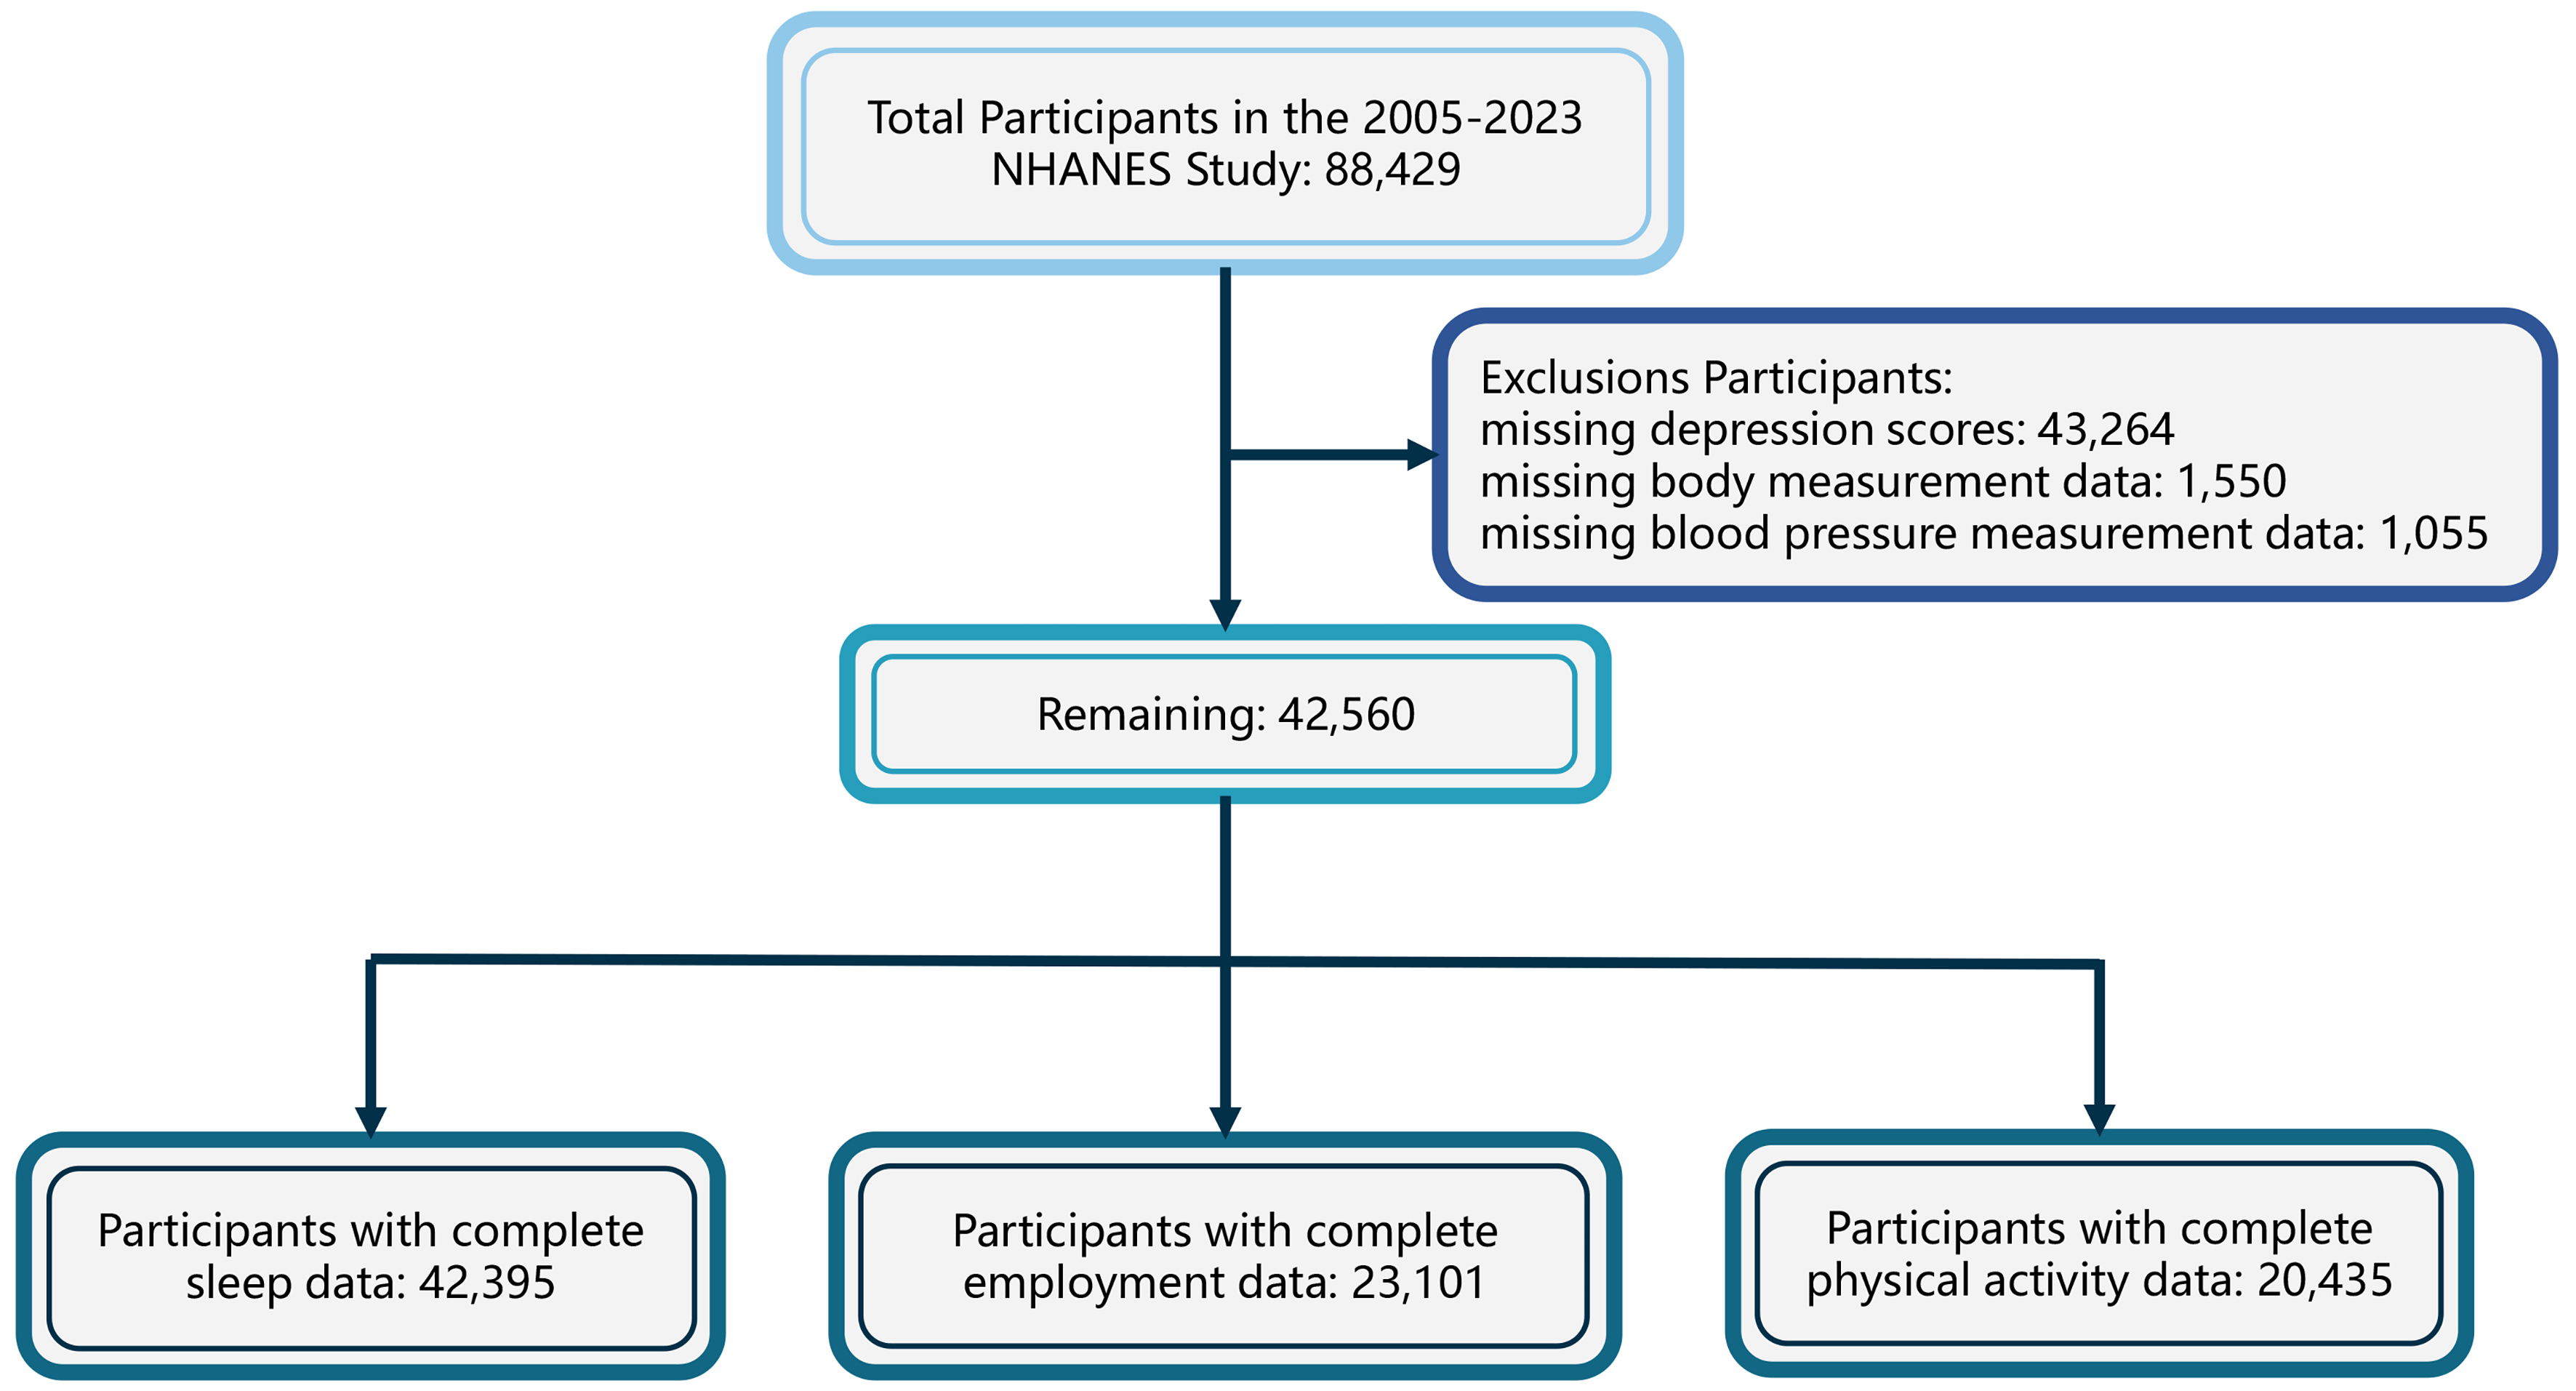
Figure 1. Study population recruitment and discharge flow diagram. NHANES: National Health and Nutrition Examination Survey.
Assessment of depression, lifestyle factors, obesity, and blood pressure
Depression severity was assessed using the Patient Health Questionnaire (PHQ-9), which evaluates depressive symptoms over the past two weeks [Supplementary Materials]. Scores range from 0 to 27, with scores ≤ 9 indicating no depression and > 9 indicating depression[23]. Lifestyles were assessed via questionnaires. Sleep duration was defined as the number of hours of sleep on weekdays, calculated as the difference between wake-up and bedtime when necessary. Work hours were defined as weekly hours worked, with a minimum of 5 h for those working < 5 h and a maximum of 80 h for those working > 80 h. Physical activity was calculated using the International Physical Activity Questionnaire Short Form (IPAQ) and metabolic equivalent (MET), quantifying moderate- and vigorous-intensity physical activity per week[24,25]. We defined 1 min of moderate-intensity activity as 10/3 METs and 1 min of vigorous-intensity activity as 20/3 METs. Anthropometric data were obtained from the Mobile Examination Center (MEC), including height, weight, body mass index (BMI), and waist circumference (WC). The waist-to-height ratio (WHtR) was calculated by dividing WC (cm) by height (cm). Blood pressure measurements were taken at multiple time points by MEC staff, with participants having at least three readings. Systolic (SBP) and diastolic blood pressure (DBP) were defined as the average of these readings. Finally, BMI, WC, WHtR, SBP, and DBP were used to assess obesity and blood pressure status.
Assessment of covariates
Covariate selection was guided by prior studies, logical reasoning, and directed acyclic graph (DAG) modeling [Supplementary Figure 1]. Distal confounders, including age (< 40, 40-60, ≥ 60), sex, and race/ethnicity (non-Hispanic Black, non-Hispanic White, Mexican American, other), were included. Socioeconomic variables, such as family income-to-poverty ratio (≤ 1, 1-3, > 3) and marital status (cohabiting or living alone), were considered potential influences on mood and lifestyle. Diabetes (yes/no) was included due to its potential impact on both mood and metabolism. Chronic diseases (yes/no), which can affect mood, were also considered as confounders. Smoking status (never, former, current) was included as a potential confounder for hypertension, and alcohol consumption (never/almost never, former, current) for metabolic outcomes. Hypertension was defined as SBP > 140 mmHg, DBP > 90 mmHg, a prior diagnosis, or current antihypertensive use. Diabetes was defined as fasting blood glucose > 7.0 mmol/L, HbA1c > 6.5%, a previous diagnosis, or current use of antidiabetic medications. Comorbidities, including coronary artery disease, heart failure, poorly controlled asthma, arthritis, stroke, liver disease, and cancer, were included as comorbidity variables for analysis.
Statistical analysis
We accounted for the complex survey design of NHANES, including sample weights, clustering, and stratification. Continuous variables were summarized by means and standard deviations (SD), while categorical variables were reported as counts and percentages (weighted percentages). Missing data were imputed using the random forest (RF) algorithm. All statistical analyses were conducted using R software (version 4.3.2), and a two-sided P-value < 0.05 was considered statistically significant.
Weighted analyses were used to examine trends in depression, lifestyle factors, obesity, and blood pressure over the past decade, with results displayed in line graphs. Due to its skewed distribution, physical activity MET values were log-transformed. Group comparisons were made using Kruskal-Wallis, Analysis of Variance (ANOVA), or chi-square tests. In the largest sleep sample (N = 42,395), generalized linear models (GLMs) were used to estimate effect sizes and standard errors between depression scores, lifestyle factors, and five obesity or blood pressure indicators. Mediation analysis was performed using the “mediation” package in R, accounting for NHANES complex survey design (including sample weights, clustering, and stratification). A bootstrap method with 1,000 iterations was applied to calculate the total, direct, and indirect mediation effects of depression on obesity and blood pressure, including 95% confidence intervals (CIs) and proportions of mediation.
In sensitivity analysis, structural equation modeling (SEM) was conducted using the “lavaan” package to assess mediation effects of depression through lifestyle factors on obesity and blood pressure, estimating total, direct, and indirect effects with 95%CIs. All model parameters were optimized using Nonlinear Minimization (NLMINB), considering sample weights but not clustering or stratification. Standardized coefficients on the Latent Variable Scale (Std.lv) and All Variables Scale (Std.all) were used to assess result robustness. Consistency between Std.lv and Std.all coefficients indicated model robustness across different scales. Results from primary and sensitivity analyses were considered robust when consistent.
RESULTS
Baseline characteristics
The findings of this study represent 241,746,897 U.S. adults, with an overall depression prevalence of 8.62%. Table 1 presents the characteristics of participants. Individuals with depression were younger, more likely to be female, non-Hispanic Black, have lower educational attainment, live alone, and report poorer economic status. Participants with depression were also more likely to smoke, have shorter sleep durations, work fewer hours, and engage in lower levels of physical activity. Additionally, individuals with depression had higher BMI, DBP, and a higher prevalence of comorbidities such as hypertension, diabetes, and hyperlipidemia.
Baseline characteristics of NHANES participants from 2005-2023 grouped by depression statusa
| Characters | Overall | No depressionc | Depressionc | P |
| Weighted numberb | 241,746,897 | 220,906,519 | 20,840,378 | |
| Unweighted numberb | 50,255 | 45,386 | 4,869 | |
| Age, years | 46.85 (17.60) | 46.94 (17.65) | 45.86 (17.11) | 0.004 |
| Age group (%) | ||||
| < 40 | 17,992 (38.1) | 16,325 (38.0) | 1,667 (39.4) | 0.001 |
| 40-60 | 15,261 (35.3) | 13,583 (35.1) | 1,678 (37.3) | |
| ≥ 60 | 17,002 (26.6) | 15,478 (26.9) | 1,524 (23.3) | |
| Sex (%) | ||||
| Male | 24,520 (48.8) | 22,685 (49.9) | 1,835 (37.3) | < 0.001 |
| Female | 25,735 (51.2) | 22,701 (50.1) | 3,034 (62.7) | |
| Race/Ethnicity (%) | ||||
| Non-hispanic black | 10,796 (11.1) | 9,754 (10.9) | 1,042 (13.0) | < 0.001 |
| Non-hispanic white | 21,539 (66.2) | 19,446 (66.5) | 2,093 (62.4) | |
| Mexican American | 7,263 (8.4) | 6,582 (8.4) | 681 (8.2) | |
| Others | 10,657 (14.4) | 9,604 (14.1) | 1,053 (16.5) | |
| Education (%) | ||||
| Less than high school | 13,136 (16.8) | 11,410 (16.0) | 1,726 (25.2) | < 0.001 |
| High school or equivalent | 25,349 (53.7) | 22,772 (53.2) | 2,577 (59.2) | |
| College or above | 11,770 (29.5) | 11,204 (30.8) | 566 (15.6) | |
| Marital status (%) | ||||
| Living with partner | 25,082 (55.2) | 23,358 (56.7) | 1,724 (38.5) | < 0.001 |
| Living alone | 25,173 (44.8) | 22,028 (43.3) | 3,145 (61.5) | |
| Family income-to-poverty ratio (%) | ||||
| ≤ 1.0 | 9,549 (14.2) | 8,005 (12.9) | 1,544 (28.1) | < 0.001 |
| 1.0-3.0 | 18,677 (35.4) | 16,722 (34.6) | 1,955 (43.8) | |
| > 3.0 | 17,136 (50.5) | 16,298 (52.6) | 838 (28.1) | |
| Smoking (%) | ||||
| Never | 27,756 (56.6) | 25,654 (57.9) | 2,102 (42.6) | < 0.001 |
| Former | 11,739 (24.6) | 10,640 (24.8) | 1,099 (22.6) | |
| Current | 9,403 (18.8) | 7,826 (17.3) | 1,577 (34.8) | |
| Drinking (%) | ||||
| Never/Almost never | 6,641 (10.9) | 6,045 (11.0) | 596 (10.4) | < 0.001 |
| Former | 5,629 (10.2) | 4,970 (9.9) | 659 (13.5) | |
| Current | 33,450 (78.9) | 30,386 (79.1) | 3,064 (76.1) | |
| PHQ-9 scores | 3.22 (4.31) | 2.19 (2.43) | 14.15 (4.76) | < 0.001 |
| Sleep duration, hours/day | 7.27 (1.47) | 7.29 (1.41) | 7.05 (2.01) | < 0.001 |
| Work time, hours/week | 40.55 (14.30) | 40.69 (14.25) | 38.41 (14.96) | < 0.001 |
| Moderate PA, hours/week | 3.73 (4.83) | 3.72 (4.80) | 3.79 (5.26) | 0.707 |
| Vigorous PA, hours/week | 3.79 (4.22) | 3.81 (4.17) | 3.36 (5.13) | 0.043 |
| Log-transformed MET-mins/week | 6.73 (1.09) | 6.75 (1.08) | 6.47 (1.22) | < 0.001 |
| Height, cm | 168.54 (10.02) | 168.75 (10.00) | 166.37 (9.90) | < 0.001 |
| Weight, cm | 83.11 (22.03) | 82.95 (21.80) | 84.88 (24.25) | < 0.001 |
| BMI, kg/m2 | 29.17 (7.03) | 29.04 (6.89) | 30.64 (8.29) | < 0.001 |
| WC, cm | 99.28 (16.83) | 99.03 (16.67) | 101.92 (18.31) | < 0.001 |
| WHtR | 0.59 (0.10) | 0.59 (0.10) | 0.61 (0.11) | < 0.001 |
| High WHtR level (%) | 41,518 (81.2) | 37,349 (80.9) | 4,169 (84.2) | < 0.001 |
| SBP, mmHg | 121.80 (17.13) | 121.87 (17.08) | 121.06 (17.74) | 0.026 |
| DBP, mmHg | 71.36 (11.95) | 71.30 (11.92) | 72.04 (12.24) | 0.002 |
| Hypertension (%) | 20,834 (37.1) | 18,387 (36.3) | 2,447 (45.9) | < 0.001 |
| Diabetes (%) | 8,748 (13.4) | 7,528 (12.8) | 1,220 (19.8) | < 0.001 |
| Hyperlipidemia (%) | 34,021 (67.3) | 30,453 (66.9) | 3,568 (71.5) | < 0.001 |
| Comorbidity model (%) d | 20,612 (39.5) | 17,767 (38.0) | 2,845 (56.2) | < 0.001 |
| Coronary heart disease (%) | 3,565 (5.9) | 2,949 (5.5) | 616 (10.4) | < 0.001 |
| Congestive heart failure (%) | 1,631 (2.4) | 1,301 (2.1) | 330 (5.5) | < 0.001 |
| Stroke (%) | 1,913 (2.9) | 1,520 (2.6) | 393 (6.8) | < 0.001 |
| Poorly controlled asthma (%) | 4,559 (8.9) | 3,717 (8.1) | 842 (17.7) | < 0.001 |
| Liver disease (%) | 1,153 (2.1) | 892 (1.9) | 261 (5.0) | < 0.001 |
| Arthritis (%) | 4,966 (25.8) | 4,405 (24.4) | 561 (40.4) | < 0.001 |
| Cancer (%) | 13,694 (10.3) | 11,608 (10.1) | 2,086 (11.6) | 0.074 |
Long-term trends in depression, lifestyle, obesity, and blood pressure
Among participants from 2021 to 2023, the mean depression score was 4.13 (SD = 4.74), with a prevalence of 13.2%, marking a significant increase compared to the lower, fluctuating levels observed over the past 18 years [Figure 2 and Supplementary Table 1]. Over the past 18 years, BMI, WC, and WHtR have shown upward trends [Supplementary Figures 2-6 and Supplementary Tables 2-6]. Compared to 2015, the 2023 SBP decreased from 120.76 mmHg (SD = 17.35) to 118.46 mmHg (SD = 17.13), while DBP increased from 67.95 mmHg (SD = 12.80) to 72.67 mmHg (SD = 11.37). The average nightly sleep duration increased from 6.93 h (SD = 1.39) in 2015 to 7.74 h (SD = 1.55) in 2023. Weekly working hours for employed individuals decreased from 41.99 h (SD = 14.81) to 39.54 h (SD = 13.93). Physical activity (measured in weekly MET-minutes) increased from 1,469.31 (SD = 1648.18) in 2017 to 1,566.61 (SD = 2,618.95) in 2023; however, its natural logarithmic value decreased from 6.79 (SD = 1.04) to 6.61 (SD = 1.32).
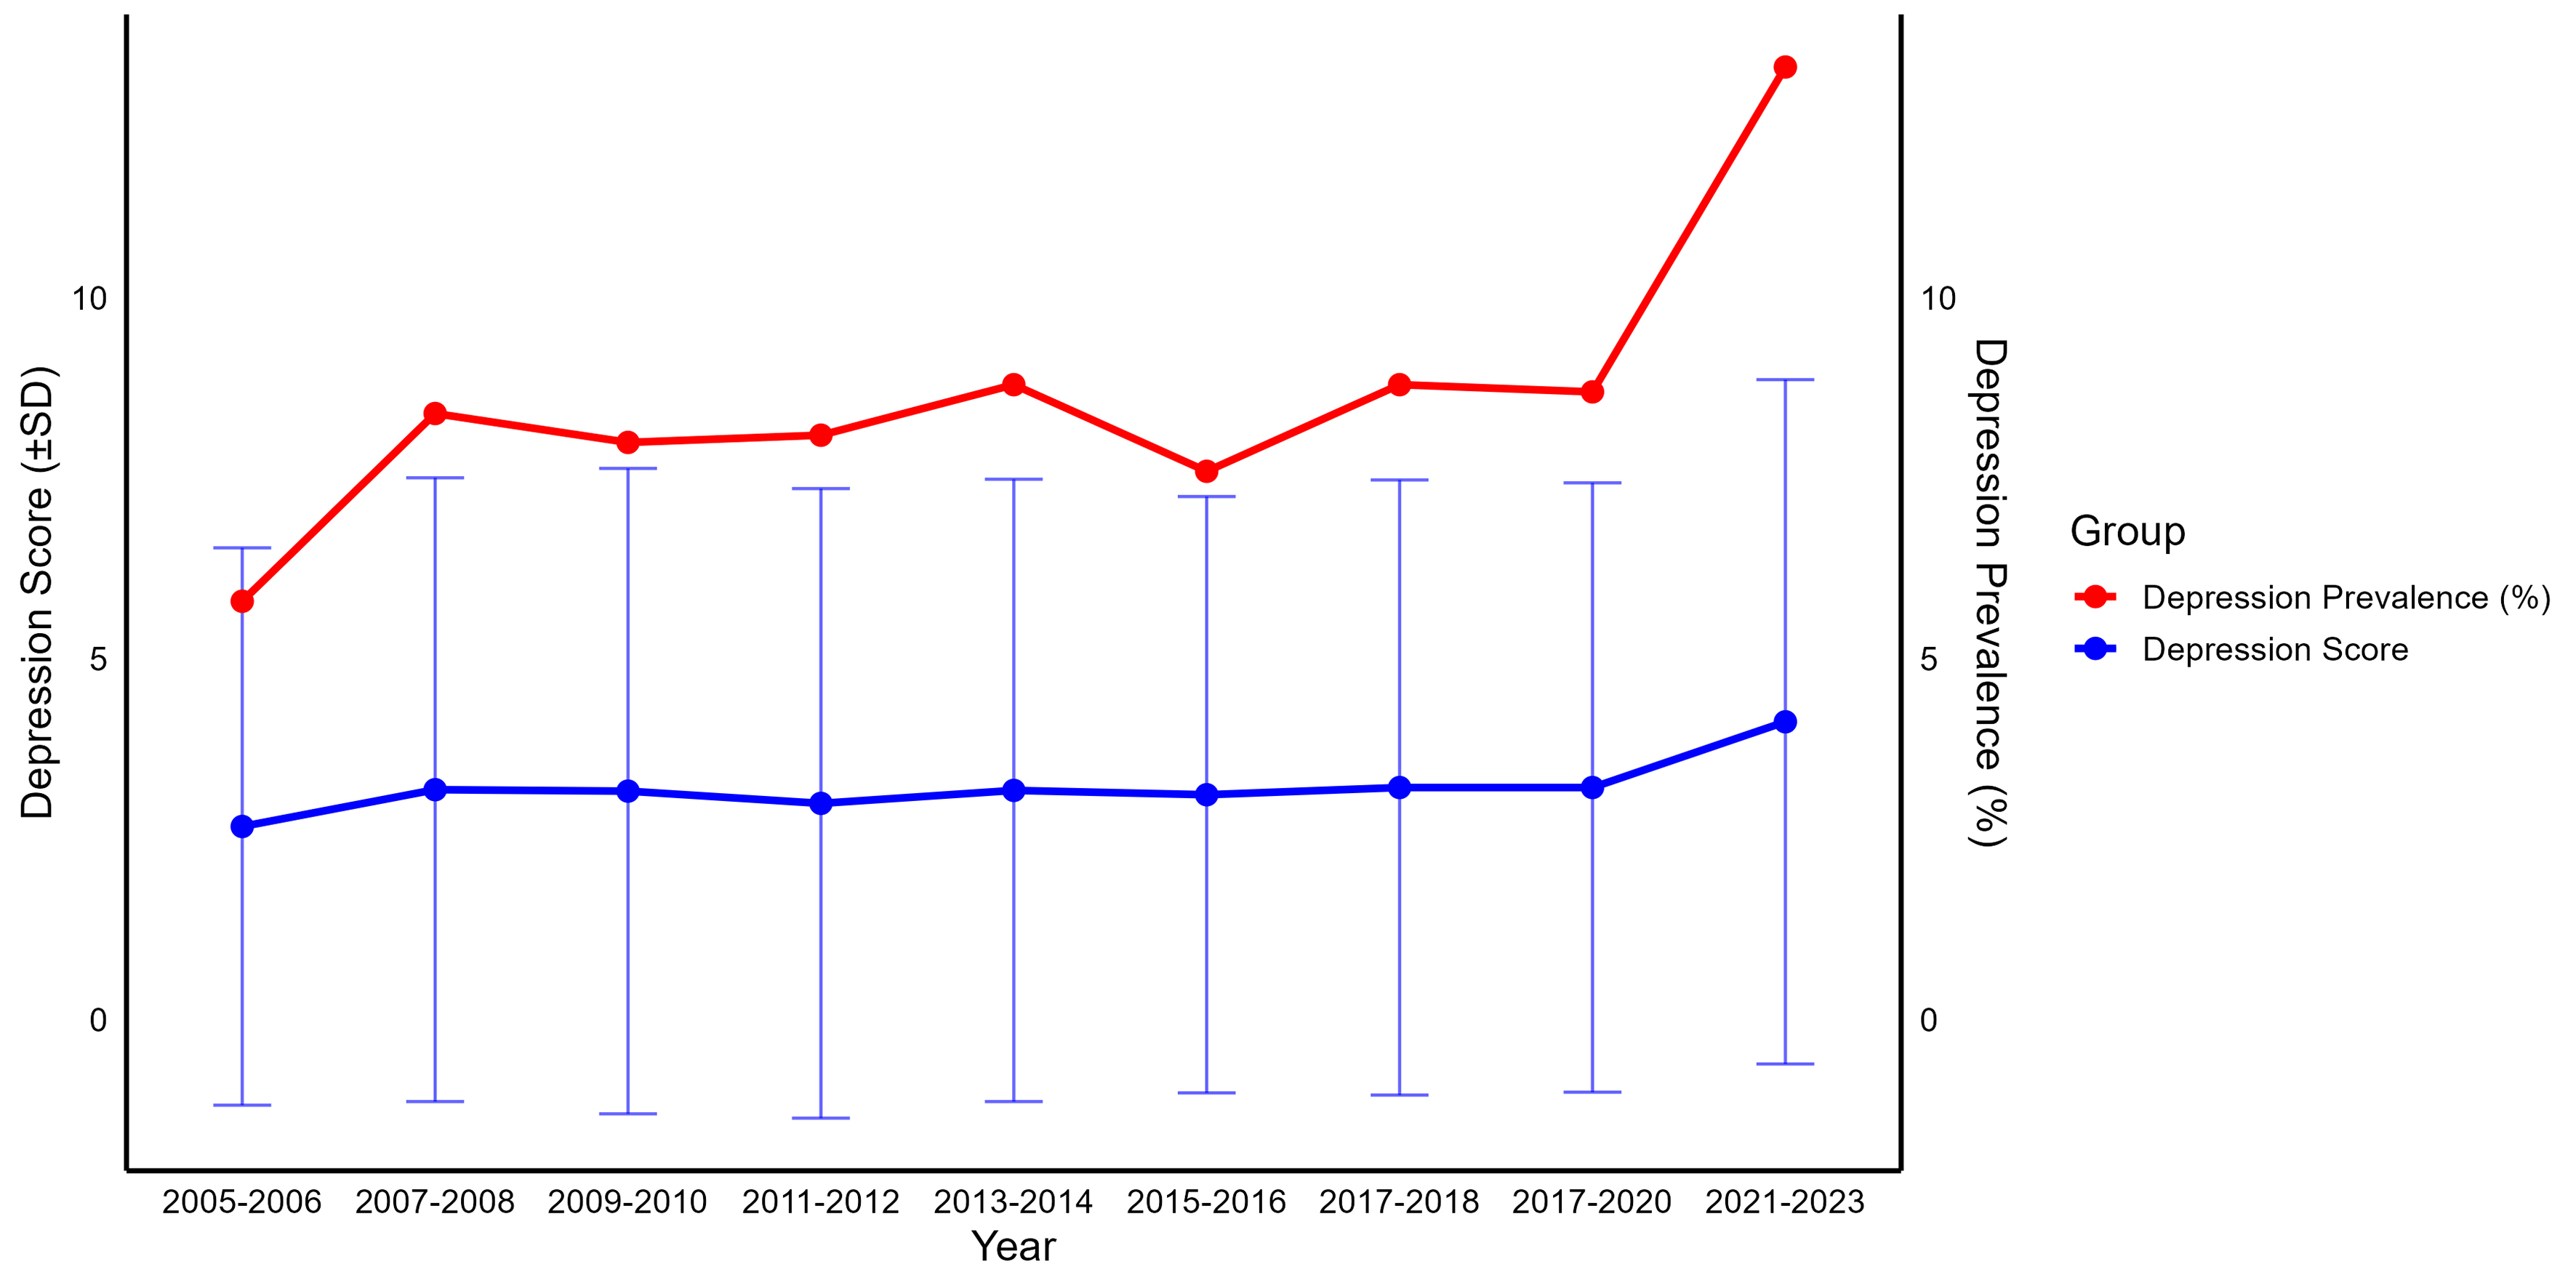
Figure 2. Trends in depression prevalence and scores among Americans from 2005 to 2023. Based on complex sampling weighted analysis, the study used the weights from each interview period, representing a total of 1,818,136,185 Americans. Due to the COVID-19 pandemic, sampling was paused in 2019-2020, resulting in a small sample size. As a result, the 2019-2020 period was combined with the 2017-2018 period into a single group. Participants in the 2017-2018 and 2017-2020 periods theoretically overlap.
Associations between depression, lifestyle, obesity, and blood pressure
After adjusting for gender, age, race/ethnicity, marital status, education level, poverty-income ratio, smoking, alcohol consumption, hypertension, diabetes, dyslipidemia, and comorbidities, depression scores were significantly positively correlated with BMI (β = 0.099, SE = 0.011), WC (β = 0.246, SE = 0.026), WHtR (β = 0.00153, SE = 0.00016), and DBP (β = 0.088, SE = 0.017), and negatively correlated with SBP (β = -0.120, SE = 0.024) [Supplementary Table 7]. Sleep duration and physical activity were negatively associated with depression (P < 0.0001) [Supplementary Table 8]. Both sleep duration and physical activity were negatively correlated with obesity (P < 0.0001 to P = 0.0027). Weekly working hours were positively correlated with obesity (P < 0.0001) and DBP (P = 0.0002), but no significant correlation with SBP (P = 0.9) [Supplementary Table 9].
Mediating effects of lifestyle factors in the relationship between depression, obesity, and blood pressure
Table 2 presents the results of the mediation analysis using bootstrap resampling, accounting for NHANES complex survey weights, clustering, and stratification. Depression scores were positively correlated with BMI, WC, WHtR, and DBP in all three samples, and negatively correlated with SBP. Sleep duration mediated 3.09%, 1.78%, and -2.42% of the associations between depression and BMI, WHtR, and DBP, respectively. The mediation effect between depression and WC was weaker (1.82%, P = 0.11), while no mediation effect was observed between depression and SBP (P = 0.86). Physical activity significantly mediated 11.72%, 15.42%, 14.79%, and 9.96% of the associations between depression and BMI, WC, WHtR, and DBP, respectively. Working hours did not mediate the relationship between depression and obesity or blood pressure.
Mediator analysis of depression, lifestyle, obesity, and blood pressure with weights, clustering, and stratificationa
| TE | ADE | ACME | PM | ||||||
| Estimate (95%CI) | P | Estimate (95%CI) | P | Estimate (95%CI) | P | Estimate (95%CI) | P | Proportion | |
| Sleep duration (h/date) | |||||||||
| BMI | 0.099 (0.093, 0.105) | < 0.0001 | 0.096 (0.090, 0.102) | < 0.0001 | 0.003 (0.003, 0.003) | < 0.0001 | 0.031 (0.027, 0.036) | < 0.0001 | 3.09% |
| WC | 0.247 (0.173, 0.323) | < 0.0001 | 0.242 (0.169, 0.318) | < 0.0001 | 0.005 (-0.001, 0.010) | 0.110 | 0.018 (-0.004, 0.046) | 0.110 | 1.82% |
| WHtRb | 0.002 (0.002, 0.002) | < 0.0001 | 0.002 (0.002, 0.002) | < 0.0001 | 0.000 (0.000, 0.000) | < 0.0001 | 0.018 (0.018, 0.018) | < 0.0001 | 1.78% |
| SBP | -0.120 (-0.176, -0.054) | 0.002 | -0.119 (-0.175, -0.052) | 0.002 | -0.000 (-0.003, 0.003) | 0.858 | 0.003 (-0.020, 0.037) | 0.860 | 0.25% |
| DBP | 0.088 (0.066, 0.111) | < 0.0001 | 0.090 (0.068, 0.112) | < 0.0001 | -0.002 (-0.004, -0.000) | 0.012 | -0.024 (-0.044, -0.005) | 0.012 | -2.42% |
| Working hours (h/week) | |||||||||
| BMI | 0.107 (0.091, 0.124) | < 0.0001 | 0.108 (0.093, 0.125) | < 0.0001 | -0.001 (-0.005, 0.002) | 0.550 | -0.011 (-0.046, 0.021) | 0.550 | -1.07% |
| WC | 0.247 (0.009, 0.497) | 0.060 | 0.250 (0.007, 0.502) | 0.058 | -0.003 (-0.012, 0.005) | 0.480 | -0.009 (-0.083, 0.051) | 0.508 | -0.91% |
| WHtRb | 0.002 (0.002, 0.002) | < 0.0001 | 0.002 (0.002, 0.002) | < 0.0001 | -0.000 (-0.000, 0.000) | 0.500 | -0.010 (-0.038, 0.019) | 0.500 | -0.97% |
| SBP | -0.092 (-0.186, -0.000) | 0.054 | -0.092 (-0.185, 0.001) | 0.054 | 0.000 (-0.002, 0.002) | 0.950 | -0.000 (-0.050, 0.041) | 0.936 | -0.03% |
| DBP | 0.103 (0.052, 0.155) | < 0.0001 | 0.104 (0.053, 0.156) | < 0.0001 | -0.001 (-0.004, 0.002) | 0.520 | -0.009 (-0.047, 0.021) | 0.520 | -0.86% |
| Physical activity (MET-mins/week) | |||||||||
| BMI | 0.120 (0.105, 0.135) | < 0.0001 | 0.106 (0.091, 0.121) | < 0.0001 | 0.014 (0.013, 0.015) | < 0.0001 | 0.117 (0.104, 0.135) | < 0.0001 | 11.72% |
| WC | 0.292 (0.100, 0.495) | < 0.0001 | 0.247 (0.060, 0.444) | 0.010 | 0.045 (0.030, 0.060) | < 0.0001 | 0.154 (0.089, 0.411) | < 0.0001 | 15.42% |
| WHtRb | 0.002 (0.002, 0.002) | < 0.0001 | 0.002 (0.002, 0.002) | < 0.0001 | 0.000 (0.000, 0.000) | < 0.0001 | 0.148 (0.148, 0.148) | < 0.0001 | 14.79% |
| SBP | -0.144 (-0.264, -0.027) | 0.016 | -0.148 (-0.270, -0.030) | 0.018 | 0.004 (-0.005, 0.013) | 0.400 | -0.027 (-0.149, 0.061) | 0.388 | -2.70% |
| DBP | 0.114 (0.043, 0.181) | < 0.0001 | 0.103 (0.034, 0.169) | < 0.0001 | 0.012 (0.007, 0.016) | < 0.0001 | 0.100 (0.059, 0.238) | < 0.0001 | 9.96% |
Sensitivity analysis
Table 3 presents the sensitivity analysis results within the SEM framework, which only accounts for sampling weights. In all three samples, depression scores were positively correlated with BMI, WC, WHtR, and DBP (P < 0.001), and negatively correlated with SBP (P < 0.001). Sleep duration mediated 4.52%, 2.29%, 1.72%, and 1.62% of the associations between depression and BMI, WC, WHtR, and SBP, respectively. No mediation effect was observed between depression and DBP (P = 0.441). Physical activity mediated 9.28%, 14.10%, 14.69%, 5.49%, and -2.59% of the associations between depression and BMI, WC, WHtR, SBP, and DBP, respectively. No mediation effect by work hours was found between depression and obesity or blood pressure. Consistency across effect sizes, Std.lv, and Std.all coefficients supported the robustness of the findings. Results are considered robust when P-values < 0.05 and standardized coefficients are consistent across both analyses [Figure 3]. Sleep duration mediated 1.72%-4.52% of the association between depression and obesity, and physical activity mediated 9.28%-14.79% of the association between depression and obesity. Physical activity also mediated 5.49%-9.96% of the positive association between depression and DBP.
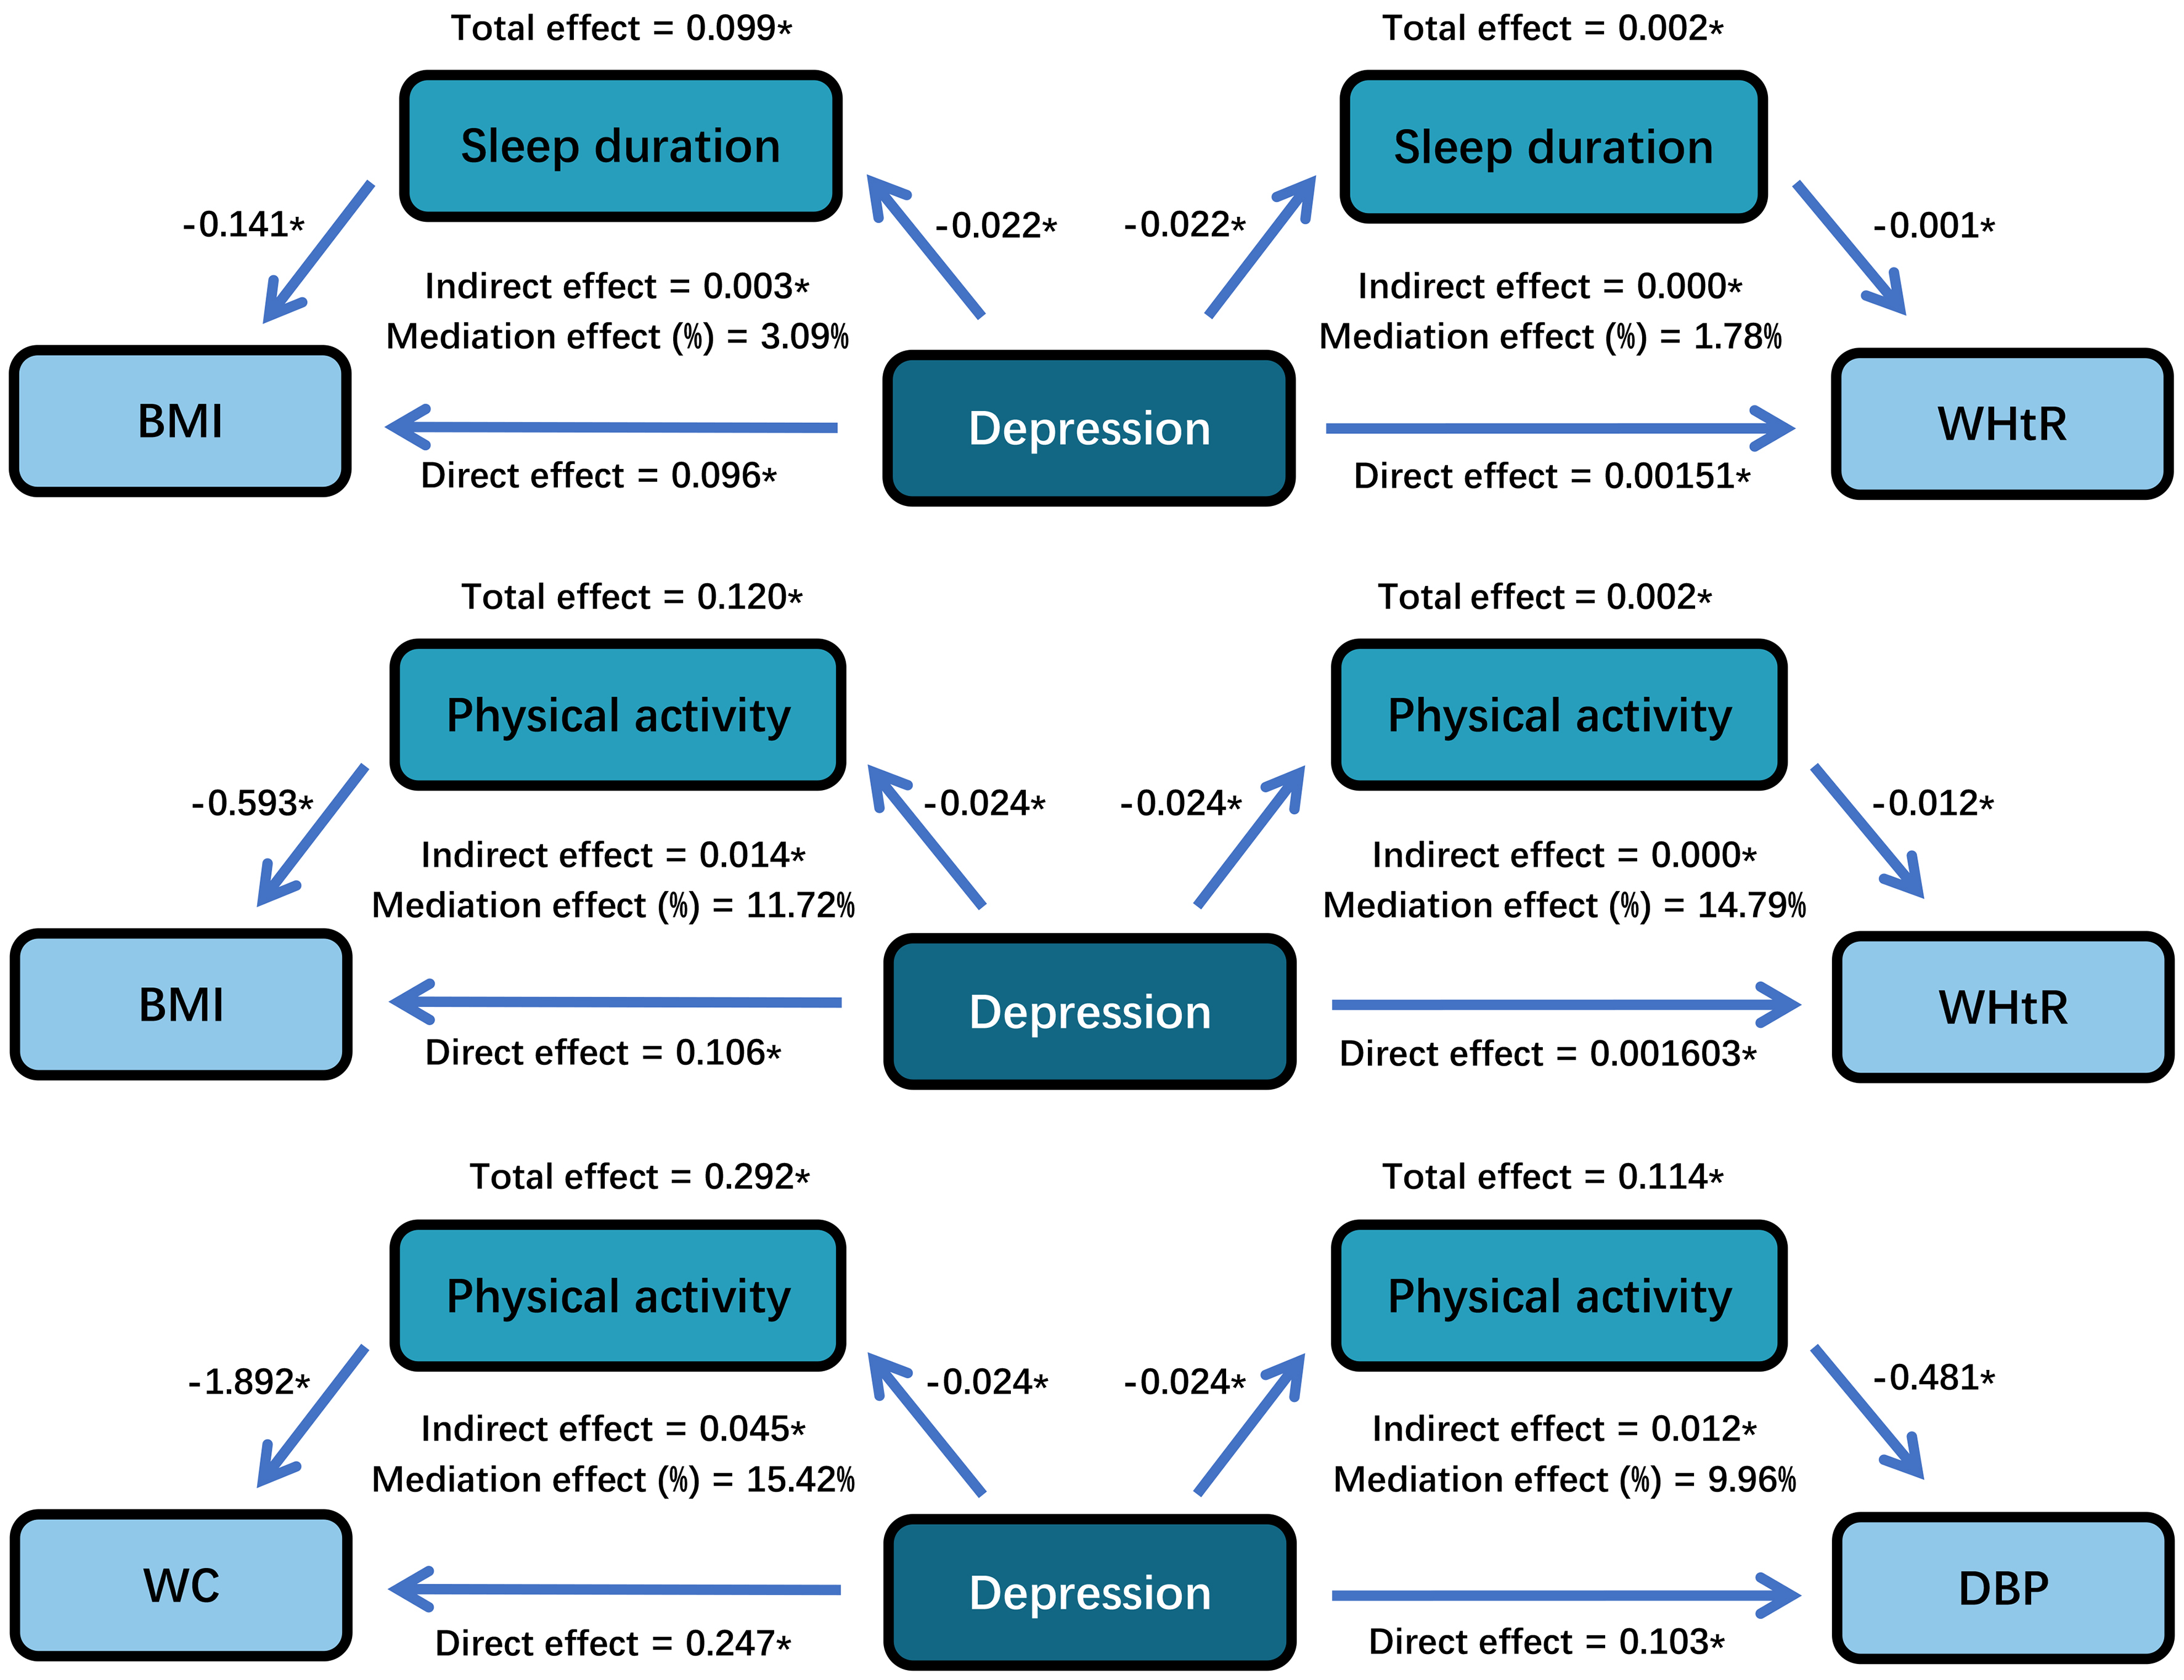
Figure 3. The mediating role of lifestyle in the relationship between depression, obesity, and blood pressurea,b. aThe mediating factors with P-values < 0.05 in both mediation analysis and structural equation modeling. Presented as the results of the mediation analysis; bAdjusted for age group, sex, race/ethnicity, education, marital status, family income-to-poverty ratio, smoking, drinking, hypertension, diabetes, and comorbidity model. BMI: Body mass index; WC: waist circumference; WHtR: waist-to-height ratio; DBP: diastolic blood pressure. *P < 0.0001.
Structural equation model of depression, lifestyle, obesity, and blood pressure with weightsa
| TE | ADE | ACME | PM | |||||||||||||
| β | SE | P | Std.lv | Std.all | β | SE | P | Std.lv | Std.all | β | SE | P | Std.lv | Std.all | Proportion | |
| Sleep duration (h/date) | ||||||||||||||||
| BMI | 0.107 | 0.010 | < 0.001 | 0.107 | 0.067 | 0.102 | 0.010 | < 0.001 | 0.102 | 0.064 | 0.005 | 0.001 | < 0.001 | 0.005 | 0.003 | 4.52% |
| WC | 0.240 | 0.024 | < 0.001 | 0.240 | 0.061 | 0.234 | 0.024 | < 0.001 | 0.234 | 0.060 | 0.005 | 0.002 | 0.003 | 0.005 | 0.001 | 2.29% |
| WHtR | 0.001 | 0.000 | < 0.001 | 0.001 | 0.059 | 0.001 | 0.000 | < 0.001 | 0.001 | 0.058 | 0.000 | 0.000 | 0.029 | 0.000 | 0.001 | 1.72% |
| SBP | -0.212 | 0.022 | < 0.001 | -0.212 | -0.053 | -0.209 | 0.022 | < 0.001 | -0.209 | -0.052 | -0.003 | 0.002 | 0.046 | -0.003 | -0.001 | 1.62% |
| DBP | 0.144 | 0.016 | < 0.001 | 0.144 | 0.051 | 0.143 | 0.016 | < 0.001 | 0.143 | 0.051 | 0.001 | 0.001 | 0.441 | 0.001 | 0.000 | 0.71% |
| Working hours (h/week) | ||||||||||||||||
| BMI | 0.107 | 0.016 | < 0.001 | 0.107 | 0.058 | 0.107 | 0.016 | < 0.001 | 0.107 | 0.058 | 0.000 | 0.001 | 0.964 | 0.000 | 0.000 | 0.05% |
| WC | 0.236 | 0.037 | < 0.001 | 0.236 | 0.052 | 0.236 | 0.037 | < 0.001 | 0.236 | 0.052 | 0.000 | 0.002 | 0.964 | 0.000 | 0.000 | 0.05% |
| WHtR | 0.001 | 0.000 | < 0.001 | 0.001 | 0.054 | 0.001 | 0.000 | < 0.001 | 0.001 | 0.054 | 0.000 | 0.000 | 0.964 | 0.000 | 0.000 | 0.04% |
| SBP | -0.139 | 0.030 | < 0.001 | -0.139 | -0.034 | -0.139 | 0.030 | < 0.001 | -0.139 | -0.034 | -0.000 | 0.001 | 0.964 | -0.000 | -0.000 | 0.02% |
| DBP | 0.119 | 0.023 | < 0.001 | 0.119 | 0.038 | 0.119 | 0.023 | < 0.001 | 0.119 | 0.038 | 0.000 | 0.001 | 0.964 | 0.000 | 0.000 | 0.05% |
| Physical activity (MET-mins/week) | ||||||||||||||||
| BMI | 0.133 | 0.016 | < 0.001 | 0.133 | 0.078 | 0.121 | 0.016 | < 0.001 | 0.121 | 0.071 | 0.012 | 0.002 | < 0.001 | 0.012 | 0.007 | 9.28% |
| WC | 0.298 | 0.037 | < 0.001 | 0.298 | 0.070 | 0.256 | 0.037 | < 0.001 | 0.256 | 0.060 | 0.042 | 0.006 | < 0.001 | 0.042 | 0.010 | 14.10% |
| WHtR | 0.002 | 0.000 | < 0.001 | 0.002 | 0.071 | 0.002 | 0.000 | < 0.001 | 0.002 | 0.061 | 0.000 | 0.000 | < 0.001 | 0.000 | 0.010 | 14.69% |
| SBP | -0.218 | 0.032 | < 0.001 | -0.218 | -0.053 | -0.223 | 0.032 | < 0.001 | -0.223 | -0.054 | 0.006 | 0.002 | 0.020 | 0.006 | 0.001 | -2.59% |
| DBP | 0.163 | 0.026 | < 0.001 | 0.163 | 0.055 | 0.154 | 0.025 | < 0.001 | 0.154 | 0.052 | 0.009 | 0.002 | < 0.001 | 0.009 | 0.003 | 5.49% |
DISCUSSION
This study is the first to examine the trends of depression and lifestyle factors in the United States’ post-pandemic era using nationally representative data. Findings reveal a significant increase in depression prevalence post-pandemic, rising from 8.7% pre-pandemic to 13.2%. This increase is accompanied by longer sleep durations, reduced working hours, and a slight decline in physical activity levels. Additionally, depression severity is positively correlated with BMI, WC, WHtR, and DBP, and negatively correlated with SBP. Further analysis suggests that lifestyle factors may mediate the relationship between depression, obesity, and blood pressure. Specifically, sleep duration and physical activity, but not working hours, serve as key behavioral pathways through which depressive symptoms affect metabolic health. These results provide valuable insights for managing depression, obesity, and blood pressure in the post-COVID-19 era and support the development of relevant public health policies.
Individuals who have experienced COVID-19 are more likely to develop severe depression and anxiety compared to the general population[5]. In the post-pandemic period, these psychological disorders have led to a sustained increase in the burden of sleep disturbances[26,27]. Recent studies corroborate our findings, showing slight increases in sleep duration, more frequent napping, and reduced physical activity levels following the pandemic[28,29]. A multi-national and multi-cohort study has demonstrated a significant bidirectional association between depression and cardiometabolic diseases[30]. Therefore, although no significant changes in BMI, WC, and WHtR were observed before and after the pandemic, the potential long-term impacts of mental health and lifestyle changes, along with resulting metabolic comorbidities, highlight the importance of raising public awareness and implementing measures to mitigate these effects.
Existing research indicates a complex interplay between mental and metabolic health. Substantial evidence from Europe and North America shows a positive correlation between overweight/obesity and depression, with overweight or obese individuals being more susceptible to mood disorders[31-33]. In contrast, many Asian studies suggest that obesity is not an independent risk predictor for depression, and some even find a negative correlation between the two[34-37]. The association between depression and obesity may share pathophysiological mechanisms such as inflammatory responses, gut dysbiosis, and neurotransmitter imbalances[38-41]. However, these significant regional differences suggest that sociocultural factors, dietary habits, body image perceptions, social stress structures, and the accessibility of mental health resources play crucial roles in shaping the relationship between depression and obesity. For example, in East Asia, a larger body size is often viewed as a symbol of prosperity and good health, reflecting collectivist cultural values historically associated with group survival. In contrast, Western regions often uphold the value that “self-discipline is a virtue”, attributing obesity primarily to a lack of self-control and emphasizing individual body regulation. Additionally, in academic circles, obesity is classified as a chronic disease. However, current definitions of overweight and obesity are predominantly based on BMI and its derived metrics. While BMI serves as an epidemiological indicator of population-level obesity, it has limitations and risks when applied to individual assessments[42]. This study not only demonstrates that, within the U.S. population, depression levels are positively correlated with BMI and WC but also identifies a positive correlation between WHtR and depression. Moreover, the relationship between depression and blood pressure is complex. Previous studies have shown that depression may be negatively correlated[43-48] or unrelated[49] to SBP and may be positively[50-53], negatively[44-46], or not significantly[43,49] related to DBP. However, these studies were primarily conducted in Europe, Asia, and Australia, with a lack of large-scale data from the U.S. This study found that depression levels were negatively correlated with SBP and positively correlated with DBP. This seemingly paradoxical relationship underscores the multidimensional impact of depression as a systemic disorder on the cardiovascular system. Although the underlying mechanisms remain unclear, depression may influence blood pressure levels not only through biological and neuroendocrine pathways but also via emotional and behavioral changes at a macro level[54,55].
Lifestyle factors may be a critical link in the interplay between mental and CVDs, as they are both manifestations of psychological and cardiovascular states and independent risk factors affecting both health domains. Additionally, sleep, work, and physical activity - three time-consuming lifestyle factors - significantly impact health. For instance, insufficient sleep duration is closely related to obesity and cardiovascular risk[56], prolonged working hours are associated with hypertension[57,58] and obesity[59], and engaging in more than 300 min of physical activity per week significantly reduces the risk of depression[60].
In this study, extended sleep duration and increased physical activity were associated with improved depression scores and lower obesity-related indicators. Working hours were not related to depression levels; however, increased working hours were linked to higher obesity-related indicators. Therefore, we emphasize that appropriately extending sleep duration and increasing physical activity are associated with concurrent improvements in psychological and metabolic health. Nevertheless, due to limited daily time, balancing increased sleep and exercise with other major commitments, such as work schedules, remains a challenge. Future research should comprehensively integrate the interrelationships among multiple lifestyle factors.
The key findings of this study indicate that lifestyle factors partially mediate the relationships between depression, obesity, and blood pressure. Specifically, sleep duration and physical activity mediate the relationship between depression and obesity by 1.72%-4.52% and 9.28%-14.79%, respectively, while physical activity mediates the relationship between depression and DBP by 5.49%-9.96%. These results highlight the potential importance of lifestyle interventions in reducing the risks of depression, obesity, and hypertension. Supporting evidence from related studies includes Nathalie’s research, which demonstrates a positive correlation between poor mental health and overweight, with physical activity accounting for 20% of this relationship[16]. Additionally, Yu et al. identified sleep disorders as key independent mediators between depression and obesity[15]. Unlike their questionnaire-based approaches, our study strengthens these conclusions by quantifying sleep duration. However, we did not find a mediating effect of working hours on the relationships between depression and obesity or blood pressure. Nonetheless, working hours were positively correlated with obesity and DBP, suggesting that long working hours may increase the risk of obesity and hypertension. Extended working hours may also exacerbate the comorbidity of depression and obesity by impairing sleep quality and reducing physical activity time. The relationship between depression and metabolic factors is influenced not only by individual behaviors but also by external factors such as the social environment and workplace. To better address these health challenges, we recommend integrating mental health assessments into primary care screening protocols, with a particular emphasis on mental health and lifestyle factors in the post-pandemic period. Additionally, workplace health policies should incorporate increased mental health support and resources to encourage physical activity, thereby addressing the interconnected challenges of mental and metabolic health.
This study utilized a nationally representative large sample, ensuring scientific rigor and nationwide generalizability. To minimize the impact of confounding factors, we employed a DAG model. By accounting for different sampling weights, we validated the robustness of our results. However, several limitations remain. First, the cross-sectional design restricts causal inferences, as correlation does not equate to causation. Consequently, we cannot determine the causal direction between variables, assert that changes in psychological states and lifestyles are entirely attributable to COVID-19, or clarify the causal relationships among depression, lifestyle, and metabolic factors. Second, this study focused solely on depression within the realm of mental health; future research should encompass a broader evaluation of mental health changes before and after the pandemic. Third, although we analyzed lifestyle factors such as sleep duration, working hours, and physical activity, other factors like diet and social activities may also influence the outcomes and warrant further investigation. Fourth, the results primarily reflect the cultural and social context of the American population, necessitating caution when generalizing to other cultural backgrounds. Fifth, our analysis of working hours included only employed individuals, which may not fully represent the mental health and lifestyle conditions of the unemployed, thereby limiting the applicability of our conclusions.
Conclusions
In conclusion, this study indicates that depression may become a significant public health challenge in the future. Sleep duration and physical activity, rather than working hours, play crucial mediating roles in the relationships among depression, obesity, and blood pressure. Policy interventions should promote healthy lifestyles, particularly in the post-pandemic era, by implementing targeted strategies such as moderately increasing sleep duration, reducing working hours, and enhancing physical activity to alleviate the burdens of mental and metabolic diseases.
DECLARATIONS
Acknowledgments
The authors thank all the NHANES participants and staff members for their contributions to data collection and for making the data publicly available.
Authors’ contributions
Made substantial contributions to conception and design of the study: Zuo SH, Liu CY, Wang RY, Wang Y, Mu JJ
Performed data curation: Zuo SH, Liu CY, Wang RY
Performed formal analysis: Zuo SH
Performed investigation: Zuo SH, Liu CY, Wang RY
Performed methodology: Zuo SH, Liu CY, Wang RY, Hu GL, Wang Y, Mu JJ
Performed project administration: Zuo SH
Performed software work: Zuo SH, Liu CY, Wang RY
Performed validation: Zuo SH, Liu CY, Wang RY
Performed visualization: Zuo SH
Performed writing - original draft: Zuo SH
Performed writing - review and editing: Zuo SH, Hu GL, Sun Y, Chang MK, Man ZY, Jia H, Zhang T, Du MF, Zhang X, Wang Y, Mu JJ
Obtained funding: Wang Y, Mu JJ
Provided supervision: Wang Y, Mu JJ
All authors have read and approved the final manuscript.
Availability of data and materials
The datasets analyzed in this study are available in the NHANES repository (https://www.cdc.gov/nchs/nhanes/?CDC_AAref_Val=https://www.cdc.gov/nchs/nhanes/index.htm). Additional data generated during the analysis are available from the corresponding authors upon reasonable request.
Financial support and sponsorship
This work was supported by the National Natural Science Foundation of China No.82200472 (Wen-Ling Zheng), the Key Research and Development Program of Shaanxi (2023-ZDLSF-50), the Clinical Research Award of the First Affiliated Hospital of Xi’an Jiaotong University (XJTU1AF-CRF-2023-004), and the International Joint Research Center for Cardiovascular Precision Medicine of Shaanxi Province (2020GHJD-14).
Conflicts of interest
Wang Y is a Junior Editorial Board member of the journal Metabolism and Target Organ Damage. Wang Y was not involved in any steps of the editorial process, including reviewer selection, manuscript handling, or decision making. The other authors declared that there are no conflicts of interest.
Ethical approval and consent to participate
This study utilized de-identified data from the National Health and Nutrition Examination Survey (NHANES) database (2005–2023), which is publicly accessible. The original data collection and release were approved by the National Center for Health Statistics (NCHS) Research Ethics Review Board, in compliance with relevant ethical guidelines and privacy regulations. Therefore, no additional ethics approval was required for the secondary analysis of these publicly available, de-identified data.
Consent for publication
Not applicable.
Copyright
© The Author(s) 2025.
Supplementary Materials
REFERENCES
1. 2021 Diseases and Injuries Collaborators. Global incidence, prevalence, years lived with disability (YLDs), disability-adjusted life-years (DALYs), and healthy life expectancy (HALE) for 371 diseases and injuries in 204 countries and territories and 811 subnational locations, 1990-2021: a systematic analysis for the Global Burden of Disease Study 2021. Lancet. 2024;403:2133-61.
2. Seighali N, Abdollahi A, Shafiee A, et al. The global prevalence of depression, anxiety, and sleep disorder among patients coping with Post COVID-19 syndrome (long COVID): a systematic review and meta-analysis. BMC Psychiatry. 2024;24:105.
3. Kim S, Hwang J, Lee JH, et al. Psychosocial alterations during the COVID-19 pandemic and the global burden of anxiety and major depressive disorders in adolescents, 1990-2021: challenges in mental health amid socioeconomic disparities. World J Pediatr. 2024;20:1003-16.
4. Vindegaard N, Benros ME. COVID-19 pandemic and mental health consequences: systematic review of the current evidence. Brain Behav Immun. 2020;89:531-42.
5. Mazza MG, De Lorenzo R, Conte C, et al; COVID-19 BioB Outpatient Clinic Study group. Anxiety and depression in COVID-19 survivors: role of inflammatory and clinical predictors. Brain Behav Immun. 2020;89:594-600.
6. Ettman CK, Abdalla SM, Cohen GH, Sampson L, Vivier PM, Galea S. Prevalence of depression symptoms in US adults before and during the COVID-19 pandemic. JAMA Netw Open. 2020;3:e2019686.
7. Fernandez-de-Las-Peñas C, Notarte KI, Macasaet R, et al. Persistence of post-COVID symptoms in the general population two years after SARS-CoV-2 infection: a systematic review and meta-analysis. J Infect. 2024;88:77-88.
8. Koskinas KC, Van Craenenbroeck EM, Antoniades C, et al; ESC Scientific Document Group. Obesity and cardiovascular disease: an ESC clinical consensus statement. Eur Heart J. 2024;45:4063-98.
9. NCD Risk Factor Collaboration (NCD-RisC). Worldwide trends in underweight and obesity from 1990 to 2022: a pooled analysis of 3663 population-representative studies with 222 million children, adolescents, and adults. Lancet. 2024;403:1027-50.
10. McEvoy JW, McCarthy CP, Bruno RM, et al; ESC Scientific Document Group. 2024 ESC Guidelines for the management of elevated blood pressure and hypertension. Eur Heart J. 2024;45:3912-4018.
11. Risk Factor Collaboration (NCD-RisC). Worldwide trends in hypertension prevalence and progress in treatment and control from 1990 to 2019: a pooled analysis of 1201 population-representative studies with 104 million participants. Lancet. 2021;398:957-80.
12. Moussa OM, Ardissino M, Kulatilake P, et al. Effect of body mass index on depression in a UK cohort of 363 037 obese patients: a longitudinal analysis of transition. Clin Obes. 2019;9:e12305.
13. Wiltink J, Michal M, Wild PS, et al. Associations between depression and different measures of obesity (BMI, WC, WHtR, WHR). BMC Psychiatry. 2013;13:223.
14. Zhou J, Zeng Z, He L, et al. The association of depressive symptoms with adverse clinical outcomes in hypertension: data from SPRINT randomized trail. J Affect Disord. 2024;359:59-69.
15. Yu J, Fei K, Fox A, Negron R, Horowitz C. Stress eating and sleep disturbance as mediators in the relationship between depression and obesity in low-income, minority women. Obes Res Clin Pract. 2016;10:283-90.
16. Michels N. Poor mental health is related to excess weight via lifestyle: a cross-sectional gender- and age-dependent mediation analysis. Nutrients. 2021;13:406.
17. Konttinen H, Silventoinen K, Sarlio-Lähteenkorva S, Männistö S, Haukkala A. Emotional eating and physical activity self-efficacy as pathways in the association between depressive symptoms and adiposity indicators. Am J Clin Nutr. 2010;92:1031-9.
18. Premraj L, Kannapadi NV, Briggs J, et al. Mid and long-term neurological and neuropsychiatric manifestations of post-COVID-19 syndrome: a meta-analysis. J Neurol Sci. 2022;434:120162.
19. Jaywant A, Gunning FM, Oberlin LE, et al. Cognitive symptoms of post-COVID-19 condition and daily functioning. JAMA Netw Open. 2024;7:e2356098.
20. Tison GH, Avram R, Kuhar P, et al. Worldwide effect of COVID-19 on physical activity: a descriptive study. Ann Intern Med. 2020;173:767-70.
21. Nyenhuis SM, Greiwe J, Zeiger JS, Nanda A, Cooke A. Exercise and fitness in the age of social distancing during the COVID-19 pandemic. J Allergy Clin Immunol Pract. 2020;8:2152-5.
22. Prevention CfDCa. NHANES survey methods and analytic guidelines. Available https://wwwn.cdc.gov/nchs/nhanes/analyticguidelines.aspx. [Last accessed on 11 Aug 2025].
23. Levis B, Benedetti A, Thombs BD; DEPRESsion Screening Data (DEPRESSD) Collaboration. Accuracy of patient health questionnaire-9 (PHQ-9) for screening to detect major depression: individual participant data meta-analysis. BMJ. 2019;365:l1476.
24. Ainsworth BE, Haskell WL, Leon AS, et al. Compendium of physical activities: classification of energy costs of human physical activities. Med Sci Sports Exerc. 1993;25:71-80.
25. Ainsworth BE, Haskell WL, Herrmann SD, et al. 2011 compendium of physical activities: a second update of codes and MET values. Med Sci Sports Exerc. 2011;43:1575-81.
26. Deng J, Zhou F, Hou W, et al. The prevalence of depression, anxiety, and sleep disturbances in COVID-19 patients: a meta-analysis. Ann N Y Acad Sci. 2021;1486:90-111.
27. Liu H, Tao TJ, Chan SKY, et al. Daily routine disruptions and psychiatric symptoms amid COVID-19: a systematic review and meta-analysis of data from 0.9 million individuals in 32 countries. BMC Med. 2024;22:49.
28. Ceolin C, Limongi F, Siviero P, et al. Changes in sleep duration and sleep timing in the general population from before to during the first COVID-19 lockdown: a systematic review and meta-analysis. Int J Environ Res Public Health. 2024;21:583.
29. Amo C, Almansour N, Harvey IS. Physical activity and mental health declined during the time of the COVID-19 pandemic: a narrative literature review. Int J Environ Res Public Health. 2022;19:11230.
30. Zhou Y, Kivimäki M, Lim CCW, et al. Bidirectional associations between cardiometabolic multimorbidity and depression and mediation of lifestyles: a multicohort study. JACC Asia. 2024;4:657-71.
31. Qin H, Hu G, Liang Z, et al. Association of longitudinal trajectories of general and abdominal adiposity during middle age with mental health and well-being in late life: a prospective analysis. Psychiatry Res. 2024;335:115863.
32. Ma W, Yan Z, Wu W, Li D, Zheng S, Lyu J. Dose-response association of waist-to-height ratio plus BMI and risk of depression: evidence from the NHANES 05-16. Int J Gen Med. 2021;14:1283-91.
33. Chrzastek Z, Guligowska A, Soltysik B, et al. Association of lower nutritional status and education level with the severity of depression symptoms in older adults-a cross sectional survey. Nutrients. 2021;13:515.
34. Wang Y, Zhang X, Li Y, et al. Predicting depressive symptom by cardiometabolic indicators in mid-aged and older adults in China: a population-based cross-sectional study. Front Psychiatry. 2023;14:1153316.
35. Liao W, Luo Z, Hou Y, et al. Age and gender specific association between obesity and depressive symptoms: a large-scale cross-sectional study. BMC Public Health. 2020;20:1565.
36. Hong GW, Hong SM. Relationships among body mass index, body image, and depression in Korean adults: Korea atouey 2014 and 2016. J Obes Metab Syndr. 2019;28:61-8.
37. Hach I, Ruhl UE, Klotsche J, Klose M, Jacobi F. Associations between waist circumference and depressive disorders. J Affect Disord. 2006;92:305-8.
38. Milaneschi Y, Simmons WK, van Rossum EFC, Penninx BW. Depression and obesity: evidence of shared biological mechanisms. Mol Psychiatry. 2019;24:18-33.
39. Fu X, Wang Y, Zhao F, et al. Shared biological mechanisms of depression and obesity: focus on adipokines and lipokines. Aging. 2023;15:5917-50.
40. Geraets AF, Köhler S, Schram MT. Vascular and metabolic risk factors of late-life depression. Vessel Plus. 2022;6:19.
41. Fatade YA, Dave EK, Vatsa N, et al. Obesity and diabetes in heart disease in women. Metab Target Organ Damage. 2024;4:22.
42. Rubino F, Cummings DE, Eckel RH, et al. Definition and diagnostic criteria of clinical obesity. Lancet Diabetes Endocrinol. 2025;13:221-62.
43. Farhadi A, Javadian H, Vahedparast H, et al. Association between depression and blood pressure in community-dwelling older adults: focus on Bushehr elderly health (BEH) program. BMC Public Health. 2023;23:1565.
44. Lenoir H, Lacombe JM, Dufouil C, et al. Relationship between blood pressure and depression in the elderly. The Three-City study. J Hypertens. 2008;26:1765-72.
45. Hildrum B, Mykletun A, Stordal E, Bjelland I, Dahl AA, Holmen J. Association of low blood pressure with anxiety and depression: the Nord-Trøndelag health study. J Epidemiol Community Health. 2007;61:53-8.
46. Ng TP, Feng L, Niti M, Yap KB. Low blood pressure and depressive symptoms among Chinese older subjects: a population-based study. Am J Med. 2010;123:342-9.
47. Licht CM, de Geus EJ, Seldenrijk A, et al. Depression is associated with decreased blood pressure, but antidepressant use increases the risk for hypertension. Hypertension. 2009;53:631-8.
48. Hammerton G, Harold G, Thapar A, Thapar A. Depression and blood pressure in high-risk children and adolescents: an investigation using two longitudinal cohorts. BMJ Open. 2013;3:e003206.
49. Roane SJ, Pössel P, Mitchell AM, Eaton WW. Associations of depression status and hopelessness with blood pressure: a 24-year follow-up study. Psychol Health Med. 2017;22:761-71.
50. Zhang H, Xu Y, Xu Y. Association of diastolic and systolic blood pressure with depression: a cross-sectional study from NHANES 2005-2018. Front Psychiatry. 2024;15:1433990.
51. Olive LS, Abhayaratna WP, Byrne D, Telford RM, Berk M, Telford RD. Depression, stress and vascular function from childhood to adolescence: a longitudinal investigation. Gen Hosp Psychiatry. 2020;62:6-12.
52. Alhawari H, AlShelleh S, Alhawari H, et al. Hypertension and depression among medical students: is there an association? Heliyon. 2022;8:e12319.
53. Cukrowicz KC, Jahn DR, Hall J, O’Bryant S. Psychological symptoms and blood pressure among rural-dwellers. J Health Psychol. 2012;17:1203-11.
54. Darling AM, Young BE, Skow RJ, et al. Sympathetic and blood pressure reactivity in young adults with major depressive disorder. J Affect Disord. 2024;361:322-32.
55. Gong S, Deng F. Renin-angiotensin system: the underlying mechanisms and promising therapeutical target for depression and anxiety. Front Immunol. 2022;13:1053136.
56. Itani O, Jike M, Watanabe N, Kaneita Y. Short sleep duration and health outcomes: a systematic review, meta-analysis, and meta-regression. Sleep Med. 2017;32:246-56.
57. Trudel X, Brisson C, Gilbert-Ouimet M, Vézina M, Talbot D, Milot A. Long working hours and the prevalence of masked and sustained hypertension. Hypertension. 2020;75:532-8.
58. Artazcoz L, Cortès I, Borrell C, Escribà-Agüir V, Cascant L. Gender perspective in the analysis of the relationship between long workhours, health and health-related behavior. Scand J Work Environ Health. 2007;33:344-50.
59. Zhu Y, Liu J, Jiang H, et al. Are long working hours associated with weight-related outcomes? Obes Rev. 2020;21:e12977.
Cite This Article
How to Cite
Download Citation
Export Citation File:
Type of Import
Tips on Downloading Citation
Citation Manager File Format
Type of Import
Direct Import: When the Direct Import option is selected (the default state), a dialogue box will give you the option to Save or Open the downloaded citation data. Choosing Open will either launch your citation manager or give you a choice of applications with which to use the metadata. The Save option saves the file locally for later use.
Indirect Import: When the Indirect Import option is selected, the metadata is displayed and may be copied and pasted as needed.
About This Article
Copyright

Data & Comments
Data
0


Comments
Comments must be written in English. Spam, offensive content, impersonation, and private information will not be permitted. If any comment is reported and identified as inappropriate content by OAE staff, the comment will be removed without notice. If you have any queries or need any help, please contact us at [email protected].