

fig1
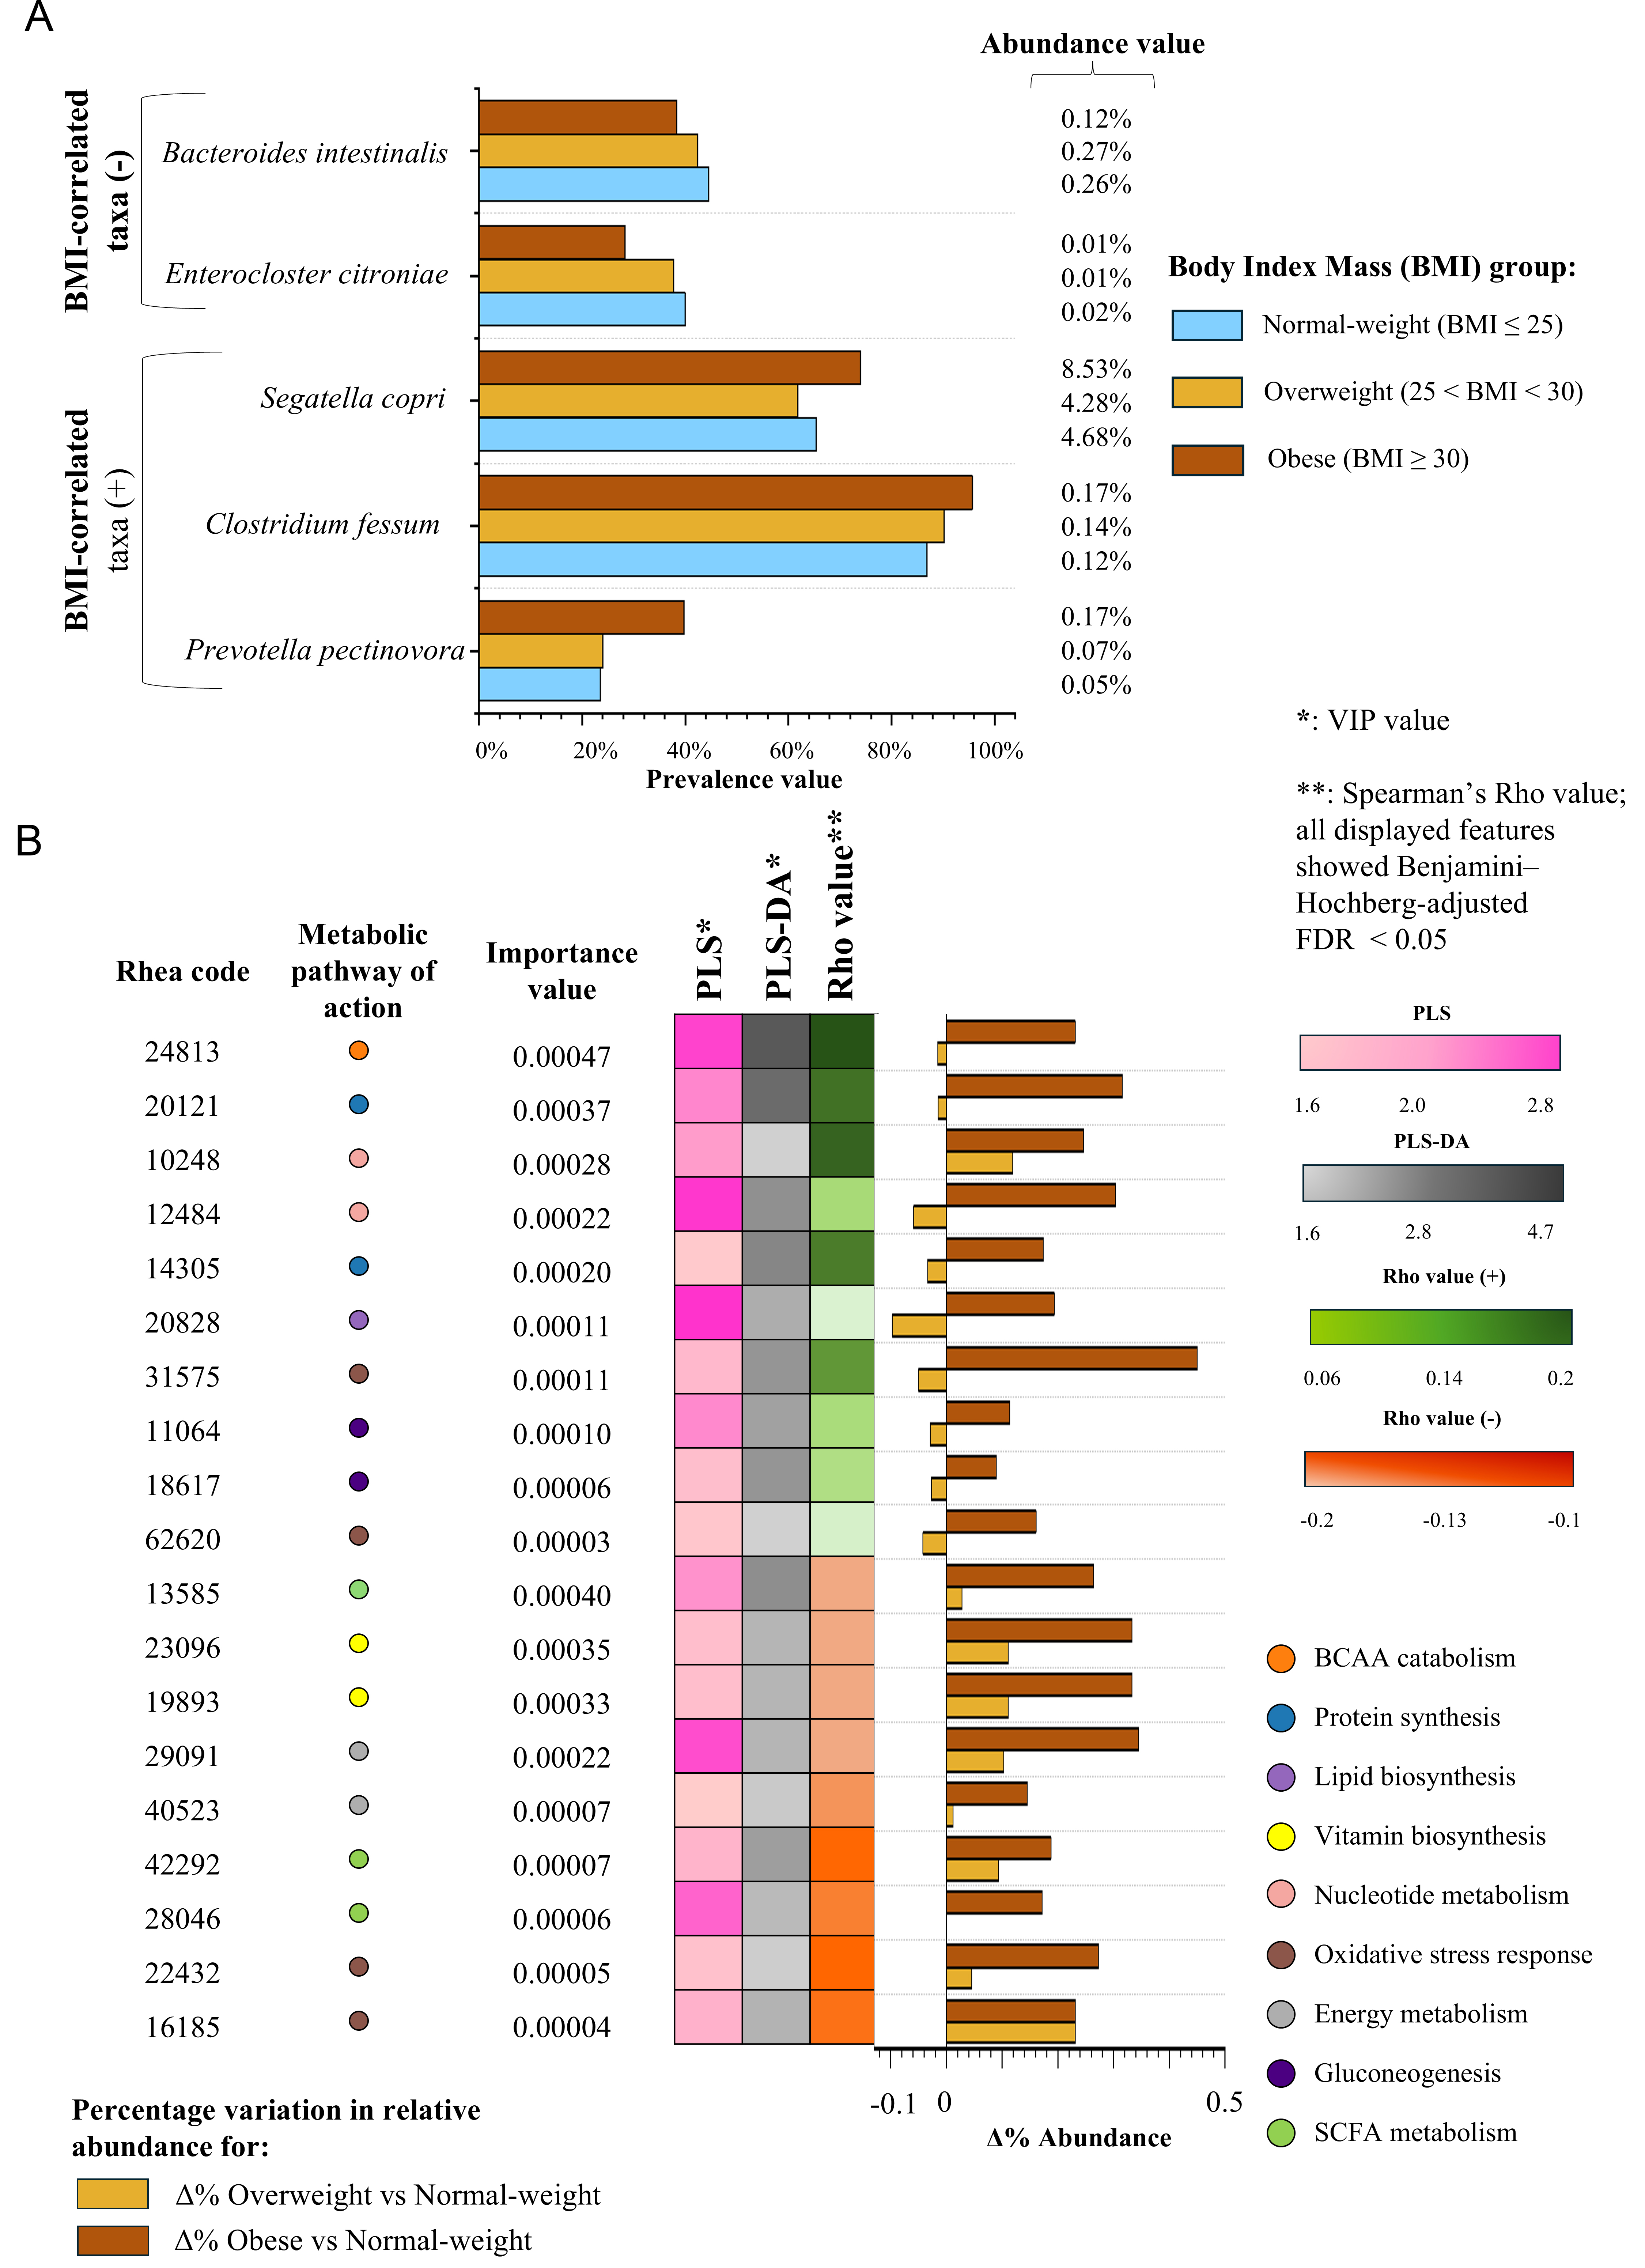
Figure 1. BMI-associated shifts in microbial taxa and enzymatic functions. (A) Bar plots displaying the prevalence of a subset of the 29 taxa identified through the multi-criteria statistical pipeline. Bars are color-coded by BMI group: brown (obese), yellow (overweight), and light blue (normal-weight). The relative abundance values of each species in the three BMI groups are shown alongside the plots; (B) Heatmap illustrating the importance of a subset of the 77 enzymatic functions identified through the statistical selection pipeline, evaluated across three complementary criteria: VIP scores from PLS and PLS-DA models, and Spearman’s correlation coefficients (rho) with BMI. Each row represents one enzymatic function and includes the corresponding Rhea ID, and a dedicated color code indicates the associated metabolic pathway. Bar plots show the percentage variation (Δ%) in relative abundance for overweight vs normal-weight (yellow) and obese vs normal-weight (brown) comparisons. BCAA: Branched-chain amino acid; FDR: false discovery rate; SCFA: short-chain fatty acid; BMI: body mass index; VIP: variable importance in projection; PLS: Partial Least Squares; PLS-DA: Partial Least Squares Discriminant Analysis.