
fig7
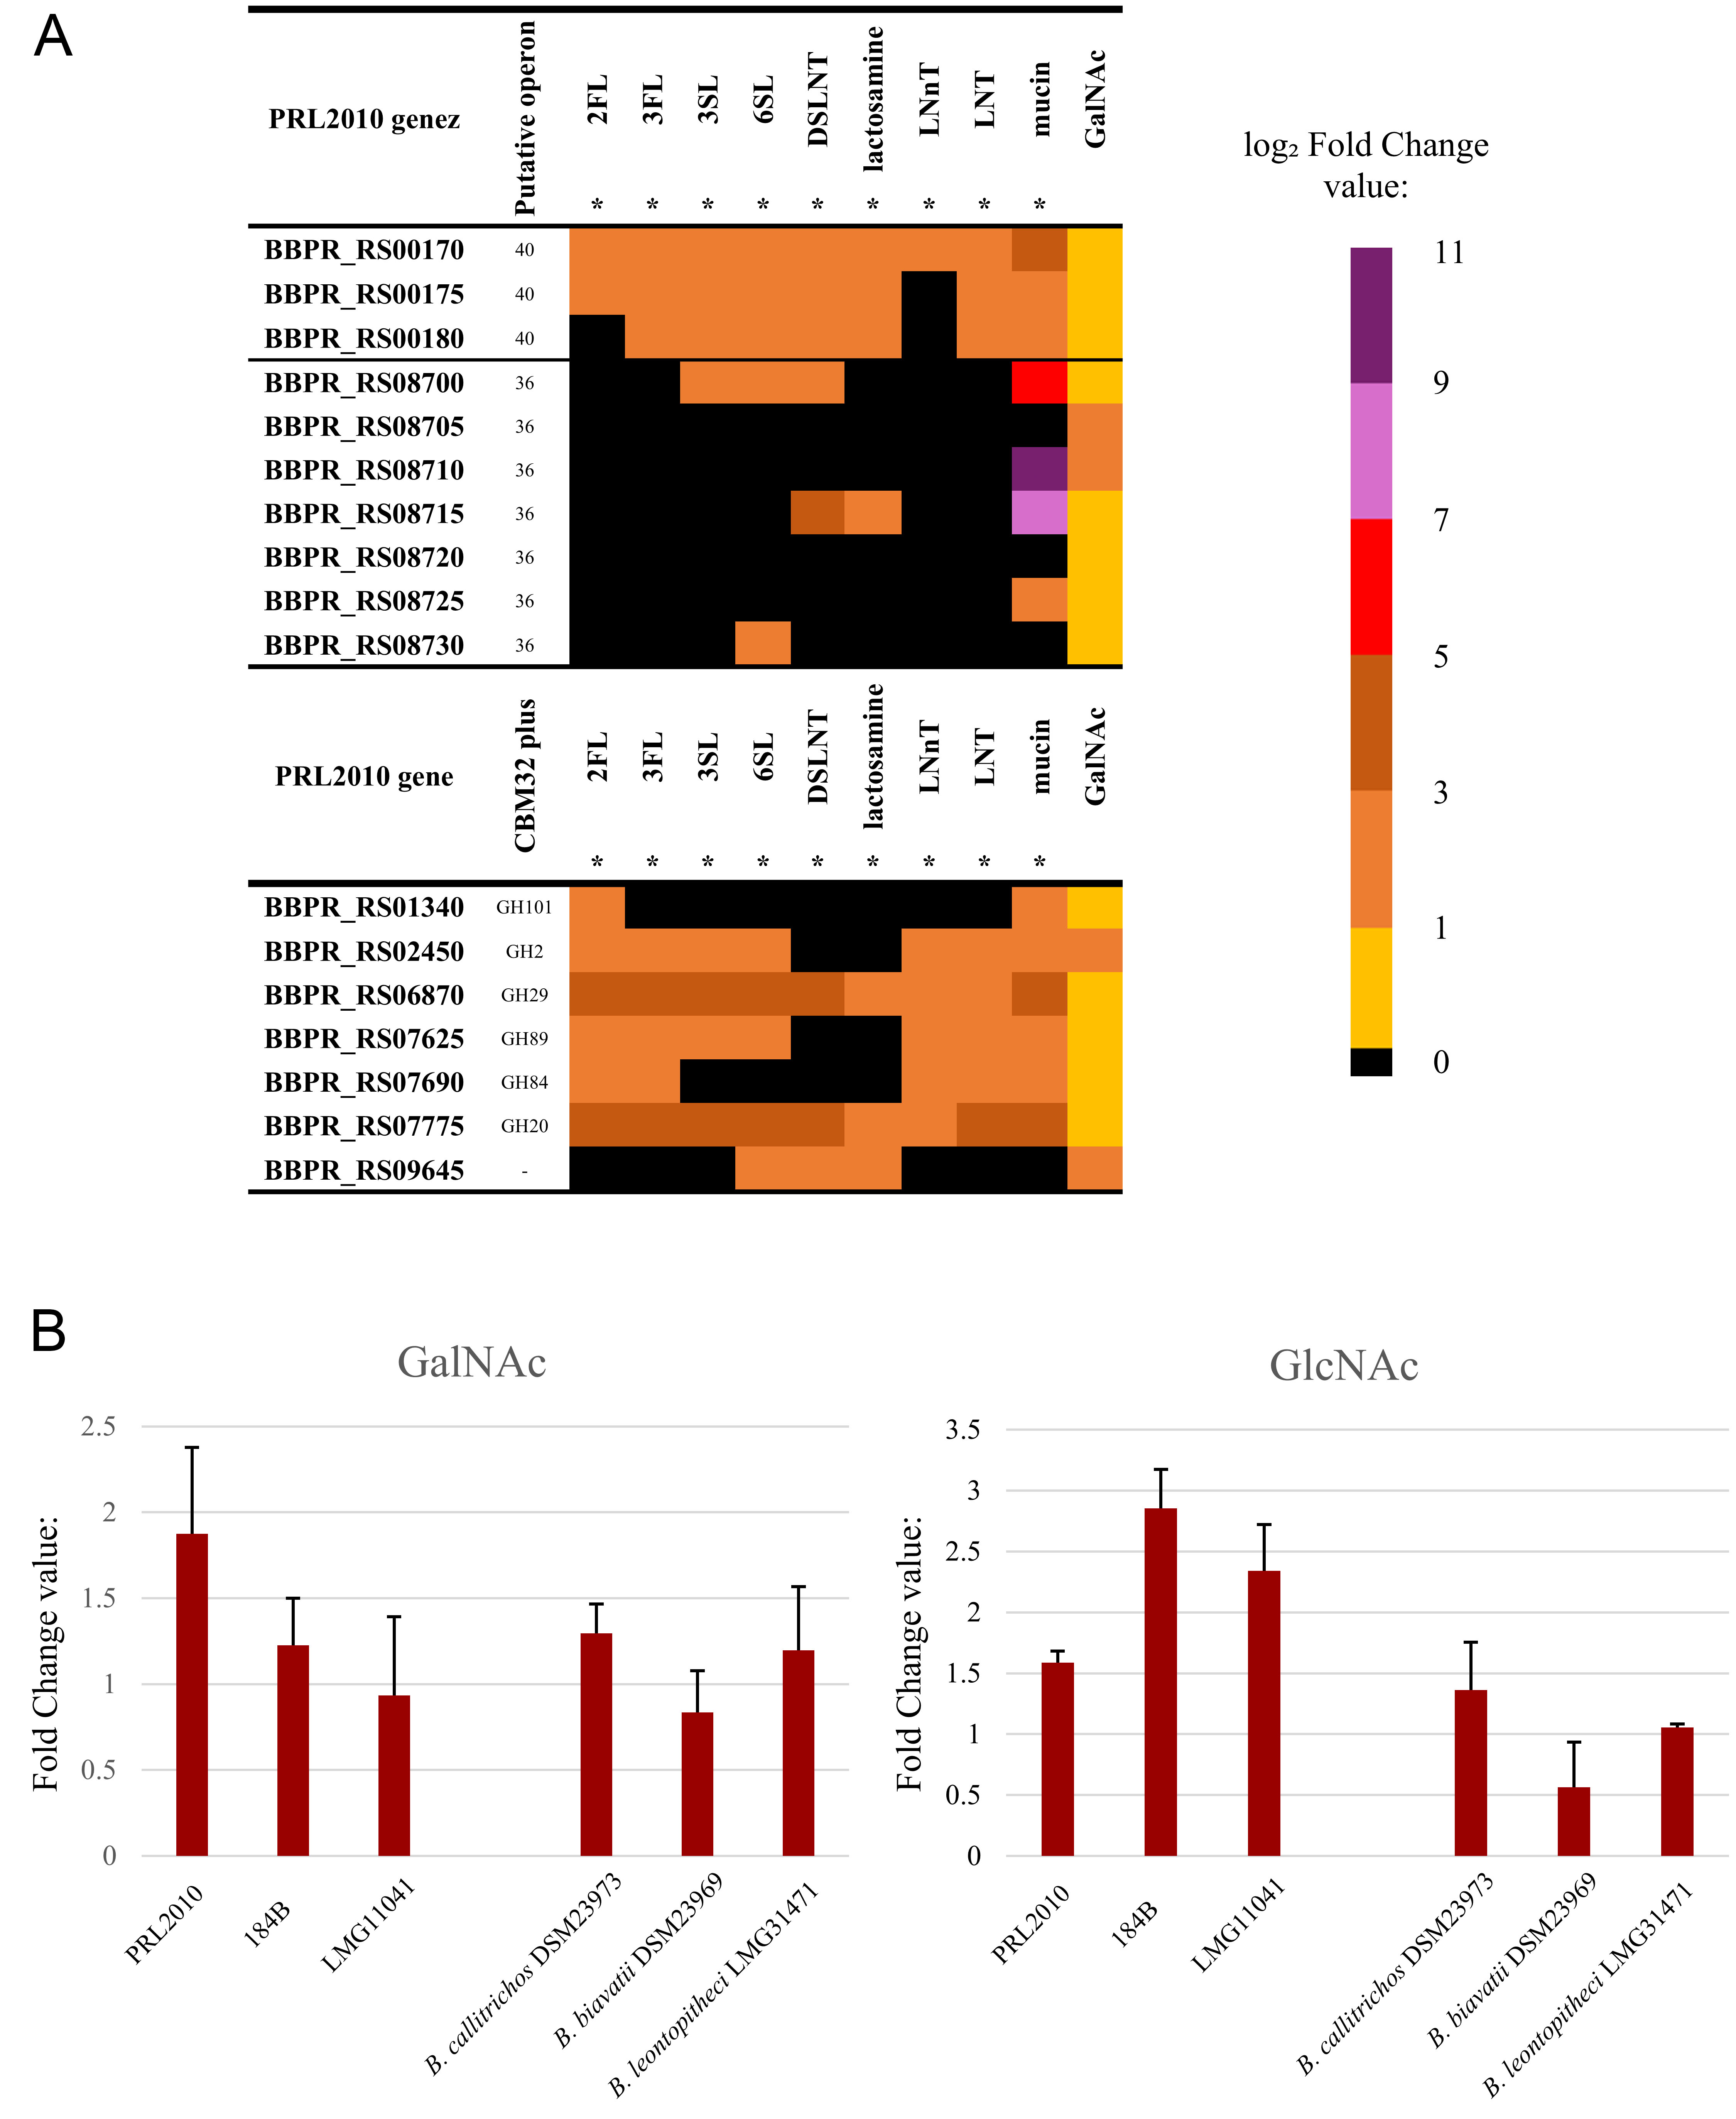
Figure 7. Transcriptional response of species-specific PTS and CBM32-containing GH in B. bifidum PRL2010. (A) the heatmap shows differential gene expression (log2FC). The upper panel displays transcriptional activation of the species-specific PTS systems encoded by operons 36 and 40, while the lower panel shows induction patterns of the six GH genes harboring CBM32 modules. Color intensity represents the log2FC values relative to glucose (used as reference carbon source), with black cells indicating basal or non-significant expression (log2FC < 1). Substrates marked with an asterisk (*) indicate transcriptomic data integrated from a previous study[2], whereas the data for GlcNAc were generated in this study; (B) the histograms show RT-qPCR-based fold-change values for the licC homolog in six microorganisms, i.e., B. bifidum PRL2010, B. bifidum 184B, B. bifidum LMG 11041, B. callitrichos DSM 23973, B. biavatii DSM 23969, and B. leontopitheci LMG 31471. For each strain, fold-change values indicate licC expression during growth on GlcNAc and GalNAc relative to the glucose-grown condition used as reference. PTS: Phosphotransferase systems; CBM32: carbohydrate-binding module 32; GH: glycosyl hydrolases; FC: foldchange; GlcNAc: N-acetylglucosamine; GalNAc: N-acetylgalactosamine; 2’-fucosyllactose; 3FL: 3’-fucosyllactose; 3SL: 3’-sialyllactose; 6SL: 6’-sialyllactose; DSLNT: disialyllacto-N-tetraose; LNnt: lactosamine, lacto-N-neotetraose; LNT: lacto-N-tetraose.