
fig6
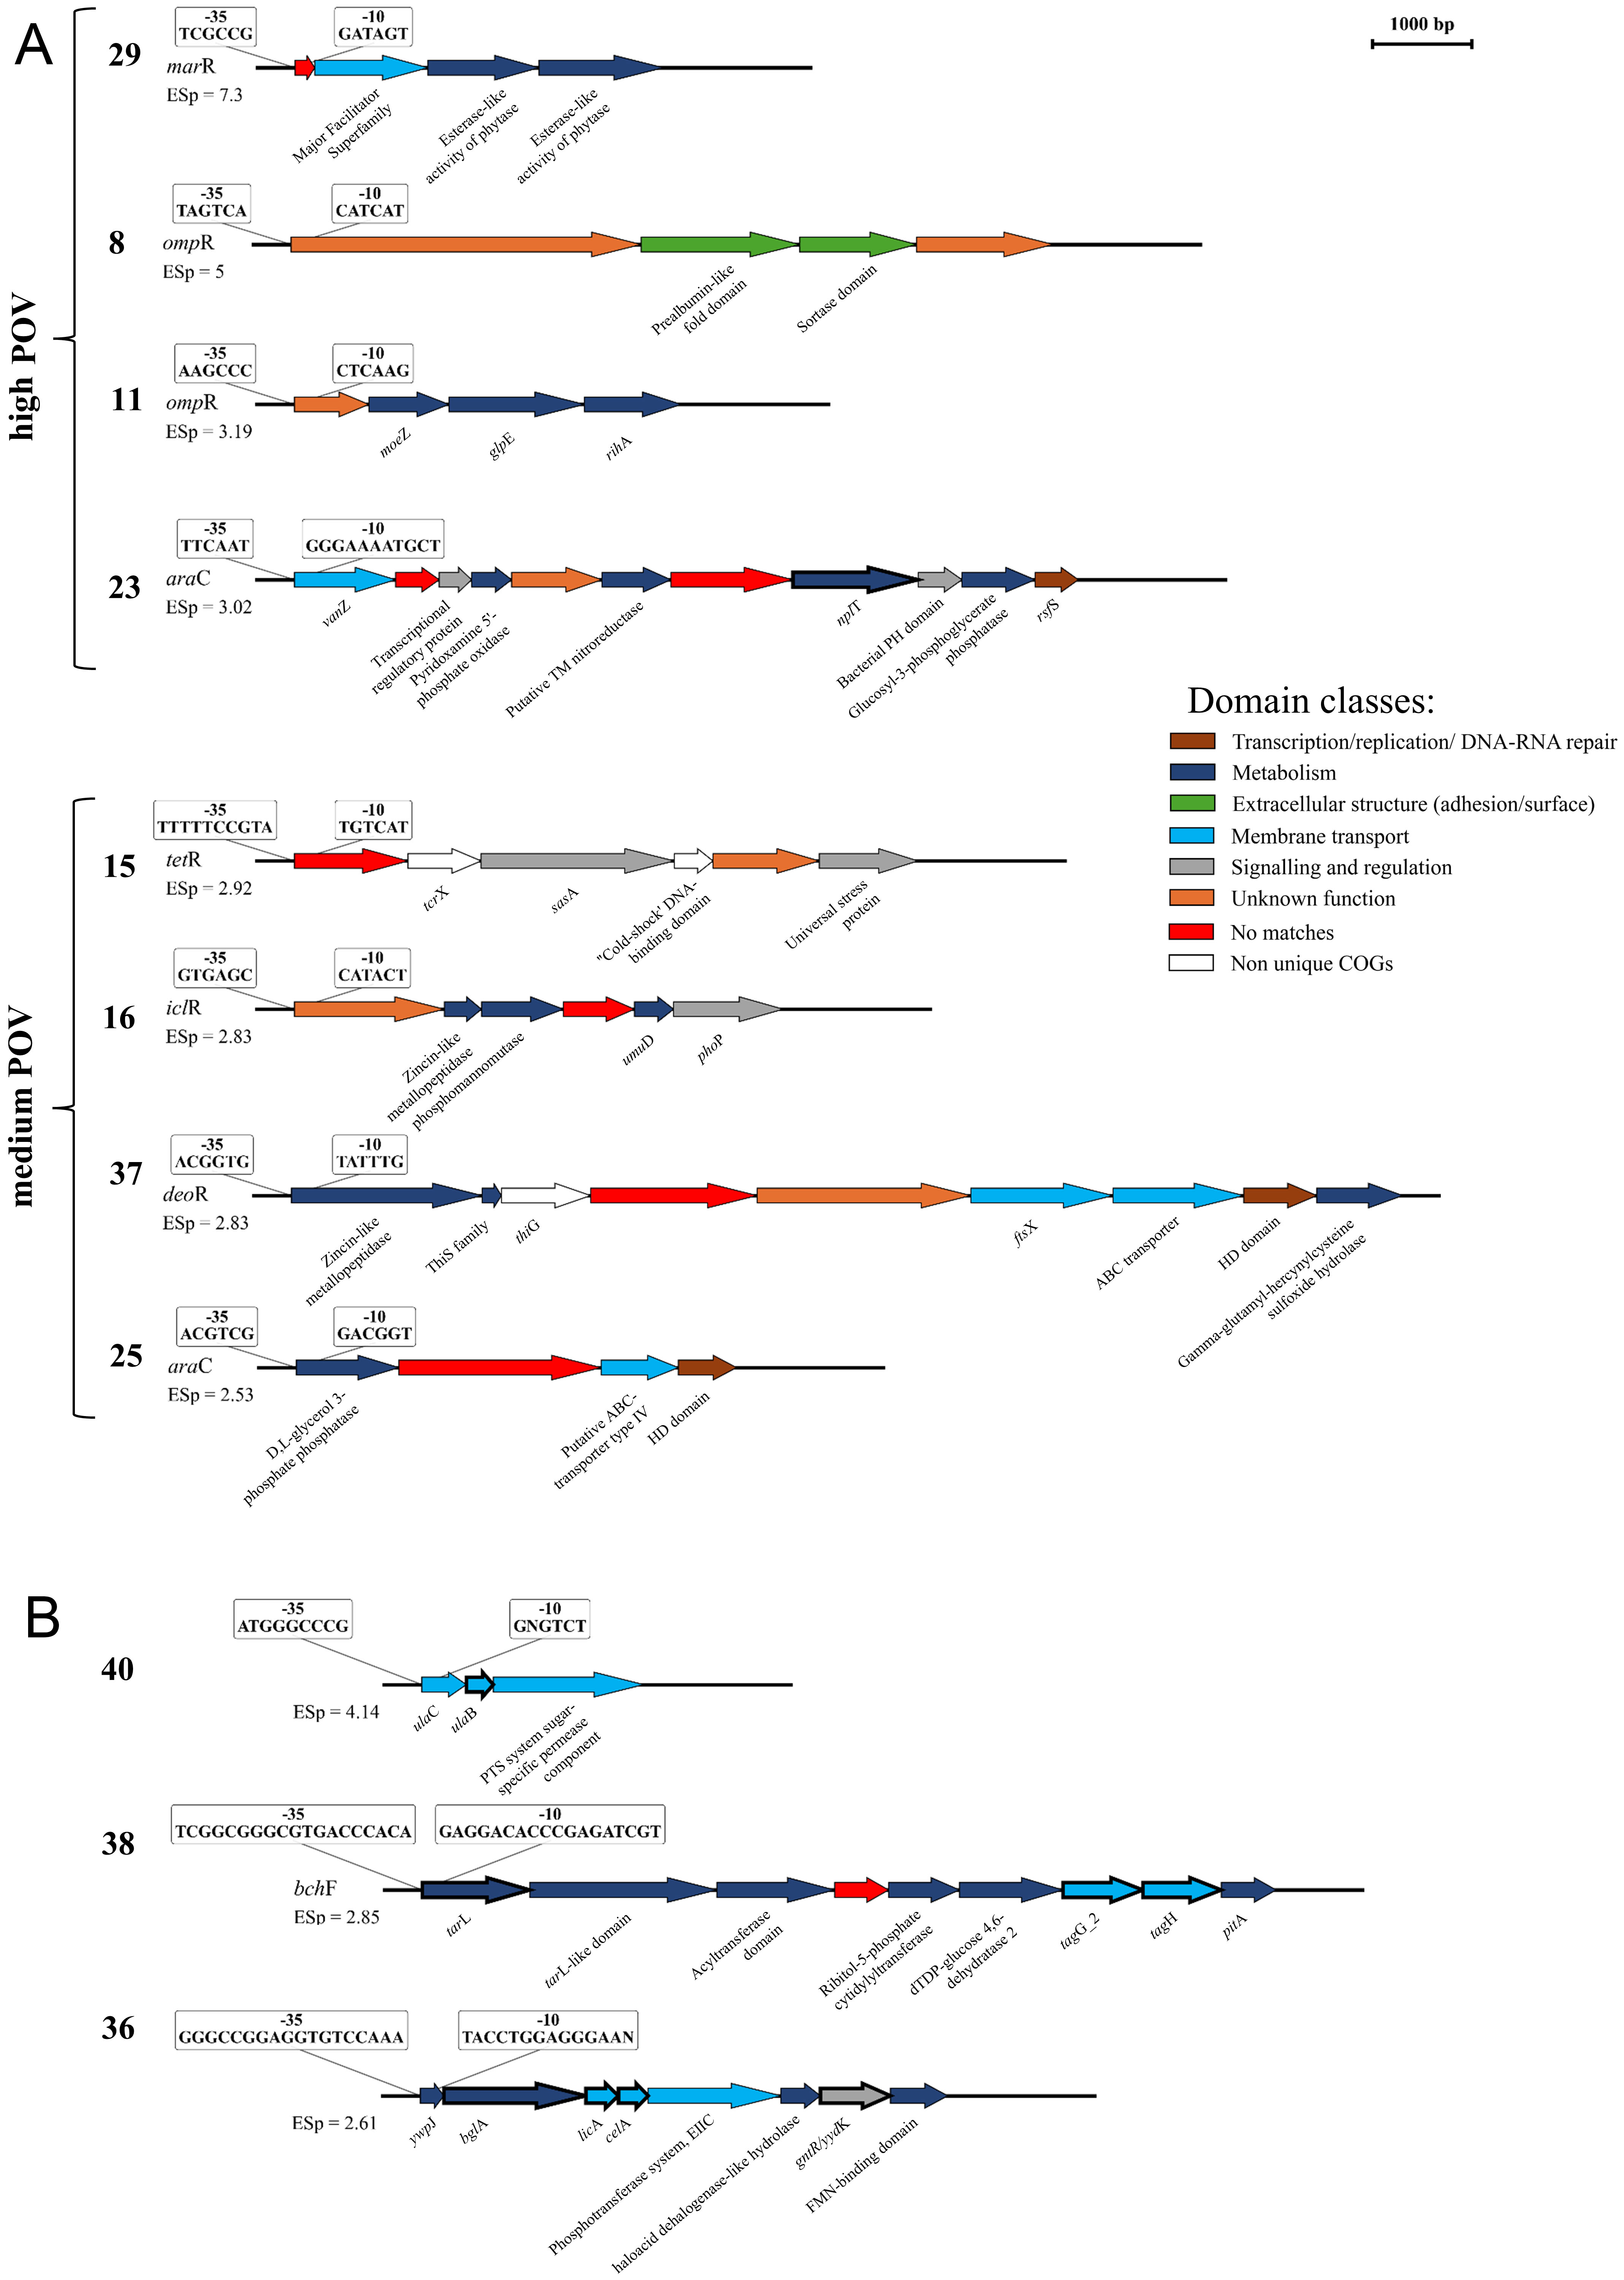
Figure 6. Putative B. bifidum operons of unique COGs, sorted by POV value. For each putative operon, the hypothetical RPBf sequences, the matching TFBs, and the energetic-structural property index of the uptake region are reported. For each gene, the orthologous gene in Roary or the protein domain identified by Interproscan is reported. (A) shows operons with medium-to-high POV values; (B) shows operons formed by COGs carrying functional annotations unique to B. bifidum compared to HBS. POV: Putative Operon Value; COG: clusters of orthologous gene; TFB: transcription factor binding site; ESp: energetic and structural properties; HBS: human-associated bifidobacterial species; RNB: RNA polymerase binding site.