


fig5
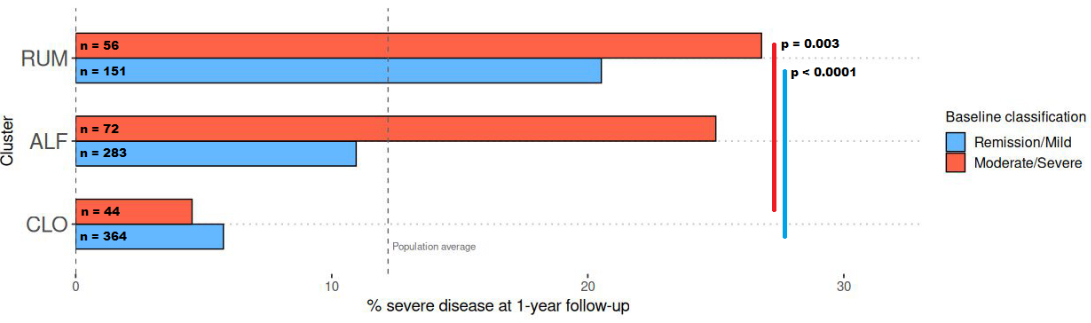
Figure 5. Barplots showing the rates of severe disease course (see Methods for definition) across two categories of baseline disease severity, by cluster. CLO exhibited a relatively low rate of severe disease course (5%-6%), whereas RUM showed a high rate (21%-27%), irrespective of baseline disease severity. Blue = remission/mild disease at baseline, red = moderate/severe disease at baseline (see METHODS for definitions). Figure created with ggplot2.0 in R. CLO: Clostridia UCG-014; ALF: Agathobacter, Lachnoclostridium, and Faecalibacterium; RUM: Ruminococcus gnavus.


