


fig4
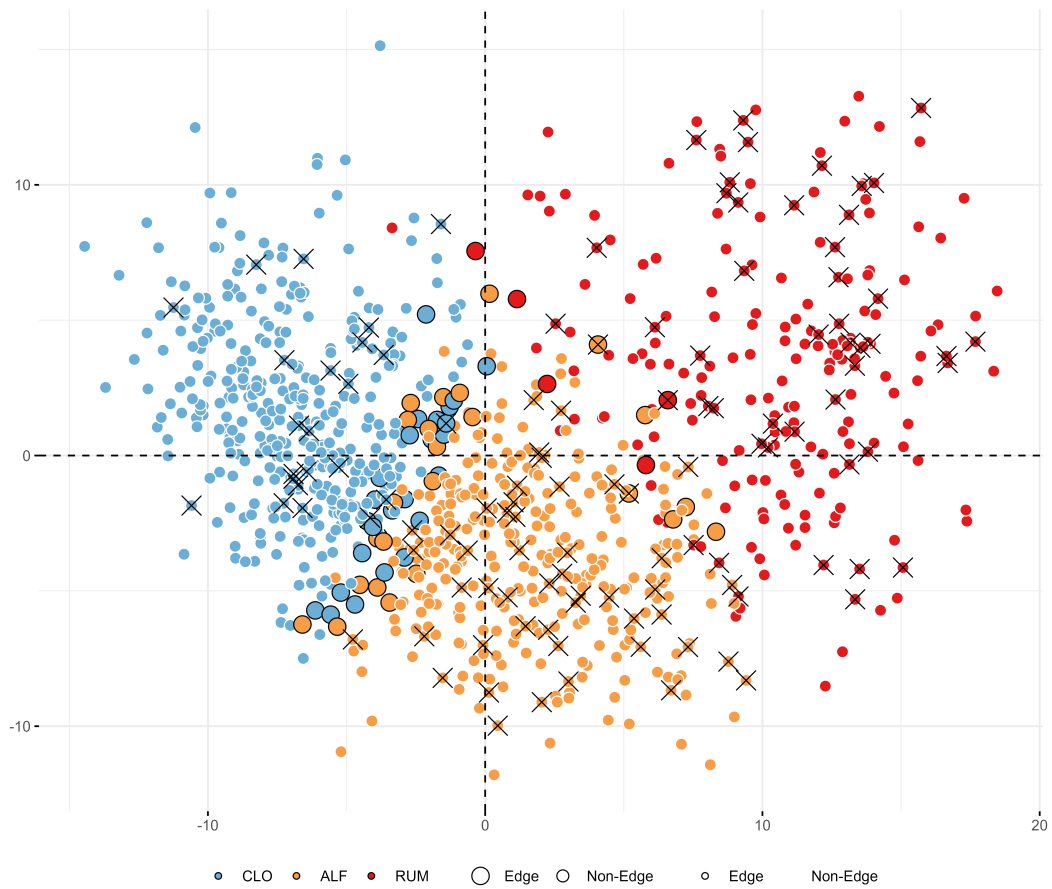
Figure 4. Beta diversity plot based on Bray-Curtis distances of relative abundances, highlighting cluster assignments (blue = CLO, yellow = ALF, red = RUM), cases of severe disease course during the first year (crosses), and samples that could not be confidently (> 90%) assigned to any cluster (larger dots with black outlines). Variance explained by PC1 = 13%, PC2 = 6%. Figure created with ggplot2.0 in R. CLO: Clostridia UCG-014; ALF: Agathobacter, Lachnoclostridium, and Faecalibacterium; RUM: Ruminococcus gnavus; PC: principal coordinates.


