fig2

Bacterial clusters are associated with the risk of severe disease progression in inflammatory bowel disease irrespective of conventional disease categories

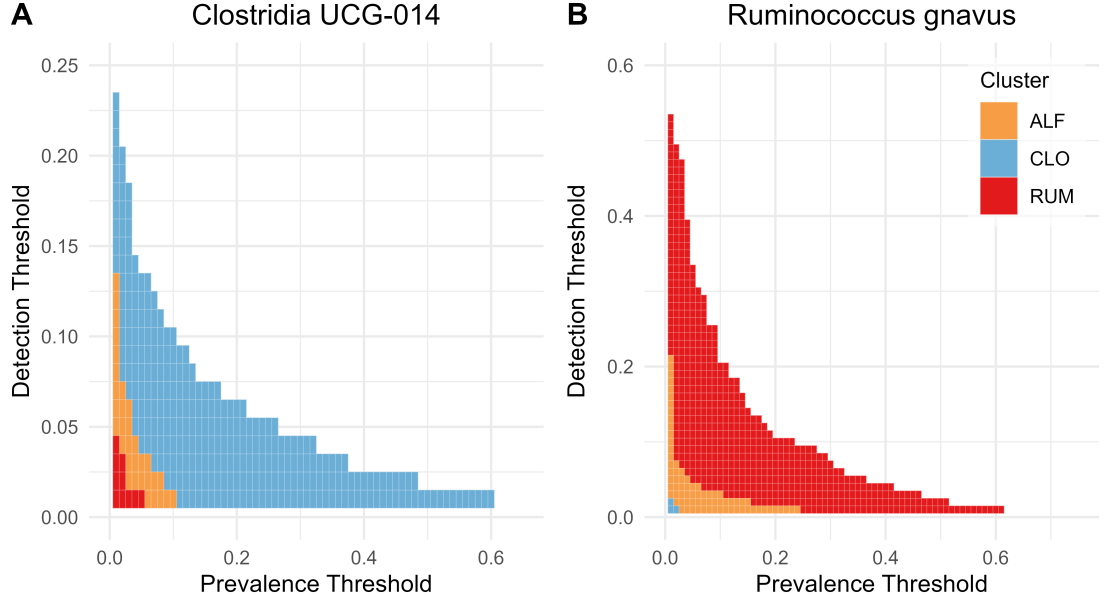
Figure 2. Heatmaps highlighting differences in prevalence and abundance (detection threshold) between clusters for (A) Ruminococcus gnavus and (B) Clostridia UCG-014. Blue = CLO, yellow = ALF, red = RUM. Figure created with ggplot2.0 in R. CLO: Clostridia UCG-014; ALF: Agathobacter, Lachnoclostridium, and Faecalibacterium; RUM: Ruminococcus gnavus.

Microbiome Research Reports
ISSN 2771-5965 (Online)

Portico

All published articles are preserved here permanently:

https://www.portico.org/publishers/oae/

Portico

All published articles are preserved here permanently:

https://www.portico.org/publishers/oae/