


fig1
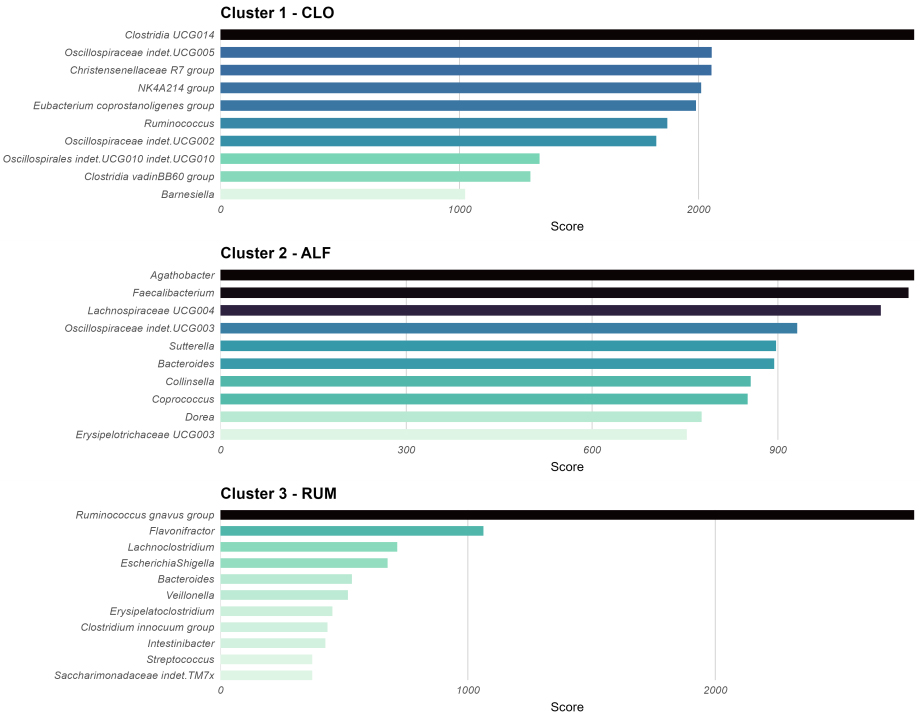
Figure 1. Summary of top-ranking taxa, calculated as the number of presences across a range of abundance and prevalence thresholds (see Methods). This plot was used to name the clusters in this study. The order of clusters in the plot is: 2, 1, 3. Cluster 2 exhibited co-dominance of several taxa (Agathobacter, Lachnospiraceae UCG-004, and Faecalibacterium), leading to the name ALF based on the initials. Cluster 1 was dominated by Clostridia UCG-014, giving the name CLO, and Cluster 3 was dominated by Ruminococcus gnavus, leading to the name RUM. Figure created with ggplot2.0 in R. CLO: Clostridia UCG-014; ALF: Agathobacter, Lachnoclostridium, and Faecalibacterium; RUM: Ruminococcus gnavus.


