


fig6
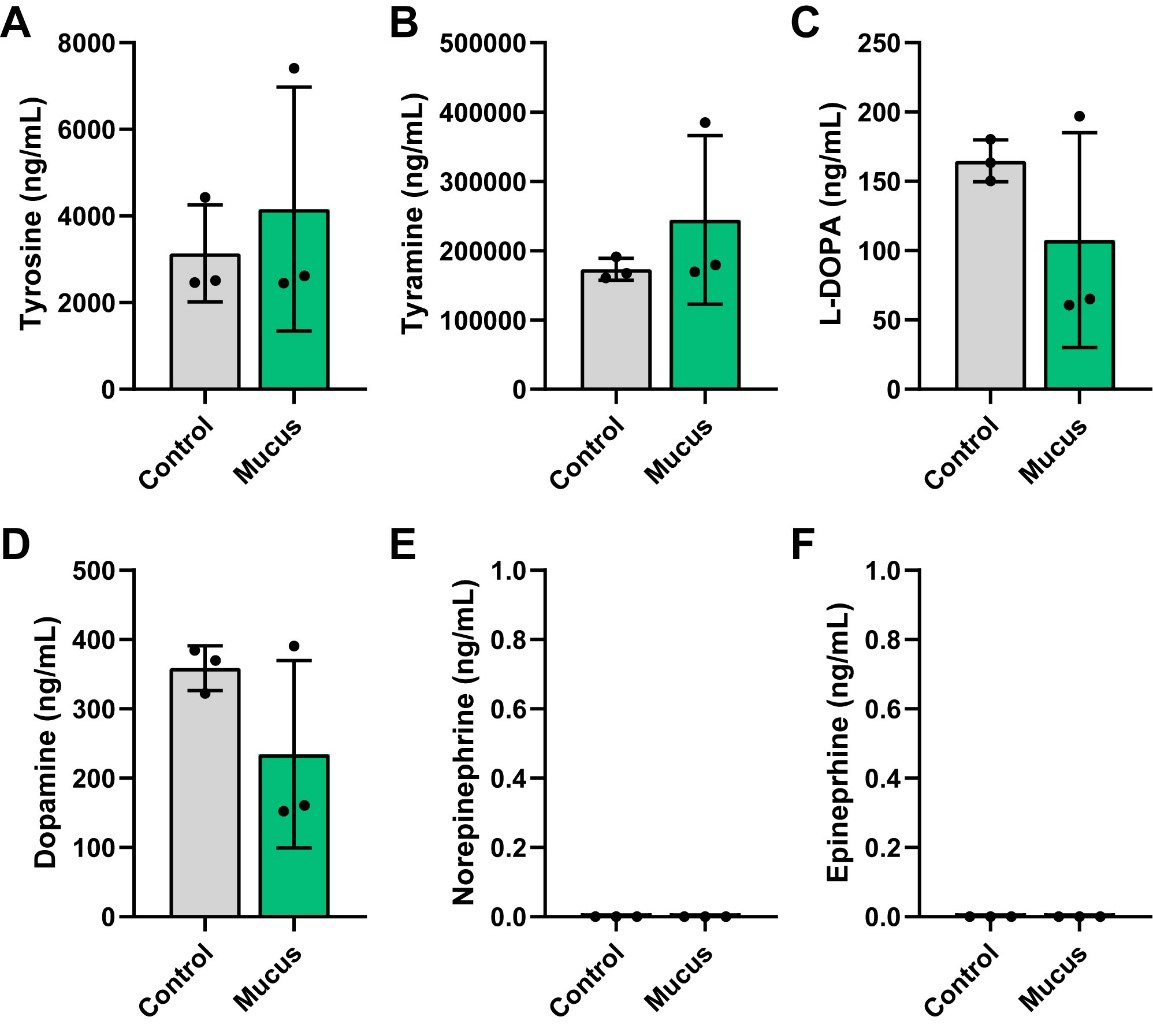
Figure 6. Individual bar graphs depicting the concentrations (ng/mL) of compounds in the tyrosine pathway in cell-free supernatant from control and MUC2-supplemented bioreactors as measured by targeted LC-MS/MS. Bar graphs represent the following compounds: (A) Tyrosine, (B) Tyramine, (C) L-DOPA, (D) Dopamine, (E) Norepinephrine, and (F) Epinephrine. Analyzed by Student's t-test. P < 0.05 (*), P ≤ 0.01 (**), P ≤ 0.001 (***), P ≤ 0.0001 (****). Each dot represents data from an individual bioreactor (n = 3) and each error bar represents the standard deviation. Student's t-test. Graphs generated using GraphPad Prism software. MUC2: Mucin 2; LC-MS/MS: liquid chromatography-tandem mass spectrometry; L-DOPA: levodopa.


